

Three-dimensional analysis of shape variations and symmetry of the fibula, tibia, calcaneus and talus
- PMID: 30393864
- PMCID: PMC6284442
- DOI: 10.1111/joa.12900
Three-dimensional analysis of shape variations and symmetry of the fibula, tibia, calcaneus and talus
Abstract
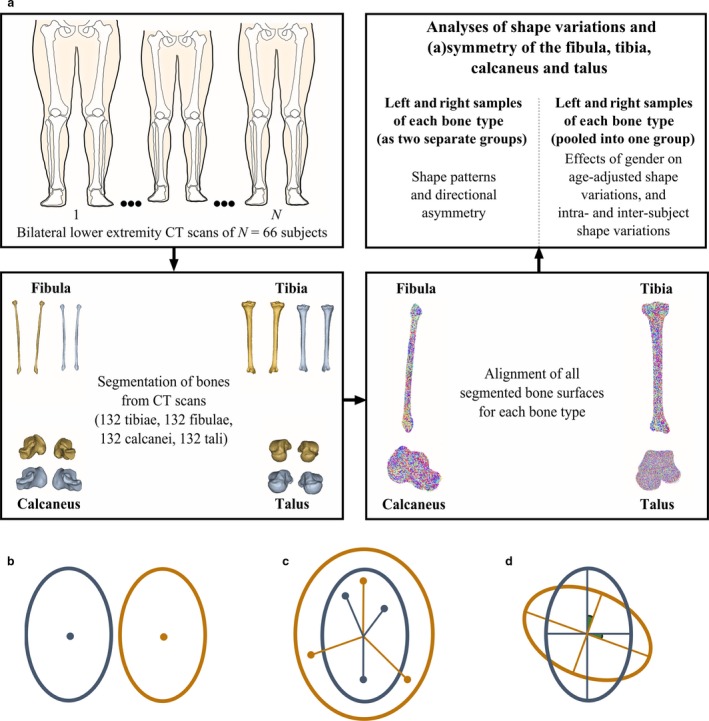
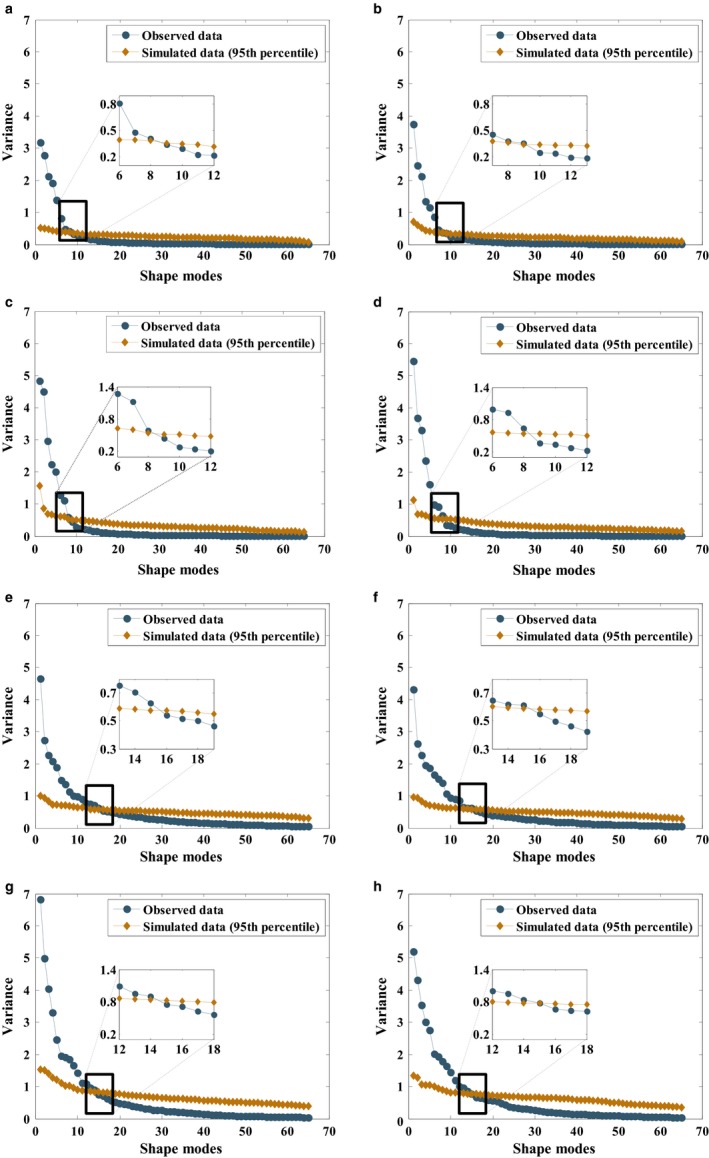
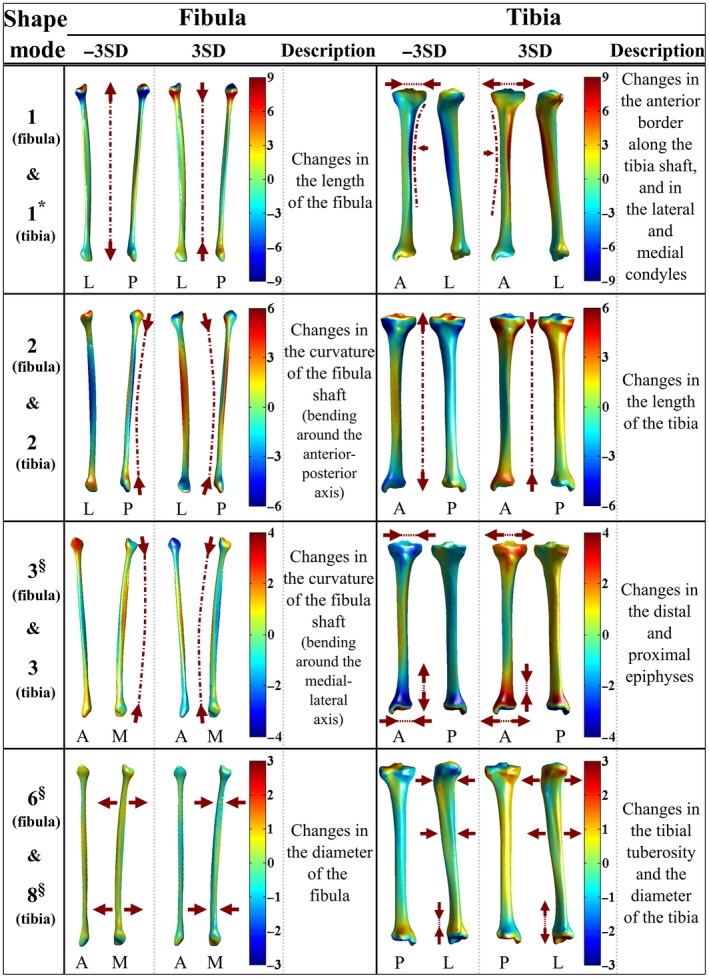
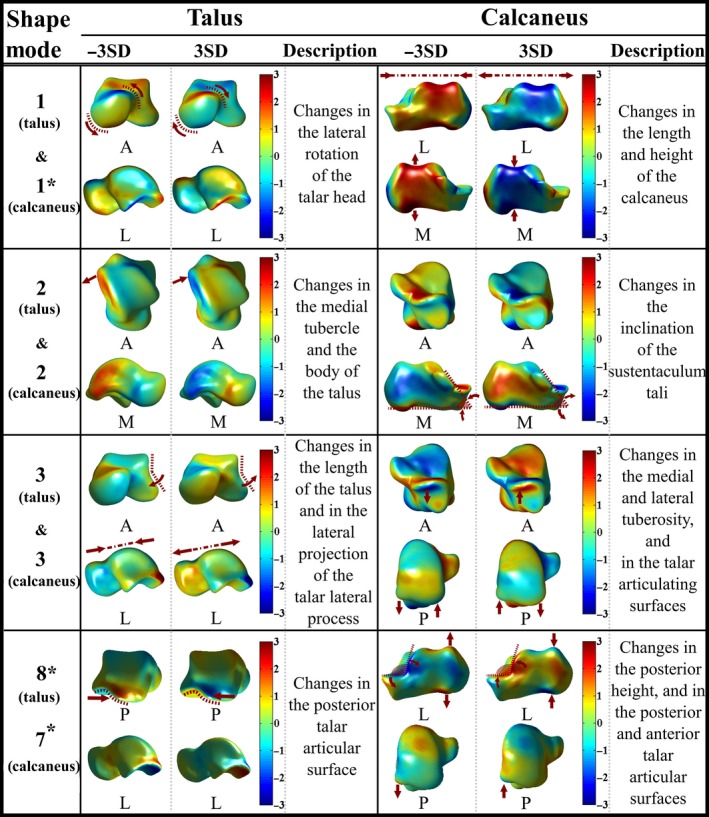
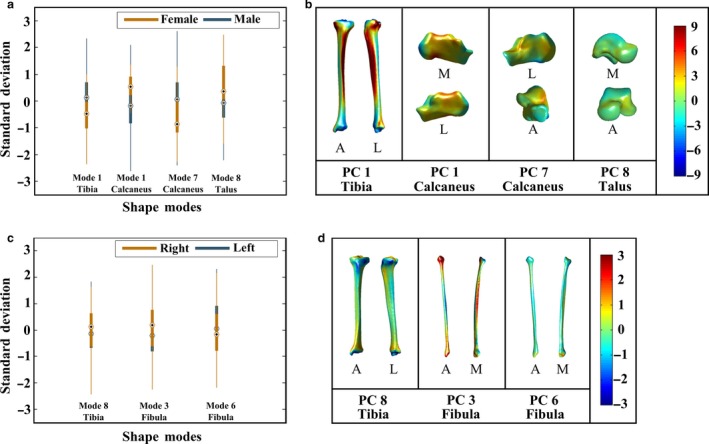
The bones forming the talocrural joint (TCJ) and subtalar joint (STJ) are often assumed to be bilaterally symmetric. Therefore, the contralateral limb (i.e. the fibula, tibia, calcaneus and talus) is used as a template or an intra-subject control in clinical and research practice. However, the validity of the symmetry assumption is controversial, because insufficient information is available on the shape variations and bilateral (a)symmetry of the fibula, tibia, calcaneus and talus. Using three-dimensional spatially dense sampled representations of bone shapes extracted from bilateral computed tomography scans of 66 individuals (55 male, mean age: 61 ± 10 years; 11 female, mean age: 53 ± 15 years), we analyzed whether: (i) similar shape patterns exist in the left and right bones of the same type; (ii) gender has an effect on bone shape variations; (iii) intra-subject shape variation is smaller than that of inter-subject for a given shape variance direction. For the first set of analyses, all left and right instances of the same type of bone were considered as two separate groups, and statistically compared with each other on multiple aspects including group location (central tendency), variance-covariance scale (dispersion) and orientation (covariance structure) using distance-based permutational tests. For the second and third sets of analyses, all left and right bones of the same type were pooled into one group, and shape variations in the TCJ and STJ bones were extracted using principal component analysis. The effects of gender on age-adjusted bone shape differences were assessed using an analysis of covariance. Moreover, intra-class correlation was employed to evaluate intra- and inter-subject bone shape variations. For each bone type, both sides had similar shape patterns (Ppermutational -values > 0.05). After Bonferroni adjustment, gender led to shape differences, which were mainly in the lateral and medial condyles of the tibia (P = 0.003), the length and height of the calcaneus (P < 0.001), the posterior and anterior talar articular surfaces of the calcaneus (P = 0.001), and in the posterior aspect of the talus (P = 0.001). Intra-subject shape variations in the tibial tuberosity together with the diameter of the tibia, and the curvature of the fibula shaft and the diameter of the fibula were as high as those of inter-subject. This result suggests that the shape symmetry assumption could be violated for some specific shape variations in the fibula and tibia.
Keywords: bilateral symmetry; calcaneus; fibula; subtalar joint; talocrural joint; talus; tibia.
© 2018 The Authors. Journal of Anatomy published by John Wiley & Sons Ltd on behalf of Anatomical Society.
Figures
Similar articles
-
Typical Shape Differences in the Subtalar Joint Bones Between Subjects with Chronic Ankle Instability and Controls.J Orthop Res. 2019 Sep;37(9):1892-1902. doi: 10.1002/jor.24336. Epub 2019 May 26. J Orthop Res. 2019. PMID: 31042001 Free PMC article.
-
Classification of the subtalar articular surface and its matching situation: an anatomical study on Chinese subtalar joint.Surg Radiol Anat. 2020 Oct;42(10):1133-1139. doi: 10.1007/s00276-020-02444-4. Epub 2020 Feb 28. Surg Radiol Anat. 2020. PMID: 32112282
-
Three-dimensional morphological variations in the calcaneus and talus in relation to the hallux valgus angle.Ann Anat. 2023 Apr;247:152053. doi: 10.1016/j.aanat.2023.152053. Epub 2023 Jan 22. Ann Anat. 2023. PMID: 36696928
-
Anatomy of the subtalar joint and imaging of talo-calcaneal coalition.Skeletal Radiol. 2009 May;38(5):437-49. doi: 10.1007/s00256-008-0615-4. Epub 2008 Dec 19. Skeletal Radiol. 2009. PMID: 19096839 Review.
-
Talus bone: normal anatomy, anatomical variations and clinical correlations.Anat Sci Int. 2023 Jul;98(3):391-406. doi: 10.1007/s12565-023-00712-y. Epub 2023 Apr 5. Anat Sci Int. 2023. PMID: 37017903 Review.
Cited by
-
Toward improved understanding of foot shape, foot posture, and foot biomechanics during running: A narrative review.Front Physiol. 2022 Dec 8;13:1062598. doi: 10.3389/fphys.2022.1062598. eCollection 2022. Front Physiol. 2022. PMID: 36569759 Free PMC article. Review.
-
Anthropomorphic Characterization of Ankle Joint.Bioengineering (Basel). 2023 Oct 17;10(10):1212. doi: 10.3390/bioengineering10101212. Bioengineering (Basel). 2023. PMID: 37892942 Free PMC article.
-
Bilateral Symmetry, Sex Differences, and Primary Shape Factors in Ankle and Hindfoot Bone Morphology.Foot Ankle Orthop. 2020 Mar 6;5(1):2473011420908796. doi: 10.1177/2473011420908796. eCollection 2020 Jan. Foot Ankle Orthop. 2020. PMID: 35097367 Free PMC article.
-
Influence of Talar and Calcaneal Morphology on Subtalar Kinematics During Walking.Foot Ankle Int. 2024 Jun;45(6):632-640. doi: 10.1177/10711007241231981. Epub 2024 Mar 15. Foot Ankle Int. 2024. PMID: 38491768 Free PMC article.
-
Geometric variation of the human tibia-fibula: a public dataset of tibia-fibula surface meshes and statistical shape model.PeerJ. 2023 Feb 16;11:e14708. doi: 10.7717/peerj.14708. eCollection 2023. PeerJ. 2023. PMID: 36811007 Free PMC article.
References
Publication types
MeSH terms
LinkOut - more resources
Full Text Sources
