. 2019 Feb;8(2):179-193.
doi: 10.1002/sctm.18-0026. Epub 2018 Nov 4.

Functional Voltage-Gated Calcium Channels Are Present in Human Embryonic Stem Cell-Derived Retinal Pigment Epithelium

Affiliations

Functional Voltage-Gated Calcium Channels Are Present in Human Embryonic Stem Cell-Derived Retinal Pigment Epithelium

Iina Korkka et al. Stem Cells Transl Med. 2019 Feb.

Abstract

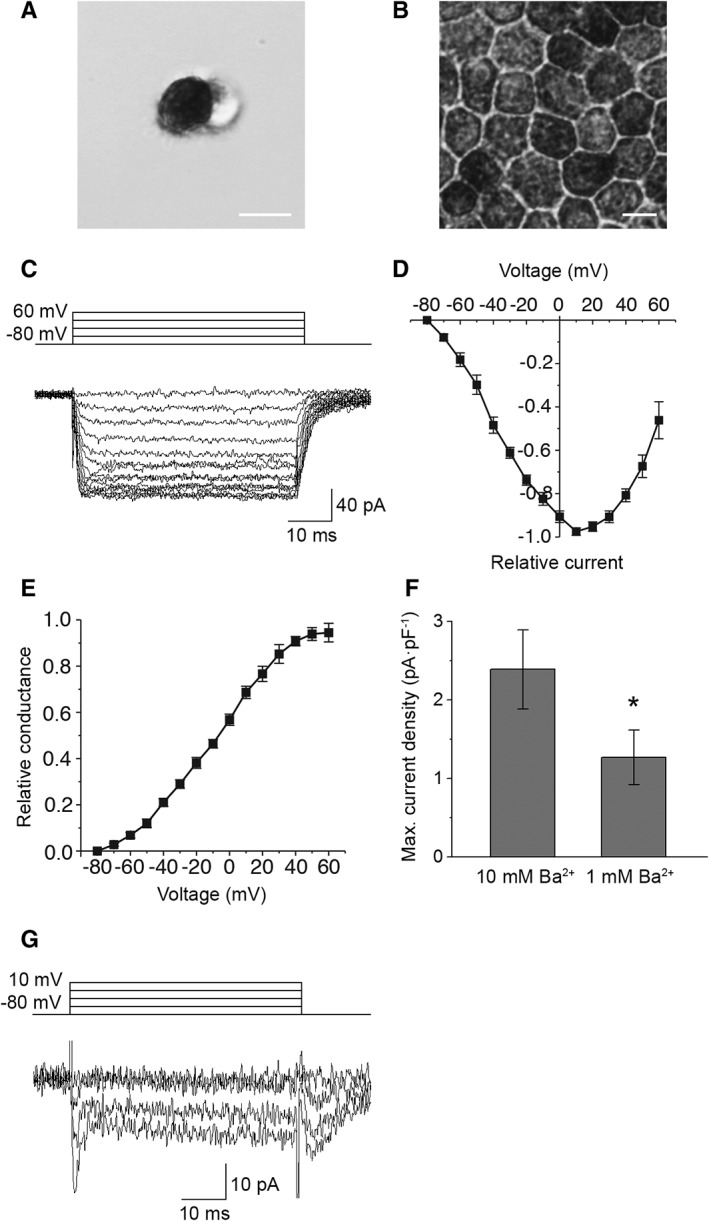
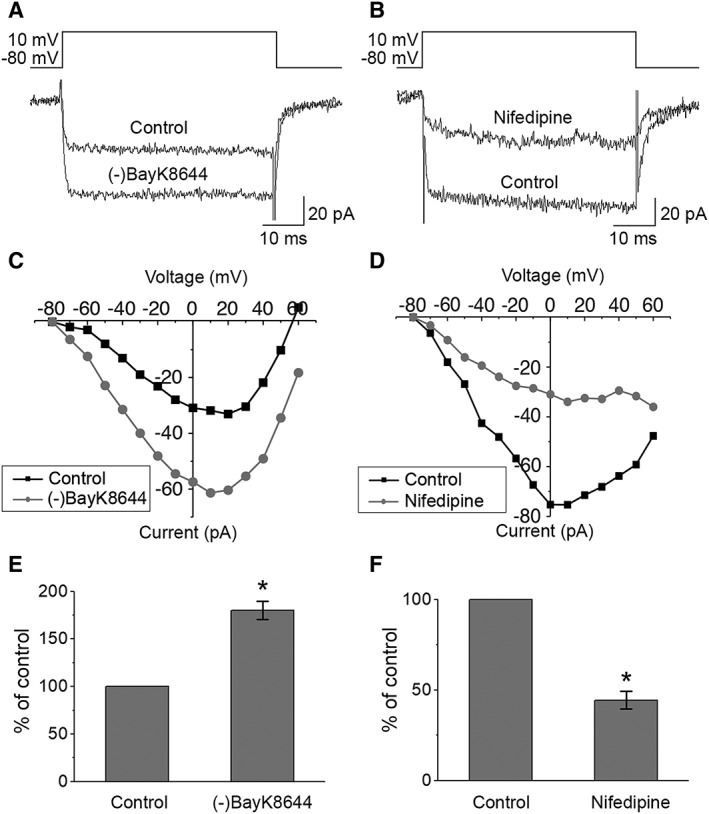
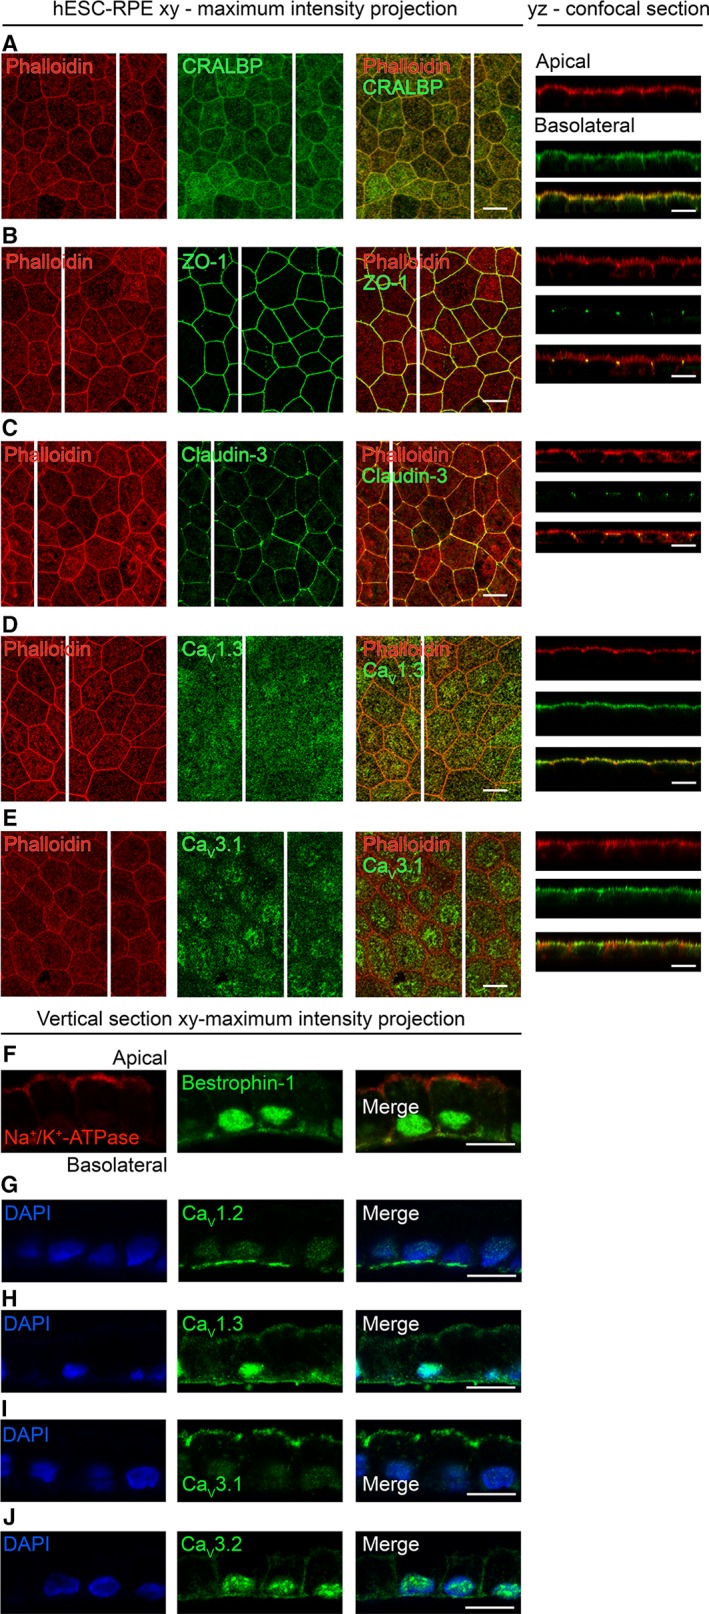
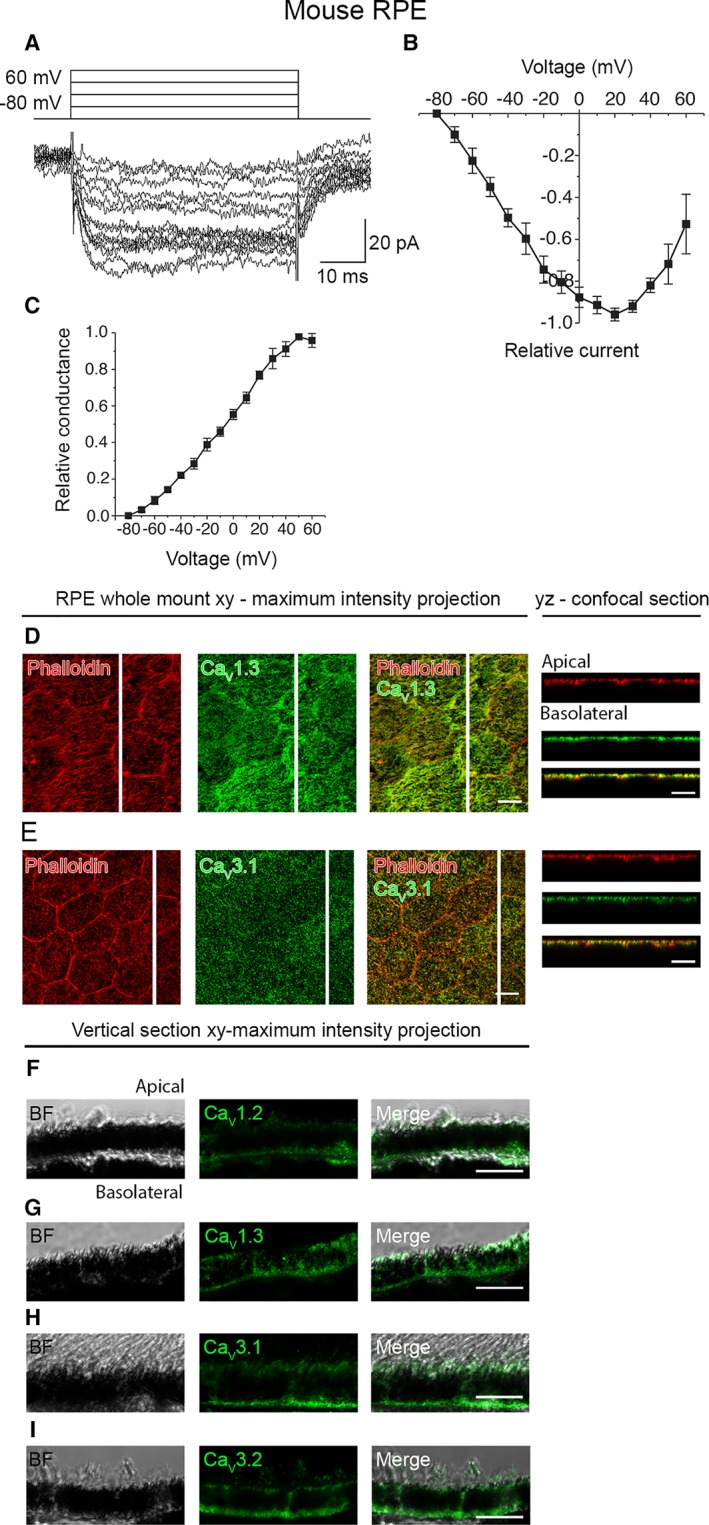
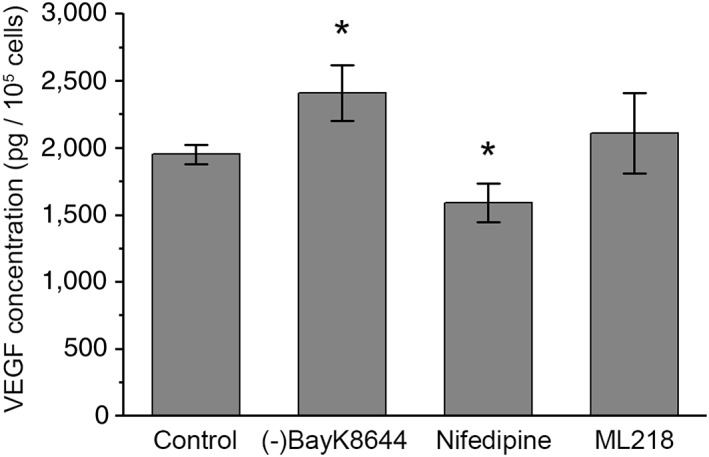
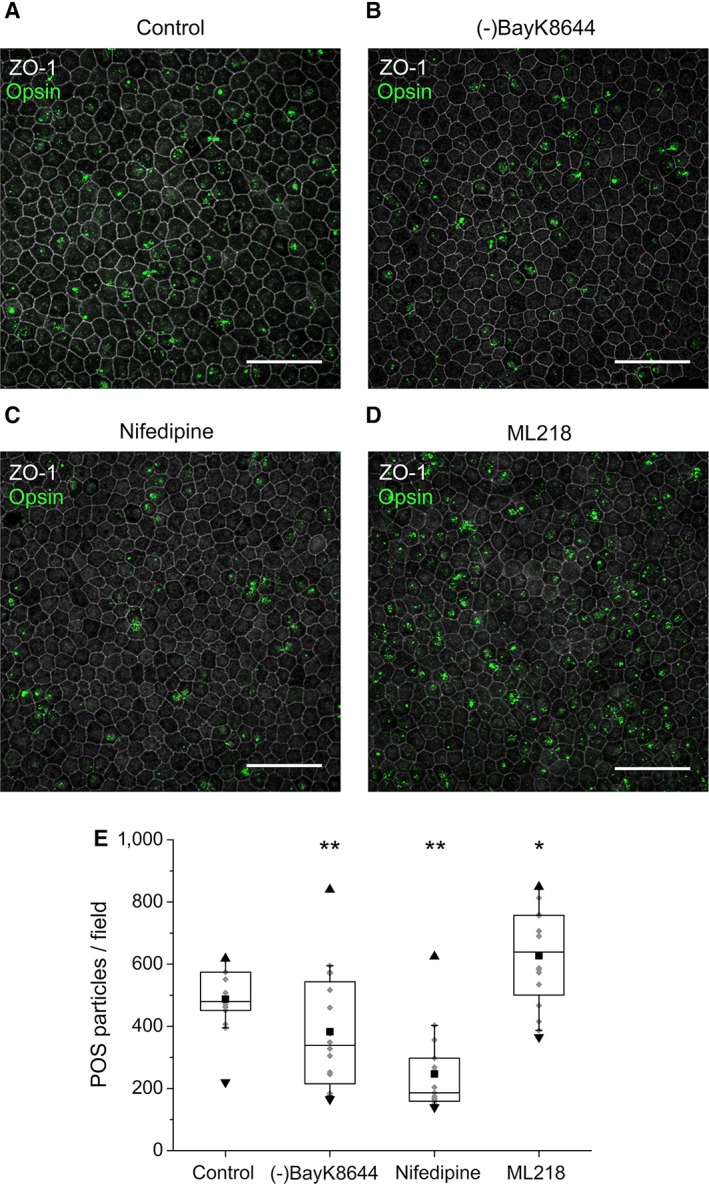
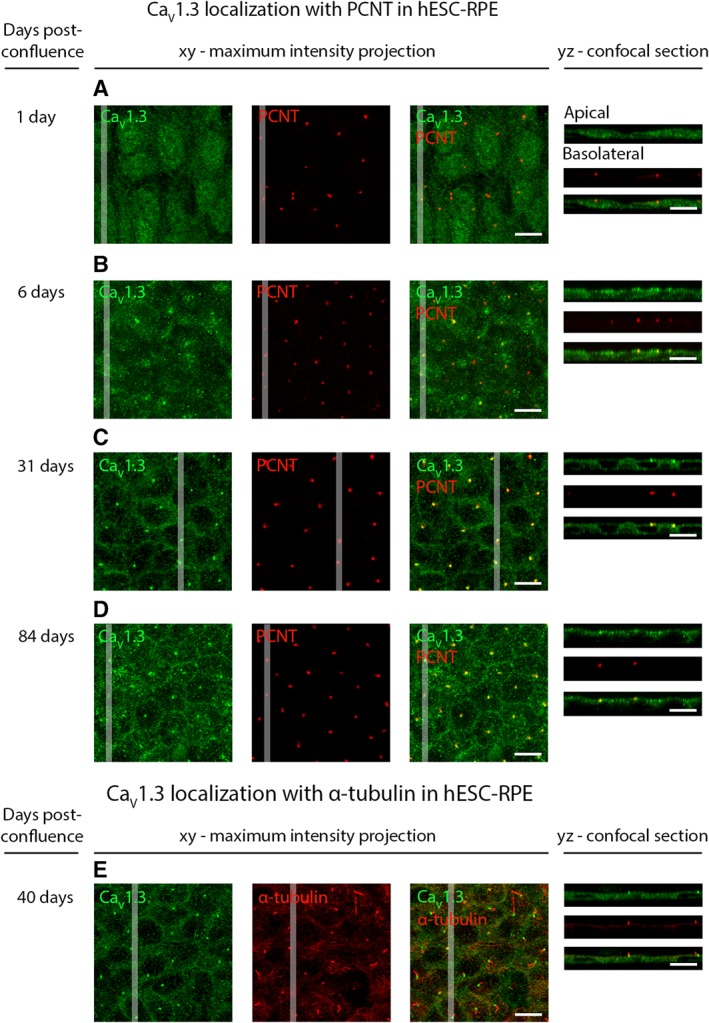
Retinal pigment epithelium (RPE) performs important functions for the maintenance of photoreceptors and vision. Malfunctions within the RPE are implicated in several retinal diseases for which transplantations of stem cell-derived RPE are promising treatment options. Their success, however, is largely dependent on the functionality of the transplanted cells. This requires correct cellular physiology, which is highly influenced by the various ion channels of RPE, including voltage-gated Ca2+ (CaV ) channels. This study investigated the localization and functionality of CaV channels in human embryonic stem cell (hESC)-derived RPE. Whole-cell patch-clamp recordings from these cells revealed slowly inactivating L-type currents comparable to freshly isolated mouse RPE. Some hESC-RPE cells also carried fast transient T-type resembling currents. These findings were confirmed by immunostainings from both hESC- and mouse RPE that showed the presence of the L-type Ca2+ channels CaV 1.2 and CaV 1.3 as well as the T-type Ca2+ channels CaV 3.1 and CaV 3.2. The localization of the major subtype, CaV 1.3, changed during hESC-RPE maturation co-localizing with pericentrin to the base of the primary cilium before reaching more homogeneous membrane localization comparable to mouse RPE. Based on functional assessment, the L-type Ca2+ channels participated in the regulation of vascular endothelial growth factor secretion as well as in the phagocytosis of photoreceptor outer segments in hESC-RPE. Overall, this study demonstrates that a functional machinery of voltage-gated Ca2+ channels is present in mature hESC-RPE, which is promising for the success of transplantation therapies. Stem Cells Translational Medicine 2019;8:179&15.

Keywords: Patch-clamp; Phagocytosis; Retinal pigment epithelium; Stem cells; Vascular endothelial growth factor; Voltage-gated Ca2+ channels.


Figures

Figure 1
Figure 1
Voltage‐gated currents in hESC‐RPE. Examples of bright‐field microscopy images of (A) a single hESC‐RPE cell showing pigmented apical and non‐pigmented basal sides and (B) a mature hESC‐RPE monolayer with representative RPE morphology, scale bars 10 μm. Whole‐cell voltage clamp recordings were carried out from single hESC‐RPE cells. (C): A typical example of the slowly inactivating current elicited by 50 ms voltage steps from −80 to +60 mV in 10 mV increments. Normalized and averaged (D) IV‐curve and (E) GV‐curve of the slowly inactivating current (mean ± SEM, n = 9, cell lines 08/017 and 08/023, days post‐confluence 73–128). (F): Averaged maximum current densities (obtained at 10 mV) of the slowly inactivating current in 10 mM Ba2+ (n = 9) and in 1 mM Ba2+ (n = 7, cell lines 08/017 and 08/023, days post‐confluence 109–127). The difference in the current densities was statistically significant. (G): A typical example of the fast inactivating current elicited by 50 ms voltage steps from −80 to +10 mV in 10 mV increments (cell line 08/023, days post‐confluence 109). *Statistically significant difference with p < .05.
Figure 2
Figure 2
Responses of the currents to Ca2+ channel modulators. Whole‐cell measurements of currents as responses to voltage pulses from −80 to +60 mV in 10 mV increments for 50 ms duration were performed before and after the application of the specific drugs. Examples of the effects of (A) L‐type Ca2+ channel activator 10 μM (‐)BayK8644 and (B) L‐type Ca2+ channel inhibitor 10 μM nifedipine on Ba2+ currents in hESC‐RPE and (C, D) the corresponding IV‐curves, respectively. Changes in maximum current amplitudes presented as percentages from control conditions (mean ± SEM) show that both (E) activation with (‐)BayK8644 (n = 3, cell line 08/017, days post‐confluence 73–74) and (F) inhibition with nifedipine (n = 4, cell line 08/017, days post‐confluence 73–99) resulted in statistically significant changes in the recorded currents. *Statistically significant difference with p < .05.
Figure 3
Figure 3
Localization of CaV channels in hESC‐RPE. Immunostainings of RPE monolayers with xy‐maximum intensity projections and yz‐confocal sections (apical side upwards, localization of the section highlighted with a white bar). Actin cytoskeleton (phalloidin, red) labeled together with (A) RPE marker CRALBP (green, cell line 08/017, days post‐confluence 91), (B) tight junction markers ZO‐1, (green, cell line 08/017, days post‐confluence 74) and (C) claudin‐3 (green, cell line 08/017, days post‐confluence 91), (D) L‐type Ca2+ channel CaV1.3 (green, cell line 08/017, days post‐confluence 109), and (E) T‐type Ca2+ channel CaV3.1 (green, cell line 08/023, days post‐confluence 66). Immunostainings of paraffin embedded hESC‐RPE vertical sections with xy‐maximum intensity projections (apical side upwards). (F): Cell polarization markers Na+/K+‐ATPase (red) and Bestrophin‐1 (green, cell line 08/023, days post‐confluence 91). Cell nuclei (DAPI, blue) together with L‐type Ca2+ channels (G) CaV1.2 (green, cell line 08/017, days post‐confluence 84) and (H) CaV1.3 (green, cell line 08/023, days post‐confluence 91), and T‐type Ca2+ channels (I) CaV3.1 (green, cell line 08/017, days post‐confluence 84) and (J) CaV3.2 (green, cell line 08/017, days post‐confluence 84). Scale bars 10 μm. Abbreviations: CaV, voltage‐gated Ca2+ channel; CRALBP, cellular retinaldehyde‐binding protein; ZO‐1, Zonula occludens; DAPI, 4′,6‐diamidino‐2‐phenylidole; hESC, human embryonic stem cell; RPE, retinal pigment epithelium.
Figure 4
Figure 4
CaV channels in mouse RPE. (A): An example of the slowly inactivating L‐type current measured in whole‐cell configuration and elicited by 50 ms voltage steps from −80 to +60 mV in 10 mV increments. (B): Normalized and averaged IV‐curve of the L‐type current (mean ± SEM, n = 4). (C): Normalized and averaged GV‐curve of the L‐type current (mean ± SEM, n = 4). Localization of the CaV channels assessed by immunostainings of mouse RPE‐eyecup whole mount preparations. Confocal images show the xy‐maximum intensity projections and yz‐confocal sections of the samples (apical side upwards, localization of the section highlighted with a white bar). Actin cytoskeleton (phalloidin, red) together with (D) L‐type Ca2+ channel CaV1.3 (green), and (E) T‐type Ca2+ channel CaV3.1 (green). Immunostainings of paraffin embedded vertical sections of mouse eyecups shown as xy‐maximum intensity projections (apical side upwards). BF images together with L‐type Ca2+ channels (F) CaV1.2 (green) and (G) CaV1.3 (green), and T‐type Ca2+ channels (H) CaV3.1 (green) and (I) CaV3.2 (green). Scale bars 10 μm. Abbreviations: CaV, voltage‐gated Ca2+ channel; BF, bright‐field; RPE, retinal pigment epithelium.
Figure 5
Figure 5
VEGF secretion from hESC‐RPE. Total concentrations of VEGF secreted by the hESC‐RPE after 24‐hour incubation in control medium alone (n = 9) as well as in control medium with L‐type Ca2+ channel activator 10 μM (‐)BayK8644 (n = 9), L‐type Ca2+ channel inhibitor 10 μM nifedipine (n = 8), or T‐type channel inhibitor 5 μM ML218 (n = 8) (mean ± SEM, cell lines 08/023 and 11/013, days post‐confluence 66–147). *Statistically significant difference with p < .05. Abbreviation: VEGF, vascular endothelial growth factor.
Figure 6
Figure 6
The effect of CaV channel modulators on POS phagocytosis in hESC‐RPE. Mature hESC‐RPE monolayers were incubated with purified porcine POSs in the pulse‐chase phagocytosis assay. Xy‐maximun intensity projections of the confocal images show both bound and internalized POS particles that were stained with opsin (green) together with the tight junction protein ZO‐1 (gray) in (A) control conditions, and in the presence of CaV channel modulators (B) (‐)BayK8644, (C) nifedipine, or (D) ML218. Scale bars 50 μm. (E): Quantification of POS particles in control conditions yielded the median value of 485 POS particles/field (n = 16). When modulating the CaV channels pharmacologically, the value changed in the presence of (‐)BayK8644 to 339 POS particles/field (n = 15), nifedipine to 186 POS particles/field (n = 15), and ML218 to 639 POS particles/field (n = 16). The box limits 25%–75% of the gray data points; the whiskers include 10%–90% of the data; the center line shows the median value; the black square describes the mean; the black triangles present the minimum and the maximum values. Cell line 11/013, days post‐confluence 147. Statistically significant differences with *p < .05 or **p < .001. Abbreviations: POS, photoreceptor outer segment; ZO‐1, Zonula occludens.
Figure 7
Figure 7
Localization of CaV1.3 during hESC‐RPE maturation. Immunolabeling of CaV1.3 (green) together with centrosome protein PCNT (red) from post‐confluence day 1 to post‐confluence day 84 at four time points: (A) day 1, (B) day 6, (C) day 31, and (D) day 84 (cell line 08/017). (E): Labeling acetylated α‐tubulin (red) together with CaV1.3 (green) shows the localization of CaV1.3 at the base of the primary cilia during maturation (cell line 08/017, days post‐confluence 40). The confocal images are shown as xy‐maximum intensity projections and yz‐confocal sections (apical side upwards, localization of the section highlighted with a white bar). Scale bars 10 μm. Abbreviations: CaV, voltage‐gated Ca2+ channel; hESC, human embryonic stem cell; RPE, retinal pigment epithelium; PCNT, pericentrin.

Similar articles

Cited by

References

    1. Strauss O. The retinal pigment epithelium in visual function. Physiol Rev 2005;85:845‐881. - PubMed
    1. Wimmers S, Karl MO, Strauss O. Ion channels in the RPE. Prog Retin Eye Res 2007;26:263‐301. - PubMed
    1. Ferrington DA, Sinha D, Kaarniranta K. Defects in retinal pigment epithelial cell proteolysis and the pathology associated with age‐related macular degeneration. Prog Retin Eye Res 2016;51:69‐89. - PMC - PubMed
    1. Wong WL, Su X, Li X et al. Global prevalence of age‐related macular degeneration and disease burden projection for 2020 and 2040: A systematic review and meta‐analysis. Lancet Glob Health 2014;2:e106‐e116. - PubMed
    1. Riera M, Fontrodona L, Albert S et al. Comparative study of human embryonic stem cells (hESC) and human induced pluripotent stem cells (hiPSC) as a treatment for retinal dystrophies. Mol Ther Methods Clin Dev 2016;3:1‐12. - PMC - PubMed

Publication types