. 2019 Mar;81(3):1863-1875.
doi: 10.1002/mrm.27545. Epub 2018 Nov 5.

Realistic 4D MRI abdominal phantom for the evaluation and comparison of acquisition and reconstruction techniques

Affiliations

Realistic 4D MRI abdominal phantom for the evaluation and comparison of acquisition and reconstruction techniques

Wei-Ching Lo et al. Magn Reson Med. 2019 Mar.

Abstract

Purpose: This work presents a 4D numerical abdominal phantom, which includes T1 and T2 relaxation times, proton density fat fraction, perfusion, and diffusion, as well as respiratory motion for the evaluation and comparison of acquisition and reconstruction techniques.

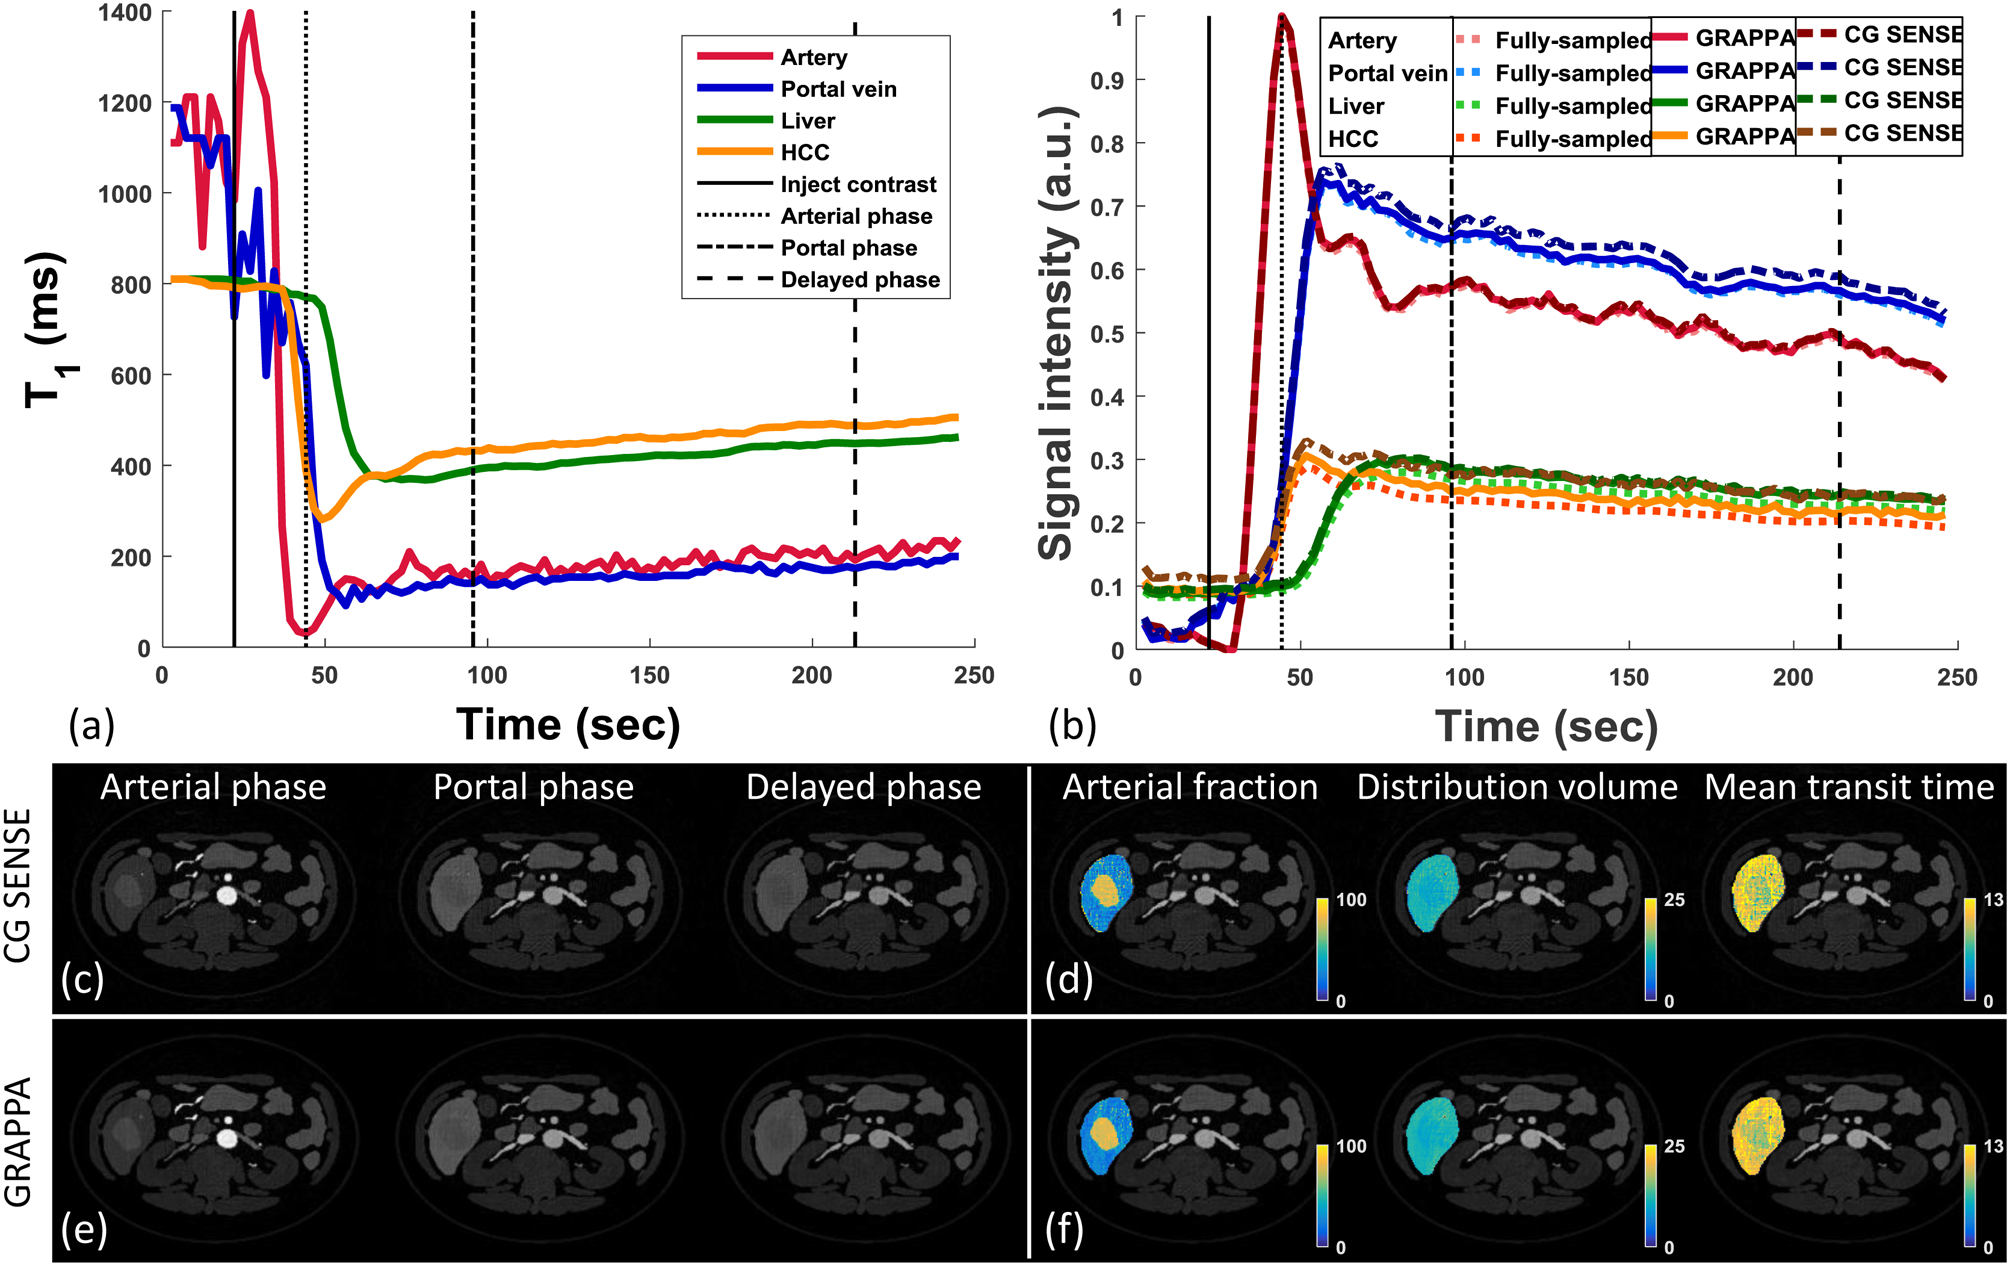
Methods: The 3D anatomical mesh models were non-rigidly scaled and shifted by respiratory motion derived from an in vivo scan. A time series of voxelized 3D abdominal phantom images were obtained with contrast determined by the tissue properties and pulse sequence parameters. Two example simulations: (1) 3D T1 mapping under breath-hold and free-breathing acquisition conditions and (2) two different reconstruction techniques for accelerated 3D dynamic contrast-enhanced MRI, are presented. The source codes can be found at https://github.com/SeiberlichLab/Abdominal_MR_Phantom.

Results: The proposed 4D abdominal phantom can successfully simulate images and MRI data with nonrigid respiratory motion and specific contrast settings and data sampling schemes. In example 1, the use of a numerical 4D abdominal phantom was demonstrated to aid in the comparison between different approaches for volumetric T1 mapping. In example 2, the average arterial fraction over the healthy hepatic parenchyma as calculated with spiral generalized autocalibrating partial parallel acquisition was closer to that from the fully sampled data than the arterial fraction from conjugate gradient sensitivity encoding, although both are elevated compared to the gold-standard reference.

Conclusion: This realistic abdominal MR phantom can be used to simulate different pulse sequences and data sampling schemes for the comparison of acquisition and reconstruction methods under controlled conditions that are impossible or prohibitively difficult to perform in vivo.

Keywords: MRI; abdomen; digital phantom; free breathing.


Figures

Figure 1.
Figure 1.
Phantom generation workflow. During phantom generation, all 3D mesh models were non-rigidly scaled and shifted by respiratory motion at a specified temporal resolution. One specific index value was assigned to each voxelized volumetric mask. Tissue property and pulse sequence parameter serve as inputs to a Bloch equation simulation to calculate specific signal evolution. Water and fat phantom images were generated by combining tissue mask and signal evolution. Coil sensitivity, sampling pattern, and noise can be applied to the phantom images to simulate realistic k-space data.
Figure 2.
Figure 2.
(a) Respiratory motion for the phantom is controlled by SI, AP and LR time curves from in-vivo data. The breath cycle duration was defined to last 4 seconds. These curves can be adjusted by the user to simulate different breathing patterns. (b) Each control point on mesh models can be non-rigidly scaled and shifted by the three vectors from time t1 to time t2. Three control points form a facet that defines the surface geometry of a mesh model.
Figure 3.
Figure 3.
(a) Representative 3D mesh models of vessels and organs. (b) After voxelization, different indexes were assigned to represent different tissue type. Fourteen tissue types including bone, fat, skin, colon, stomach, pancreas, liver, muscle, gall bladder, adrenal gland, vein, kidney, spleen, and artery were shown. Ureter and HCC lesion were not shown.
Figure 4.
Figure 4.
Representative images for demonstrating anatomy in axial (a), coronal (b) and sagittal (c) plane, and non-rigid respiratory motion in axial (d), coronal (e) and sagittal (f) plane. Peak amplitude of 13 mm was used for SI curve, 6.5 mm for AP curve, and 2 mm for LR curve.
Figure 5.
Figure 5.
Representative ground truth maps and images. (a) T1 map (left) and T1-weighted images (TI = 175/525/875/1,225/1,575/3,325 ms) using inversion-recovery Look-Locker sequence, (b) T2 map (left) and T2-weighted images (TE = 25/40/60/80/100/120 ms) using single spin echo sequence, (c) proton density fat fraction map (PDFF, left) and echo images (TE = 1.15/2.3/3.45/4.6/5.75/6.9 ms) using multi-echo spoiled gradient echo sequence, and (d) ADC map (left) and diffusion-weighted images (b-value = 0/200/400/600/800/1,000 s/mm2) using single spin echo sequence with fat suppression. No phase accumulation was simulated in the representative images.
Figure 6.
Figure 6.
Example of simulation for 3D volumetric T1 mapping. Representative T1-weighted images were shown at TI = 174, 480, 785, and 2621 ms. (a) The 1D navigator profile shows no respiratory motion was simulated during data collection (top). Fully-sampled T1-weighted images was generated from a 5.4 mins breath-hold (middle). T1 map was calculated from a three-parameter curve fitting (bottom). (b) The 1D navigator profile shows no respiratory motion was simulated during data collection (top). GRAPPA reconstructed T1-weighted images was generated from a single 23sec breath-hold (middle). Undesirable volumetric coverage for T1 map was shown due to imitation of the breath-hold length (bottom). (c) The 1D navigator profile demonstrated the regular free-breathing pattern (top). T1-weighted images were simulated during free-breathing (middle). Obvious motion artifacts were shown in free breathing T1 map, especially near the diaphragm (bottom). (d) The 1D navigator profile demonstrated the selected data in the same respiratory state of a fixed width of 1.5 mm (top). Fewer motion artifacts can be seen in the navigator-corrected T1-weighted images (middle) and T1 map (bottom) due to the use of the navigators.
Figure 7.
Figure 7.
Example of simulation for quantitative perfusion mapping. (a) T1 relaxation time curves of aorta (red), portal vein (blue), liver tissue (green), and HCC lesion (yellow). (b) Signal-time curves of aorta (red, dotted) , portal vein (blue, dotted), liver tissue (green, dotted), and HCC lesion (yellow, dotted) from fully-sampled images, signal-time curves of aorta (red, solid) , portal vein (blue, solid), liver tissue (green, solid), and HCC lesion (yellow, solid) from GRAPPA reconstructed images and signal-time curves of aorta (red, dashed) , portal vein (blue, dashed), liver tissue (green, dashed), and HCC lesion (yellow, dashed) from cgSENSE reconstructed images. (c) Representative perfusion-weighted images with CG SENSE reconstruction at arterial phase (~20 sec after contrast injection), portal phase (~70 sec), and delayed phase (~180 sec) were shown. (d) Corresponding perfusion maps of arterial fraction, distribution volume, mean transit time were shown for liver parenchyma tissue and HCC lesion with CG SENSE reconstruction. (e) Representative perfusion-weighted images with GRAPPA reconstruction at arterial phase, portal phase, and delayed phase were shown. (f) Corresponding perfusion maps of arterial fraction, distribution volume, mean transit time were shown for liver parenchyma tissue and HCC lesion with GRAPPA reconstruction.

References

    1. Akisik FM, Sandrasegaran K, Aisen AM, Lin C, Lall C. Abdominal MR imaging at 3.0 T. Radiographics [Internet] 2007;27:1433–44–4. doi: 10.1148/rg.275075023. - DOI - PubMed
    1. Hilbert T, Sumpf TJ, Weiland E, Frahm J, Thiran J, Meuli R, Kober T, Krueger G. Accelerated T2 mapping combining parallel MRI and model‐based reconstruction: GRAPPATINI. J. Magn. Reson. Imaging [Internet] 0. doi: 10.1002/jmri.25972. - DOI - PubMed
    1. Sharma SD, Hu HH, Nayak KS. Accelerated T2*-compensated fat fraction quantification using a joint parallel imaging and compressed sensing framework. J. Magn. Reson. Imaging 2013;38:1267–1275. doi: 10.1002/jmri.24034. - DOI - PMC - PubMed
    1. Chen Y, Lee GR, Wright KL, Badve C, Nakamoto D, Yu A, Schluchter MD, Griswold MA, Seiberlich N, Gulani V. Free-breathing liver perfusion imaging using 3-dimensional through-time spiral generalized autocalibrating partially parallel acquisition acceleration. Invest. Radiol 2015;50:367–375. doi: 10.1097/RLI.0000000000000135. - DOI - PMC - PubMed
    1. Cocosco C a, Kollokian V, Kwan RK, Pike GB, Evans AC. BrainWeb : Online Interface to a 3D MRI Simulated Brain Database. 3-rd Int. Conf. Funct. Mapp. Hum. Brain 1997;5:S425. doi: 10.1.1.51.3917.

Publication types