. 2019 Mar;8(3):271-284.
doi: 10.1002/sctm.18-0105. Epub 2018 Nov 5.

Mesenchymal Stem Cells and Induced Bone Marrow-Derived Macrophages Synergistically Improve Liver Fibrosis in Mice

Affiliations

Mesenchymal Stem Cells and Induced Bone Marrow-Derived Macrophages Synergistically Improve Liver Fibrosis in Mice

Yusuke Watanabe et al. Stem Cells Transl Med. 2019 Mar.

Abstract

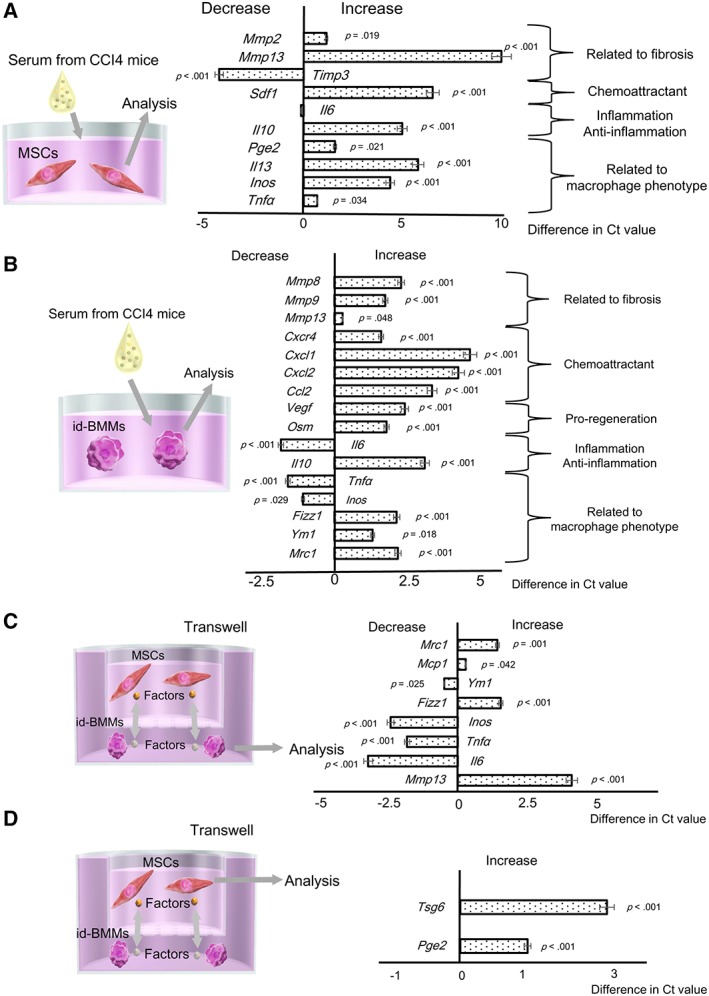
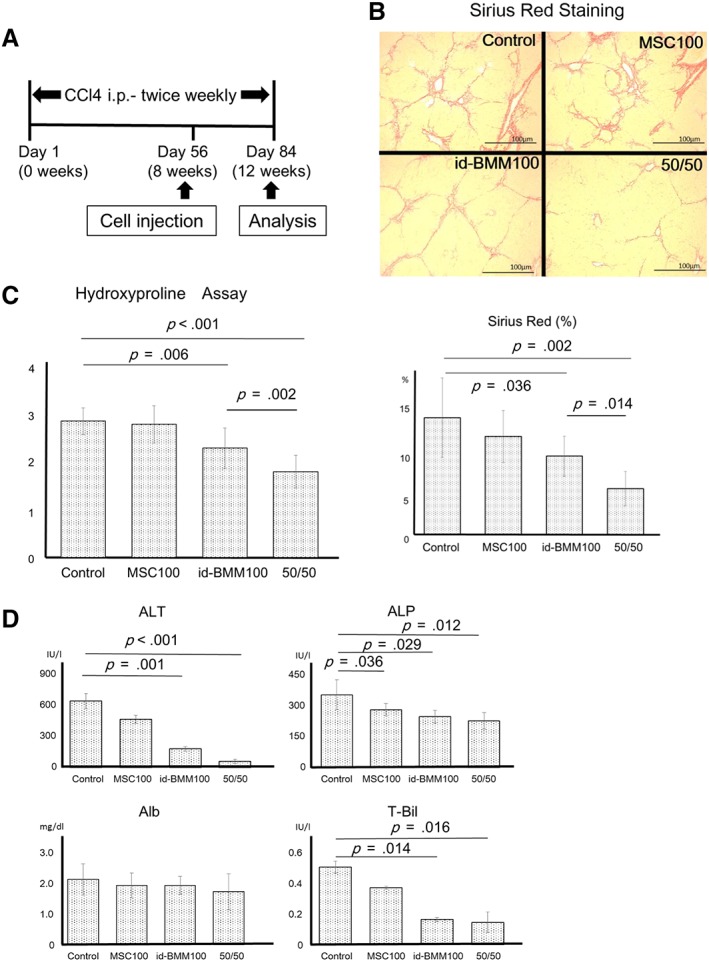
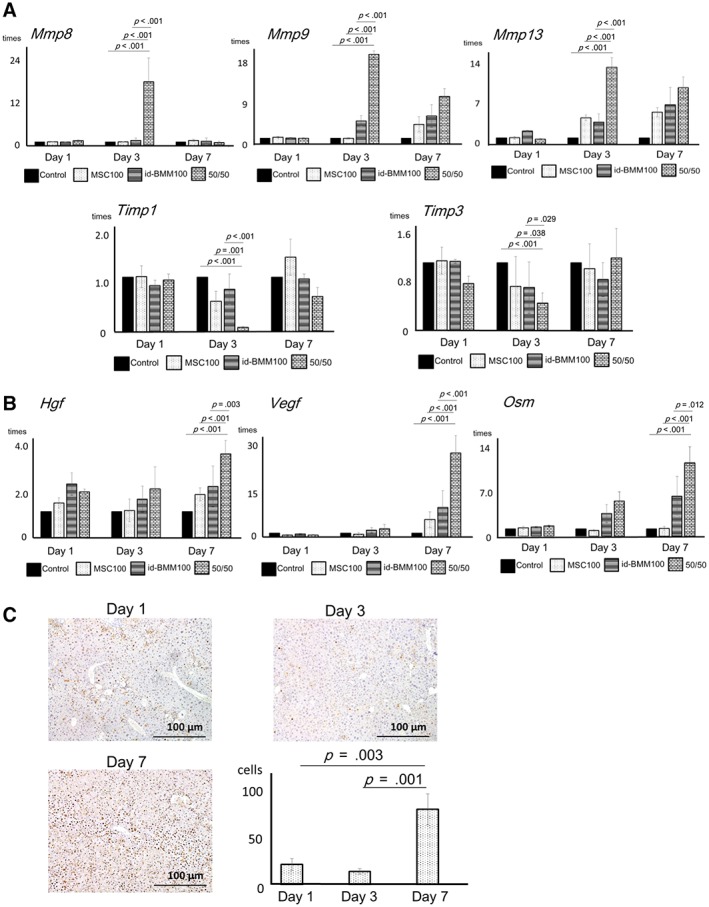
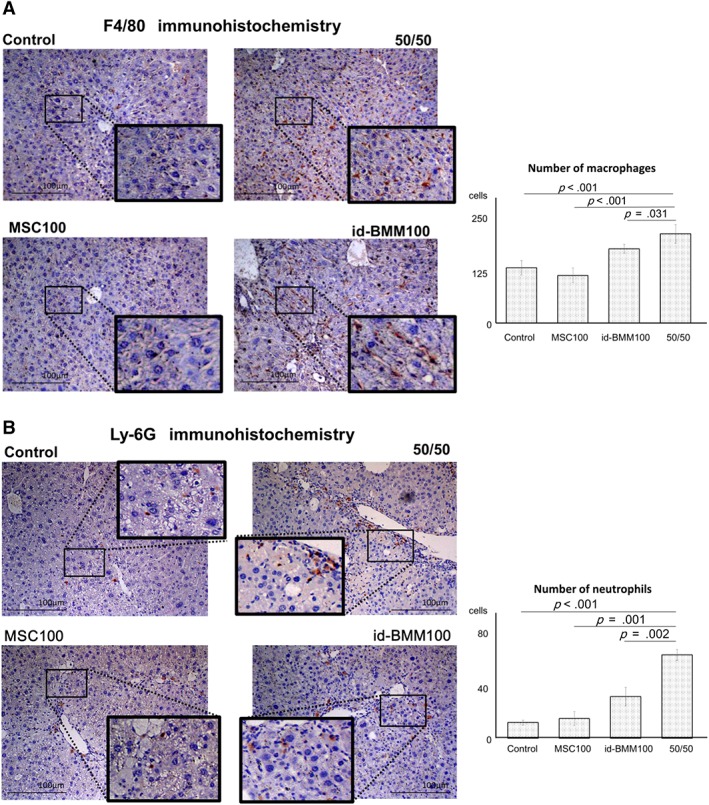
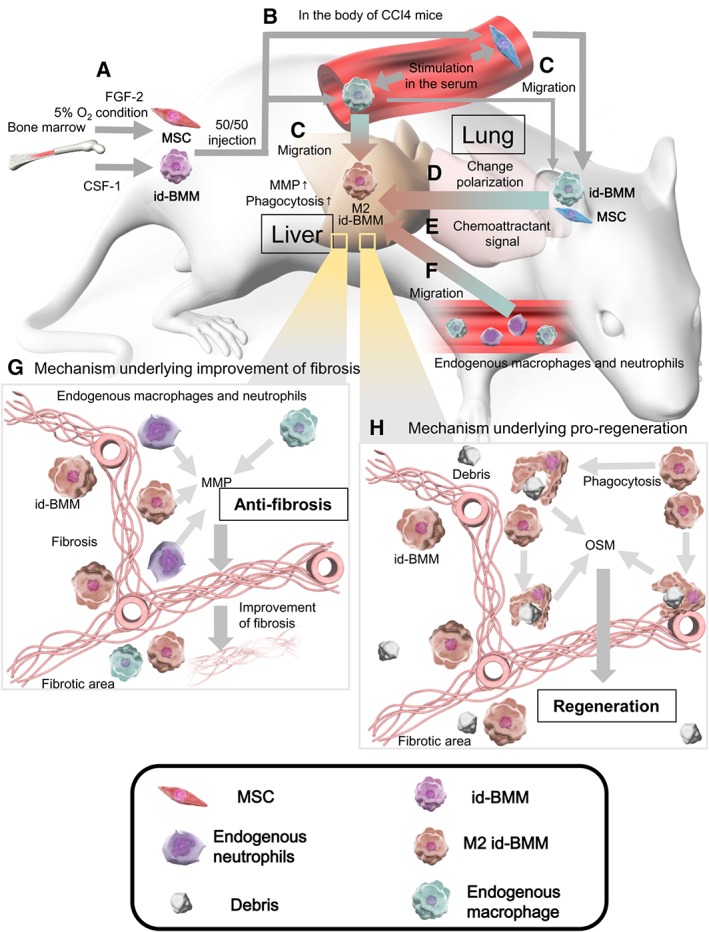
We describe a novel therapeutic approach for cirrhosis using mesenchymal stem cells (MSCs) and colony-stimulating factor-1-induced bone marrow-derived macrophages (id-BMMs) and analyze the mechanisms underlying fibrosis improvement and regeneration. Mouse MSCs and id-BMMs were cultured from mouse bone marrow and their interactions analyzed in vitro. MSCs, id-BMMs, and a combination therapy using MSCs and id-BMMs were administered to mice with CCl4 -induced cirrhosis. Fibrosis regression, liver regeneration, and liver-migrating host cells were evaluated. Administered cell behavior was also tracked by intravital imaging. In coculture, MSCs induced switching of id-BMMs toward the M2 phenotype with high phagocytic activity. In vivo, the combination therapy reduced liver fibrosis (associated with increased matrix metalloproteinases expression), increased hepatocyte proliferation (associated with increased hepatocyte growth factor, vascular endothelial growth factor, and oncostatin M in the liver), and reduced blood levels of liver enzymes, more effectively than MSCs or id-BMMs monotherapy. Intravital imaging showed that after combination cell administration, a large number of id-BMMs, which phagocytosed hepatocyte debris and were retained in the liver for more than 7 days, along with a few MSCs, the majority of which were trapped in the lung, migrated to the fibrotic area in the liver. Host macrophages and neutrophils infiltrated after combination therapy and contributed to liver fibrosis regression and promoted regeneration along with administered cells. Indirect effector MSCs and direct effector id-BMMs synergistically improved cirrhosis along with host cells in mice. These studies pave the way for new treatments for cirrhosis. Stem Cells Translational Medicine 2019;8:271&284.

Keywords: Cirrhosis; Combination cell therapy; Induced bone marrow-derived macrophages; Intravital imaging; Mesenchymal stem cells.


Conflict of interest statement

The authors indicated no potential conflicts of interest.

Figures

Figure 1
Figure 1
Analysis of mRNA expression changes in mesenchymal stem cells (MSCs) and induced bone marrow‐derived macrophages (id‐BMMs) after addition of serum from mice with CCl4‐induced liver damage to mimic the in vivo microenvironment after cell administration, and after coculture of MSCs and id‐BMMs. Data are presented as the means ± SD, n = 12 in each experiment. (A): mRNA expression changes in MSCs after addition of serum from liver‐damaged mice. Mmp2 (p = .019), Mmp13 (p < .001), Sdf1 (p < .001), Il10 (p < .001), Pge2 (p = .021), Il13 (p < .001), Inos (p < .001), Tnfa (p = .034); upregulated. Timp3 (p < .001); downregulated. (B): mRNA expression changes in id‐BMMs after addition of serum from liver‐damaged mice. Mmp8 (p < .001), Mmp9 (p < .001), Mmp13 (p = .048), Cxcr4 (p < .001), Cxcl1 (p < .001), Cxcl2 (p < .001), Ccl2 (p < .001), Vegf (p < .001), Osm (p < .001), Il10 (p < .001), Fizz1 (p < .001), Ym1 (p = .018), Mrc1 (mannose receptor; p < .001); upregulated. Il6 (p < .001), Tnfa (p < .001), Inos (p = .029); downregulated. (C): mRNA expression changes in id‐BMMs after coculture. Mrc1 (p = .001), Mcp1 (p = .042), Fizz1 (p < .001), Mmp13 (p < .001); upregulated. Ym1 (p = .025), Inos (p < .001), Tnfa (p < .001), Il6 (p < .001); downregulated. (D): mRNA expression change in MSCs after coculture. Tsg6 (p < .001), Pge2 (p < .001); upregulated.
Figure 2
Figure 2
Therapeutic effect of mesenchymal stem cells (MSCs) and induced bone marrow‐derived macrophages (id‐BMMs) on CCl4‐induced cirrhosis in mice. (A): The schematic diagram represents the experimental design regarding the induction of fibrosis, cell administration, and analysis in this study. (B, C): Sirius red staining and hydroxyproline assay showing the degree of fibrosis in mice from the control, MSC100, id‐BMM100, and 50/50 groups. Data are presented as the means ± SD, n = 12 mice in each group, p = .315 (hydroxyproline, MSC100), p = .201 (Sirius red, MSC100), p = .006 (hydroxyproline, id‐BMM100), p = .036 (Sirius red, id‐BMM100), p < .001 (hydroxyproline, 50/50), p = .002 (Sirius red, 50/50), compared with control group. (D): Serum levels of ALT, ALP, albumin, and total bilirubin 4 weeks after cell injection. Data are presented as the means ± SD, n = 12 mice in each group, p = .001 (ALT, id‐BMM100), p < .001 (ALT, 50/50), p = .036 (ALP, MSC100), p = .029 (ALP, id‐BMM100), p = .012 (ALP, 50/50), p = .014 (T‐Bil, id‐BMM100), p = .016 (T‐Bil, 50/50), compared with the control group. Scale bar: 100 μm.
Figure 3
Figure 3
Analysis of mRNA expression changes for factors related to fibrosis and proregenerative factors at 1, 3, and 7 days after cell administration in the liver, and analysis of the proliferating hepatocytes. (A): mRNA expression changes of factors related to fibrosis (matrix metalloproteinases [MMP] and tissue inhibitor of metalloprotease [TIMP]). Data are presented as the means ± SD, n = 12 in each experiment. Representatively, in the 50/50 group, mRNA levels of MMP‐8 (p < .001; day 3, compared with control, p < .001; day 3, compared with MSC100, p < .001; day 3, compared with id‐BMM100), MMP‐9 (p < .001; day 3, compared with control, p < .001; day 3, compared with MSC100, p < .001; day 3, compared with id‐BMM100), and MMP‐13 (p < .001; day 3, compared with control, p < .001; day 3, compared with MSC100, p < .001; day 3, compared with id‐BMM100) are upregulated, whereas in 50/50 group, mRNA levels of TIMP‐1 (p < .001; day 3, compared with control, p = .001; day 3, compared with MSC100, p < .001; day 3, compared with id‐BMM100), and TIMP‐3 (p < .001; day 3, compared with control, p = .038; day 3, compared with MSC100, p = .029; day 3, compared with id‐BMM100) are downregulated. (B): mRNA expression changes of proregenerative factors (hepatocyte growth factor [HGF], vascular endothelial growth factor [VEGF], and oncostatin M [OSM]). Data are presented as the means ± SD, n = 12 in each experiment. Representatively, in the 50/50 group, mRNA levels of HGF (p < .001; day 7, compared with control, p < .001; day 7, compared with MSC100, p = .003; day 7, compared with id‐BMM100), VEGF (p < .001; day 7, compared with control, p < .001; day 7, compared with MSC100, p < .001; day 7, compared with id‐BMM100), and OSM (p < .001; day 7, compared with control, p < .001; day 7, compared with MSC100, p = .012; day 7, compared with id‐BMM100), are upregulated. (C): Analysis of the proliferating hepatocytes by PCNA staining at day 7 after cell administration. Data are presented as the means ± SD, n = 12 in each experiment, p = .003 (day 7) compared with day 1, p = .001 (day 7) compared with day 3. Scale bar: 100 μm.
Figure 4
Figure 4
Localization of administered mesenchymal stem cells (MSCs) and induced bone marrow‐derived macrophages (id‐BMMs) at 1, 3, and 7 days after cell injection in intravital imaging analysis, and analysis of changes in id‐BMM characteristics. (A): Intravital imaging was performed with two‐photon excitation microscopy of the liver, 3 days after cell administration in the MSC100 (left panels), id‐BMM100 (middle panels), and 50/50 (right panels) groups. Green cells represent administered id‐BMMs, and red cells are administered MSCs. Nuclei were stained with DAPI (blue), and the dense blue area composed of blue fibers represents fibrosis, white dotted lines represent the area of fibrotic liver damage, and white spots represent hepatocyte debris (scale bar: 100 μm). (B, C): Behavior of administered id‐BMMs and MSCs in the liver, lung, and spleen at 1, 3, and 7 days after combination cell administration, n = 12 mice in each group. (D): Representative intravital time‐lapse images of phagocytosis by id‐BMMs. Green cells represent administered id‐BMMs, nuclei are stained with DAPI (blue), the dense blue area composed of blue fibers represents fibrosis, and white spots represent hepatocyte debris (scale bar: left panel, 50 μm; magnified image of left panel, 10 μm), n = 4 mice in each group. (Di): Start point of intravital imaging. (Dii): Three minutes after starting the video, id‐BMMs approached debris. (Diii, Div): After 9–16 minutes, id‐BMMs surrounded, phagocytosed, and digested the debris (phagocytosis activity). (Dv, Dvi): After 21–30 minutes, id‐BMMs reapproached and phagocytosed residual debris. (E): Analysis of changes in id‐BMM characteristics after phagocytosis of hepatocyte debris. mRNA expression changes in id‐BMMs after phagocytosis of hepatocyte debris. Data are presented as the means ± SD, n = 12 in each experiment (Vegf; 3.18‐fold, p < .001, and Osm; 4.25‐fold, p < .001, compared with mRNA levels before phagocytosis).
Figure 5
Figure 5
Involvement of host macrophages and neutrophils during improvement of liver fibrosis and regeneration. (A, B): Immunostaining for F4/80 and Ly‐6G in the liver, n = 12 for each group. Data are presented as the means ± SD, p < .001 (F4/80, 50/50 compared with control), p < .001 (F4/80, 50/50 compared with MSC100), p = .031 (F4/80, 50/50 compared with id‐BMM100), p < .001 (Ly‐6G, 50/50 compared with control), p = .001 (Ly‐6G, 50/50 compared with MSC100), p = .002 (Ly‐6G, 50/50 compared with id‐BMM100). Scale bar: 100 μm.
Figure 6
Figure 6
Host macrophages and neutrophils in the liver. (A, B): Flow cytometric analysis of macrophages (F4/80) and neutrophils (Ly‐6G) in 1 × 10⁶ hematopoietic cells in the liver. The macrophage population contained administered induced bone marrow‐derived macrophages (id‐BMMs; GFP positive cells). Data are presented as the means ± SD, n = 12 mice in each group, p < .001 (macrophages, 50/50 compared with control), p < .001 (macrophages, 50/50 compared with MSC100), p = .004 (macrophages, 50/50 compared with id‐BMM100), p < .001 (neutrophils, 50/50 compared with control), p < .001 (neutrophils, 50/50 compared with MSC100), p = .001 (neutrophils, 50/50 compared with id‐BMM100).
Figure 7
Figure 7
Schematic representation of the mechanisms underlying the improvement of liver fibrosis and regeneration. (A): Highly enriched mesenchymal stem cells (MSCs) and induced bone marrow‐derived macrophages (id‐BMMs) were cultured from mouse bone marrow in the presence of FGF‐2 and 5% O2 condition, or CSF‐1. (B): After MSCs and id‐BMMs were administered to the mice, the administered cells were activated by cytokines and chemokines in the serum from liver‐damaged mice. (C): Most MSCs migrated to the lung, whereas many id‐BMMs migrated to the liver, and id‐BMMs engrafted near the fibrotic area in the liver. (D): Signals from MSCs that migrated to the lung changed id‐BMMs toward the M2 phenotype, promoting an anti‐inflammatory environment in the liver. (E): Activated id‐BMMs secreted chemoattractant signals in the liver. (F): Endogenous macrophages and neutrophils were recruited from the peripheral blood to the liver by chemoattractant signals. (G): Matrix metalloproteinases secreted from administered id‐BMMs and endogenous cells that migrated to the liver induced regression of fibrosis (antifibrosis). (H): M2 id‐BMMs that gained high phagocytic activity phagocytosed hepatocyte debris more effectively and expressed proregenerative factors (proregeneration).

References

    1. Curry MP, O'Leary JG, Bzowej N et al. Sofosbuvir and velpatasvir for HCV in patients with decompensated cirrhosis. N Engl J Med 2015;373:2618–2628. - PubMed
    1. Terai S, Tsuchiya A. Status of and candidates for cell therapy in liver cirrhosis: Overcoming the “point of no return” in advanced liver cirrhosis. J Gastroenterol 2017;52:129–140. - PubMed
    1. Tsuchiya A, Kojima Y, Ikarashi S et al. Clinical trials using mesenchymal stem cells in liver diseases and inflammatory bowel diseases. Inflamm Regener 2017;37:16. - PMC - PubMed
    1. Terai S, Ishikawa T, Omori K et al. Improved liver function in patients with liver cirrhosis after autologous bone marrow cell infusion therapy. Stem Cells 2006;24:2292–2298. - PubMed
    1. Sica A, Mantovani A. Macrophage plasticity and polarization: in vivo veritas. J Clin Invest 2012;122:787–795. - PMC - PubMed

Publication types