

The effect of different image reconstruction techniques on pre-clinical quantitative imaging and dual-energy CT
- PMID: 30394804
- PMCID: PMC6541183
- DOI: 10.1259/bjr.20180447
The effect of different image reconstruction techniques on pre-clinical quantitative imaging and dual-energy CT
Abstract
Objective:: To analyse the effect of different image reconstruction techniques on image quality and dual energy CT (DECT) imaging metrics.
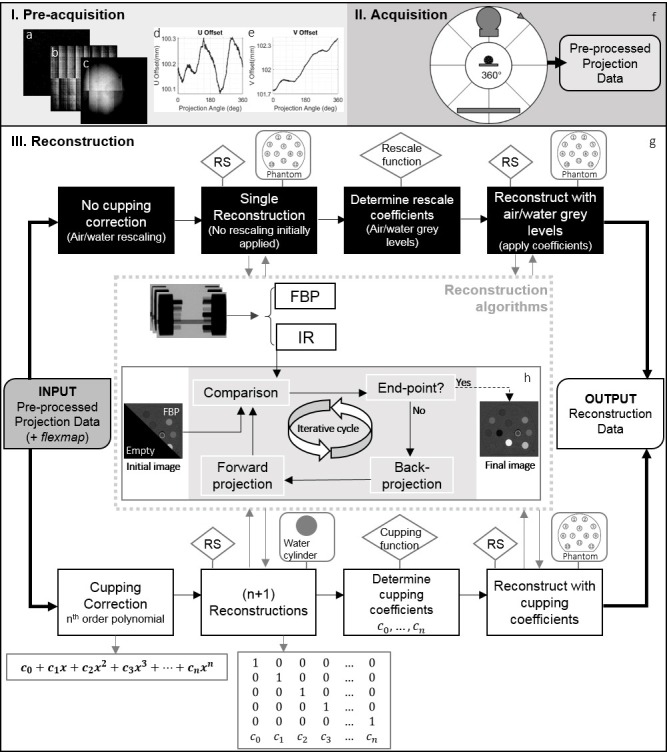
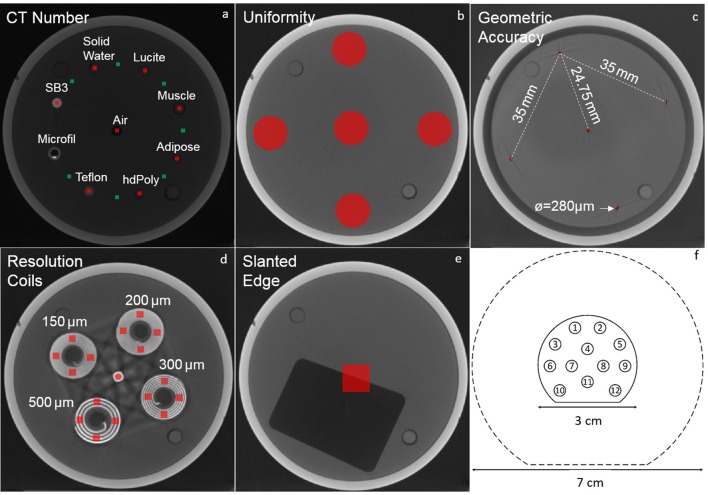
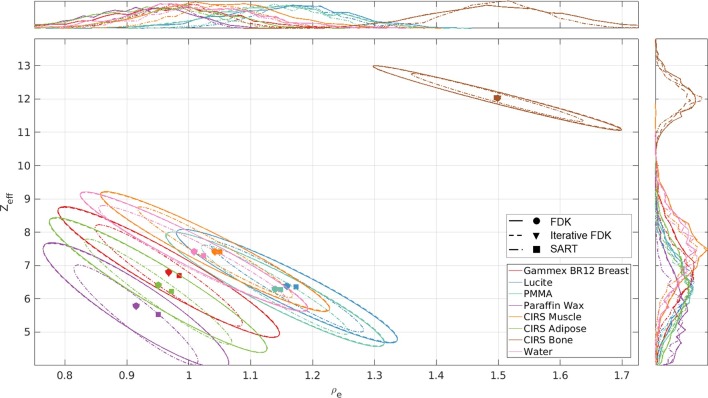
Methods:: A software platform for pre-clinical cone beam CT X-ray image reconstruction was built using the open-source reconstruction toolkit. Pre-processed projections were reconstructed with filtered back-projection and iterative algorithms, namely Feldkamp, Davis, and Kress (FDK), Iterative FDK, simultaneous algebraic reconstruction technique (SART), simultaneous iterative reconstruction technique and conjugate gradient. Imaging metrics were quantitatively assessed, using a quality assurance phantom, and DECT analysis was performed to determine the influence of each reconstruction technique on the relative electron density (ρe) and effective atomic number (Zeff) values.
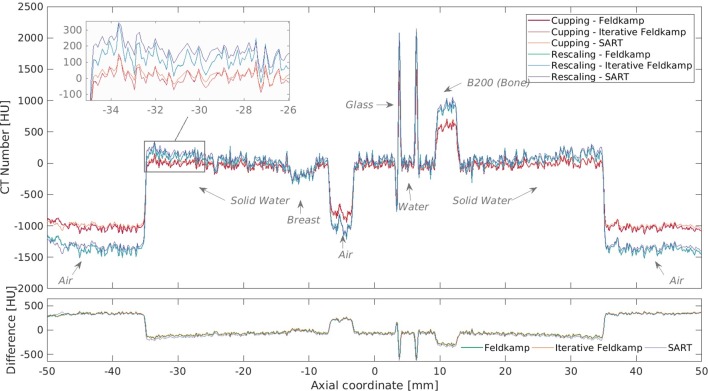
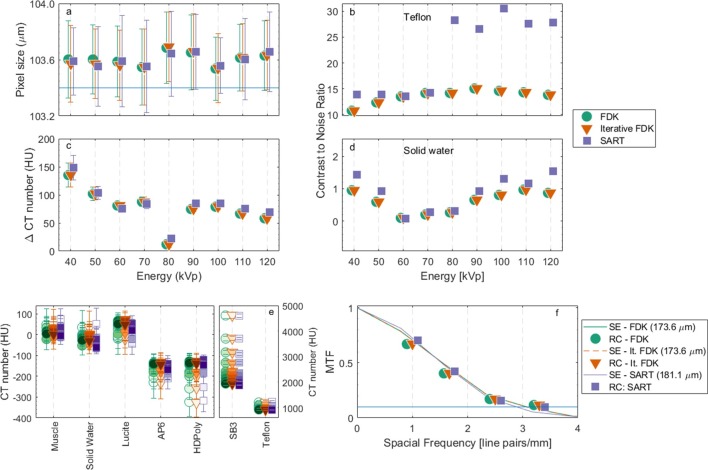
Results:: Iterative reconstruction had favourable results for the DECT analysis: a significantly smaller spread for each material in the ρe-Zeff space and lower Zeff and ρe residuals (on average 24 and 25% lower, respectively). In terms of image quality assurance, the techniques FDK, Iterative FDK and SART provided acceptable results. The three reconstruction methods showed similar geometric accuracy, uniformity and CT number results. The technique SART had a contrast-to-noise ratio up to 76% higher for solid water and twice as high for Teflon, but resolution was up to 28% lower when compared to the other two techniques.
Conclusions:: Advanced image reconstruction can be beneficial, but the benefit is small, and calculation times may be unacceptable with current technology. The use of targeted and downscaled reconstruction grids, larger, yet practicable, pixel sizes and GPU are recommended.
Advances in knowledge:: An iterative CBCT reconstruction platform was build using RTK.
Conflict of interest statement
Figures


Similar articles
-
Improved dose calculation accuracy for low energy brachytherapy by optimizing dual energy CT imaging protocols for noise reduction using sinogram affirmed iterative reconstruction.Z Med Phys. 2016 Mar;26(1):75-87. doi: 10.1016/j.zemedi.2015.09.001. Epub 2015 Oct 1. Z Med Phys. 2016. PMID: 26422576
-
Characterization of a prototype rapid kilovoltage x-ray image guidance system designed for a ring shape radiation therapy unit.Med Phys. 2019 Mar;46(3):1355-1370. doi: 10.1002/mp.13396. Epub 2019 Feb 13. Med Phys. 2019. PMID: 30675902 Free PMC article.
-
Evaluation and Clinical Application of a Commercially Available Iterative Reconstruction Algorithm for CBCT-Based IGRT.Technol Cancer Res Treat. 2019 Jan 1;18:1533033818823054. doi: 10.1177/1533033818823054. Technol Cancer Res Treat. 2019. PMID: 30803367 Free PMC article.
-
Optimizing dual energy cone beam CT protocols for preclinical imaging and radiation research.Br J Radiol. 2017 Jan;90(1069):20160480. doi: 10.1259/bjr.20160480. Epub 2016 Nov 2. Br J Radiol. 2017. PMID: 27683003 Free PMC article. Review.
-
Review of CT image reconstruction open source toolkits.J Xray Sci Technol. 2020;28(4):619-639. doi: 10.3233/XST-200666. J Xray Sci Technol. 2020. PMID: 32390648 Review.
Cited by
-
Deep Learning Based Automated Orthotopic Lung Tumor Segmentation in Whole-Body Mouse CT-Scans.Cancers (Basel). 2021 Sep 13;13(18):4585. doi: 10.3390/cancers13184585. Cancers (Basel). 2021. PMID: 34572813 Free PMC article.
-
Characterization of a prototype rapid kilovoltage x-ray image guidance system designed for a linear accelerator radiation therapy unit.J Appl Clin Med Phys. 2025 May;26(5):e70060. doi: 10.1002/acm2.70060. Epub 2025 Feb 26. J Appl Clin Med Phys. 2025. PMID: 40008526 Free PMC article.
-
Evaluation of a Novel Liquid Fiducial Marker, BioXmark®, for Small Animal Image-Guided Radiotherapy Applications.Cancers (Basel). 2020 May 18;12(5):1276. doi: 10.3390/cancers12051276. Cancers (Basel). 2020. PMID: 32443537 Free PMC article.
-
Status and innovations in pre-treatment CT imaging for proton therapy.Br J Radiol. 2020 Mar;93(1107):20190590. doi: 10.1259/bjr.20190590. Epub 2019 Nov 11. Br J Radiol. 2020. PMID: 31642709 Free PMC article. Review.
-
Filtered back projection vs. iterative reconstruction for CBCT: effects on image noise and processing time.Dentomaxillofac Radiol. 2023 Nov;52(8):20230109. doi: 10.1259/dmfr.20230109. Epub 2023 Oct 23. Dentomaxillofac Radiol. 2023. PMID: 37665027 Free PMC article.
References
-
- Feldkamp LA, Davis LC, Kress JW. Practical cone-beam algorithm. Journal of the Optical Society of America A 1984; 1: 612. doi: 10.1364/JOSAA.1.000612 - DOI
-
- Bouckaert C, Vandeghinste B, Vanhove C, Vandenberghe S. Dual energy microCT for small animal bone-iodine decomposition In: 2012 IEEE Nuclear Science Symposium and Medical Imaging Conference Record (NSS/MIC), Anaheim, CA; 2012. pp 3769–74.
