

Development and Characterization of an 18F-labeled Ghrelin Peptidomimetic for Imaging the Cardiac Growth Hormone Secretagogue Receptor
- PMID: 30394854
- PMCID: PMC6236854
- DOI: 10.1177/1536012118809587
Development and Characterization of an 18F-labeled Ghrelin Peptidomimetic for Imaging the Cardiac Growth Hormone Secretagogue Receptor
Abstract
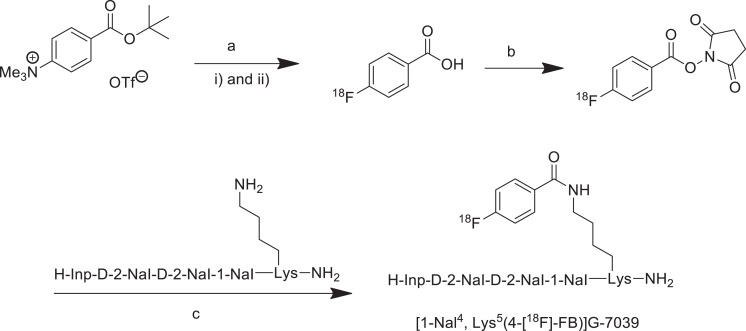
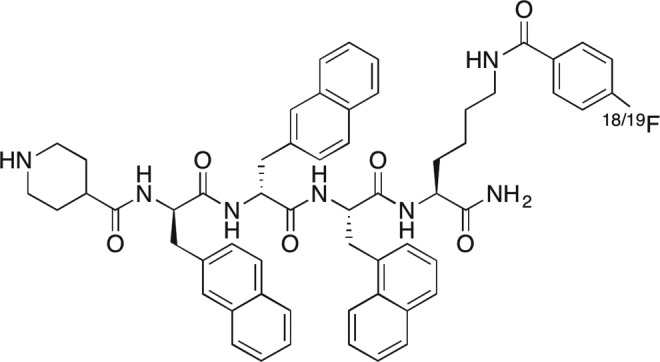
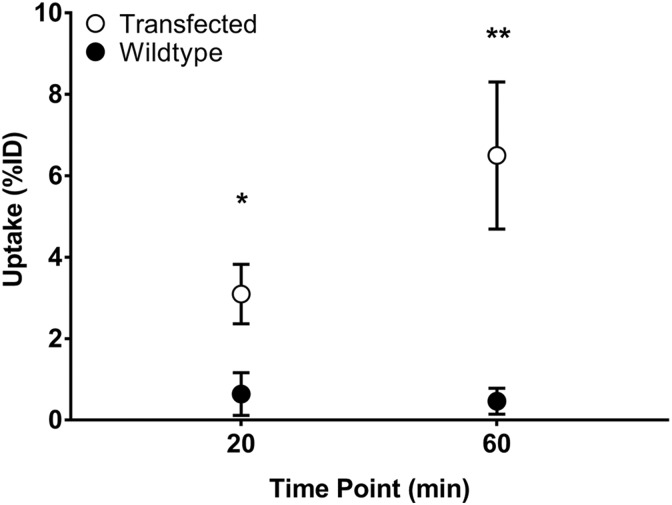
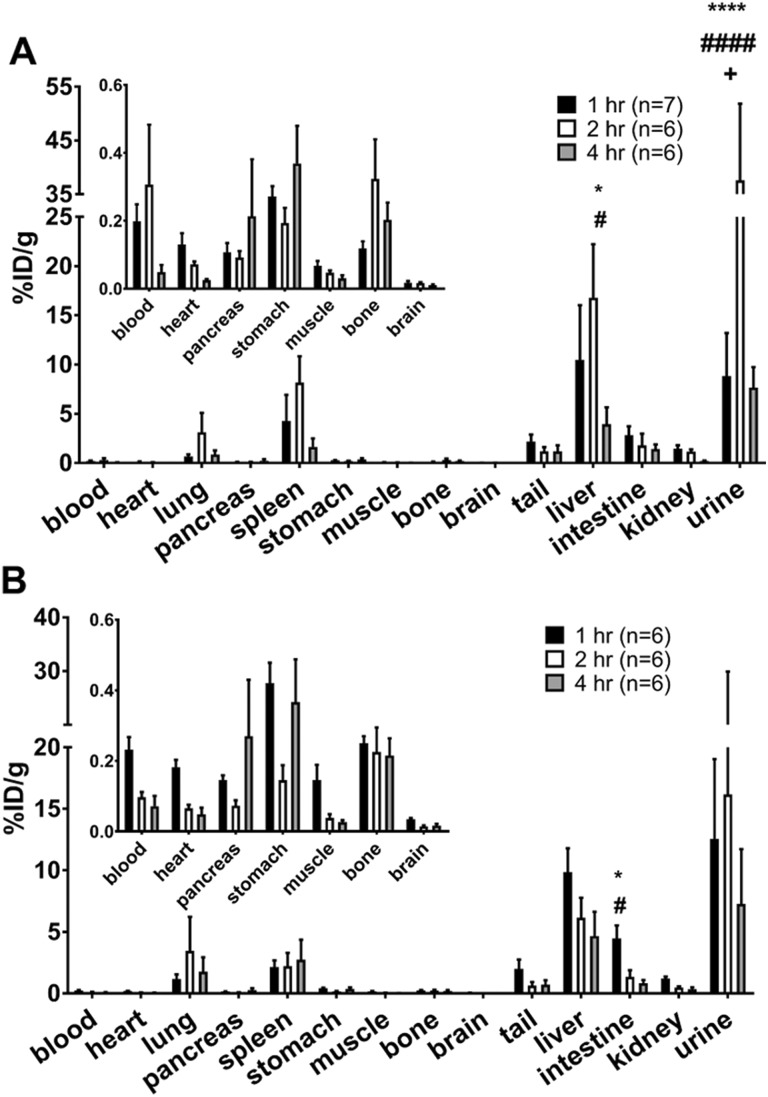
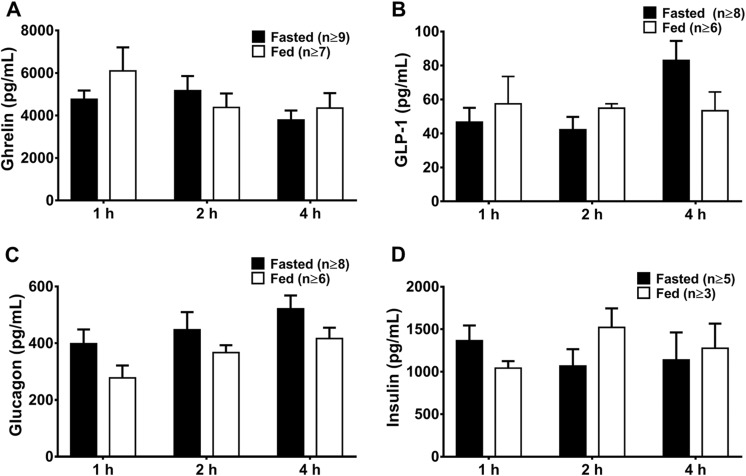
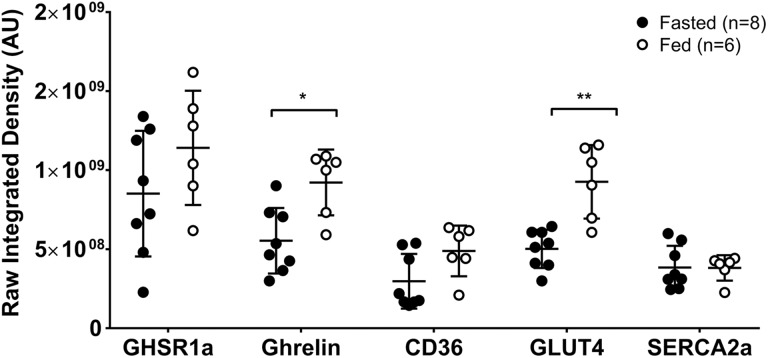
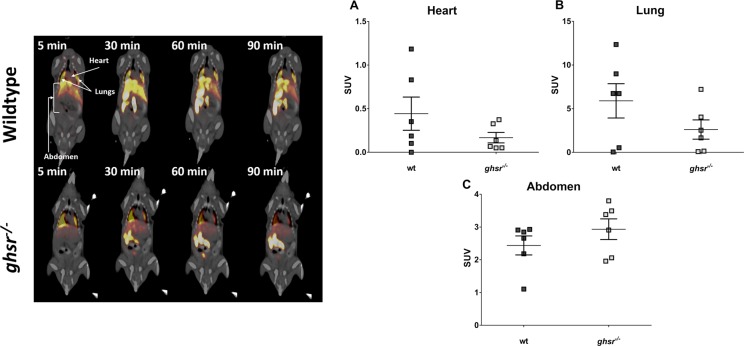
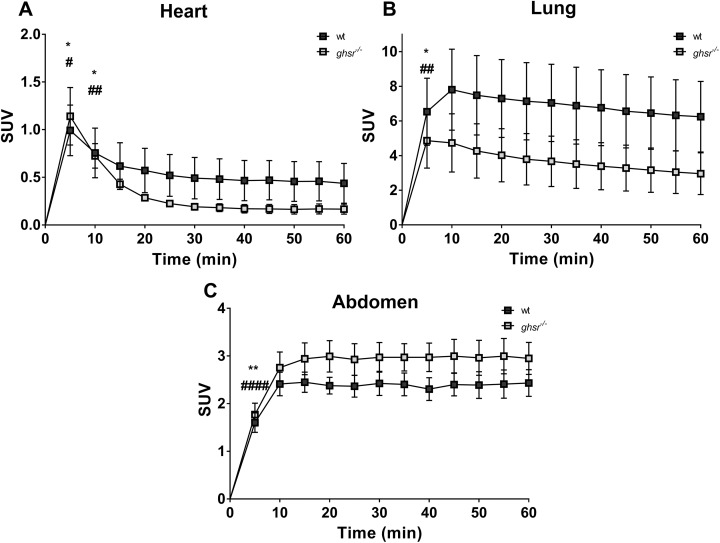
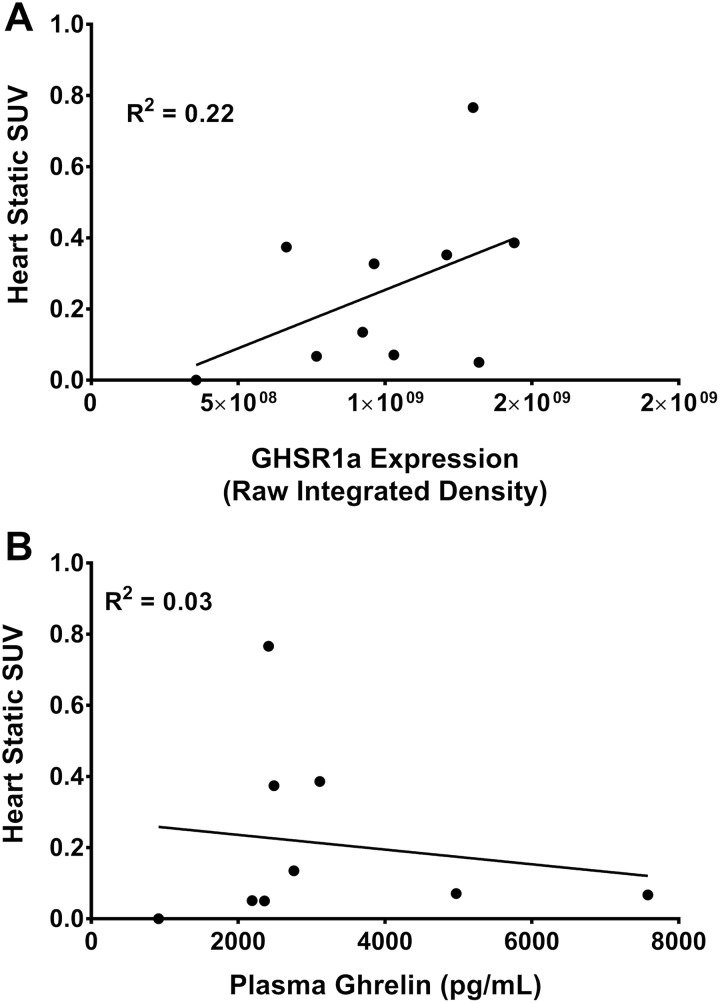
One-third of patients with heart disease develop heart failure, which is diagnosed through imaging and detection of circulating biomarkers. Imaging strategies reveal morphologic and functional changes but fall short of detecting molecular abnormalities that can lead to heart failure, and circulating biomarkers are not cardiac specific. Thus, there is critical need for biomarkers that are endogenous to myocardial tissues. The cardiac growth hormone secretagogue receptor 1a (GHSR1a), which binds the hormone ghrelin, is a potential biomarker for heart failure. We have synthesized and characterized a novel ghrelin peptidomimetic tracer, an 18F-labeled analogue of G-7039, for positron emission tomography (PET) imaging of cardiac GHSR1a. In vitro analysis showed enhanced serum stability compared to natural ghrelin and significantly increased cellular uptake in GHSR1a-expressing OVCAR cells. Biodistribution studies in mice showed that tissue uptake of the tracer was independent of circulating ghrelin levels, and there was negligible cardiac uptake and high uptake in the liver, intestines, and kidneys. Specificity of tracer uptake was assessed using ghsr -/- mice; both static and dynamic PET imaging revealed no difference in cardiac uptake, and there was no significant correlation between cardiac standardized uptake values and GHSR1a expression. Our study lays the groundwork for further refinement of peptidomimetic PET tracers targeting cardiac GHSR1a.
Keywords: GHSR1a; PET; biomarkers; cardiac; ghrelin; heart disease; heart failure; imaging.
Conflict of interest statement
Figures
Similar articles
-
Design, Synthesis, and Preclinical Evaluation of a High-Affinity 18F-Labeled Radioligand for Myocardial Growth Hormone Secretagogue Receptor Before and After Myocardial Infarction.J Nucl Med. 2024 Oct 1;65(10):1633-1639. doi: 10.2967/jnumed.124.267578. J Nucl Med. 2024. PMID: 39266294
-
Peptidomimetic growth hormone secretagogue derivatives for positron emission tomography imaging of the ghrelin receptor.Eur J Med Chem. 2018 Sep 5;157:1500-1511. doi: 10.1016/j.ejmech.2018.08.062. Epub 2018 Aug 23. Eur J Med Chem. 2018. PMID: 30282322
-
Radiofluorination of non-activated aromatic prosthetic groups for synthesis and evaluation of fluorine-18 labelled ghrelin(1-8) analogues.Org Biomol Chem. 2021 Oct 20;19(40):8812-8820. doi: 10.1039/d1ob01023a. Org Biomol Chem. 2021. PMID: 34590643
-
Novel and conventional receptors for ghrelin, desacyl-ghrelin, and pharmacologically related compounds.Pharmacol Rev. 2014 Oct;66(4):984-1001. doi: 10.1124/pr.113.008433. Pharmacol Rev. 2014. PMID: 25107984 Review.
-
68Ga-Labeled NODAGA-conjugated ghrelin receptor agonists and inverse agonists.2012 Jun 10 [updated 2012 Jul 12]. In: Molecular Imaging and Contrast Agent Database (MICAD) [Internet]. Bethesda (MD): National Center for Biotechnology Information (US); 2004–2013. 2012 Jun 10 [updated 2012 Jul 12]. In: Molecular Imaging and Contrast Agent Database (MICAD) [Internet]. Bethesda (MD): National Center for Biotechnology Information (US); 2004–2013. PMID: 22787690 Free Books & Documents. Review.
Cited by
-
Dynamics of the Ghrelin/Growth Hormone Secretagogue Receptor System in the Human Heart Before and After Cardiac Transplantation.J Endocr Soc. 2019 Feb 14;3(4):748-762. doi: 10.1210/js.2018-00393. eCollection 2019 Apr 1. J Endocr Soc. 2019. PMID: 30937420 Free PMC article.
-
A Decade's Progress in the Development of Molecular Imaging Agents Targeting the Growth Hormone Secretagogue Receptor.Mol Imaging. 2020 Jan-Dec;19:1536012120952623. doi: 10.1177/1536012120952623. Mol Imaging. 2020. PMID: 33104445 Free PMC article. Review.
-
Development of a ghrelin receptor inverse agonist for positron emission tomography.Oncotarget. 2021 Mar 2;12(5):450-474. doi: 10.18632/oncotarget.27895. eCollection 2021 Mar 2. Oncotarget. 2021. PMID: 33747360 Free PMC article.
References
-
- Gaggin HK, Januzzi JL. Biomarkers and diagnostics in heart failure. Biochim Biophys Acta - Mol Basis Dis. 2013;1832(12):2442–2450. - PubMed
-
- Shirani J, Dilsizian V. Molecular imaging in heart failure. Curr Opin Biotechnol. 2007;18(1):65–72. - PubMed
-
- Iglesias MJ, Piñeiro R, Blanco M, et al. Growth hormone releasing peptide (ghrelin) is synthesized and secreted by cardiomyocytes. Cardiovasc Res. 2004;62(3):481–488. - PubMed
-
- Chen Y, Ji X, Zhang A, Lv JC, Zhang JG, Zhao CH. Prognostic value of plasma ghrelin in predicting the outcome of patients with chronic heart failure. Arch Med Res 2014;45(3):263–269. - PubMed
Publication types
MeSH terms
Substances
Grants and funding
LinkOut - more resources
Full Text Sources
