. 2019 Jun 1;35(12):2084-2092.
doi: 10.1093/bioinformatics/bty895.

Heavy-tailed prior distributions for sequence count data: removing the noise and preserving large differences

Affiliations

Heavy-tailed prior distributions for sequence count data: removing the noise and preserving large differences

Anqi Zhu et al. Bioinformatics. .

Abstract

Motivation: In RNA-seq differential expression analysis, investigators aim to detect those genes with changes in expression level across conditions, despite technical and biological variability in the observations. A common task is to accurately estimate the effect size, often in terms of a logarithmic fold change (LFC).

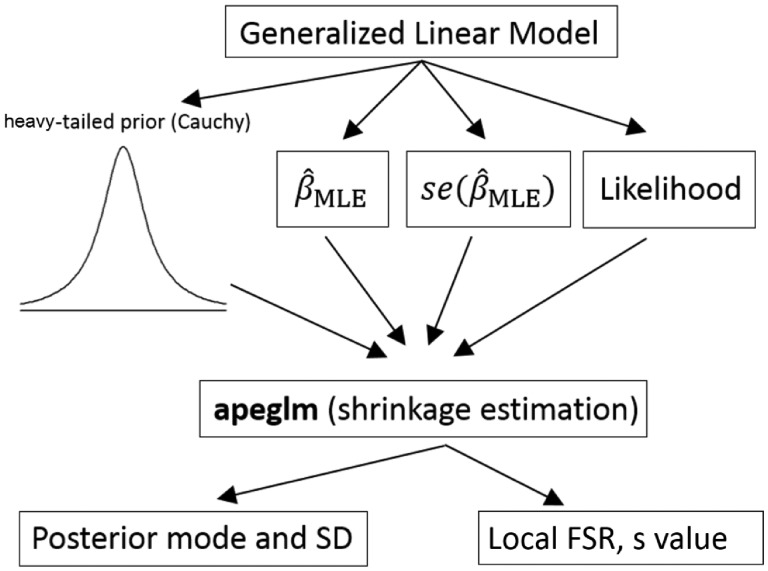
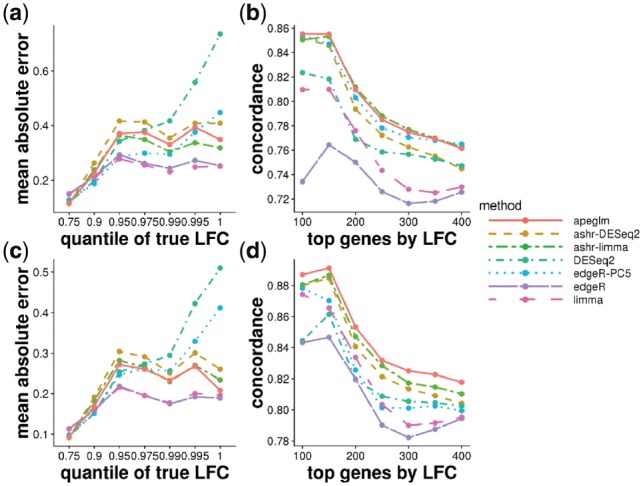
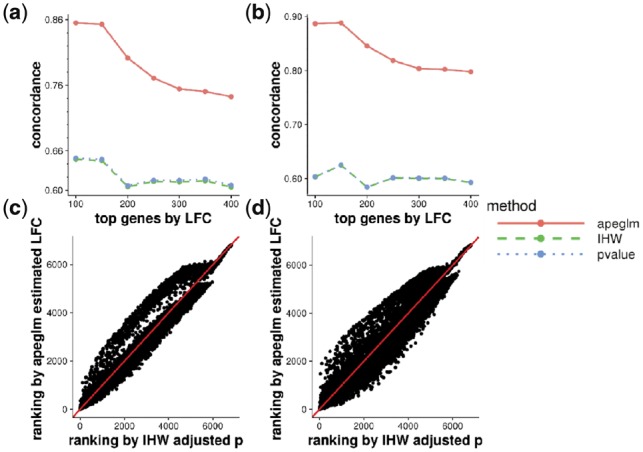
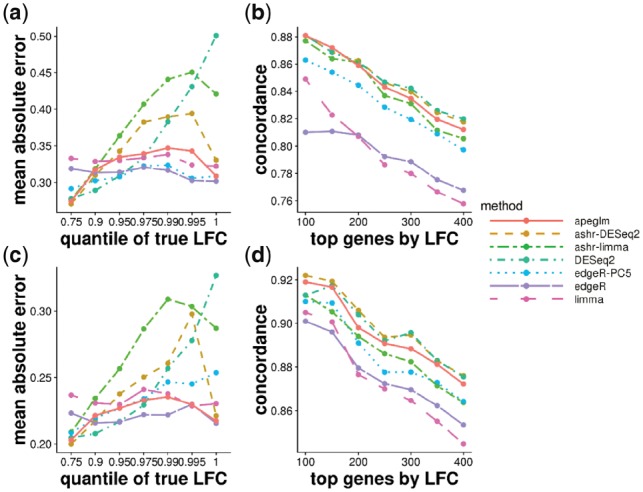
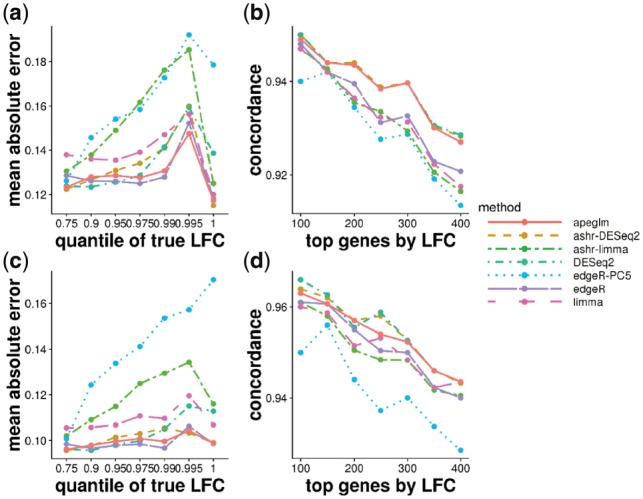
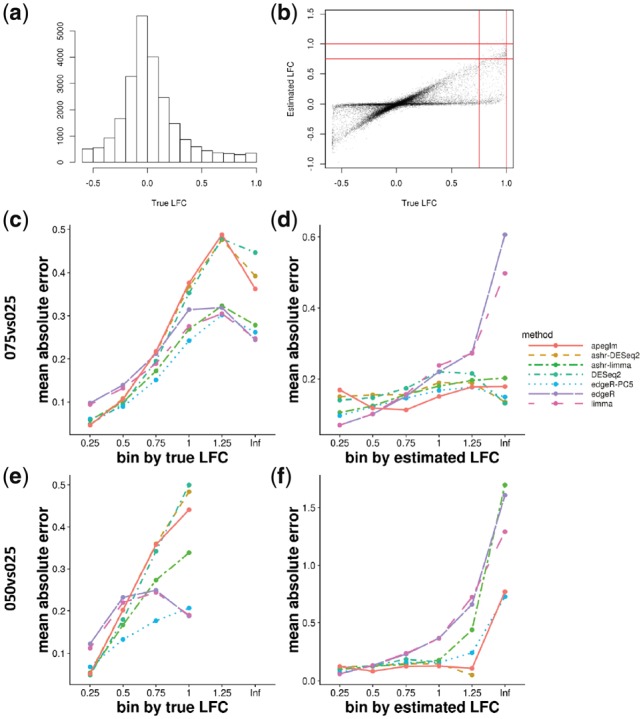
Results: When the read counts are low or highly variable, the maximum likelihood estimates for the LFCs has high variance, leading to large estimates not representative of true differences, and poor ranking of genes by effect size. One approach is to introduce filtering thresholds and pseudocounts to exclude or moderate estimated LFCs. Filtering may result in a loss of genes from the analysis with true differences in expression, while pseudocounts provide a limited solution that must be adapted per dataset. Here, we propose the use of a heavy-tailed Cauchy prior distribution for effect sizes, which avoids the use of filter thresholds or pseudocounts. The proposed method, Approximate Posterior Estimation for generalized linear model, apeglm, has lower bias than previously proposed shrinkage estimators, while still reducing variance for those genes with little information for statistical inference.

Availability and implementation: The apeglm package is available as an R/Bioconductor package at https://bioconductor.org/packages/apeglm, and the methods can be called from within the DESeq2 software.

Supplementary information: Supplementary data are available at Bioinformatics online.


Figures

Fig. 1.
Fig. 1.
An overview of the method. apeglm takes the MLE estimates and corresponding standard errors of a GLM model as input. In apeglm we provide a heavy-tailed prior distribution on the coefficients, and compute the shrinkage estimators and corresponding SDs. Users can also define a likelihood function that describes the data and feed to apeglm. apeglm also provides the local FSRs and s-values (Stephens, 2017) as part of the output
Fig. 2.
Fig. 2.
(a) MAE of estimates for 3 versus 3 samples, defined as the mean of the absolute value of the differences between the estimated and reference LFCs, stratified by absolute value of reference LFCs. The mean of MAE over 100 iterations is plotted for each method. The x-axis label gives the upper bound of the bin on absolute value of LFCs. (b) Concordance At the Top (CAT) plot (Irizarry et al., 2005) comparing ranked gene lists from each method against the reference ranked gene list for 3 versus 3 samples. Number of top genes ranked by the absolute value of the LFCs is on the x-axis, and the proportion of concordance between the two rankings is on the y-axis. For example, if the ranked gene list from apeglm estimated and reference LFCs share 85 of top 100 genes, then the apeglm point would fall at (100, 0.85). (c) MAE plot of estimates for 5 versus 5 samples. (d) CAT plot for 5 versus 5 samples
Fig. 3.
Fig. 3.
(a) CAT plot comparing ranked gene lists from apeglm estimated LFCs, DESeq2 p values and IHW adjusted P values for 3 versus 3 samples. (b) CAT plot comparing ranked gene lists from apeglm estimated LFCs, DESeq2 P values and IHW adjusted P values for 5 versus 5 samples. (c) Rank plot comparing the ranks of genes from apeglm estimated LFCs and IHW adjusted P values for 3 versus 3 samples. (d) Rank plot comparing the ranks of genes from apeglm estimated LFCs and IHW adjusted p values for 5 versus 5 samples
Fig. 4.
Fig. 4.
Simulation dataset (top row, 5 versus 5, and bottom row, 10 versus 10) modeled on estimated parameters from the Pickrell et al. (2010) dataset. Each point represents the average over 10 repeated simulations
Fig. 5.
Fig. 5.
MAE plot over LFCs (left) and CAT plots (right) of simulation dataset (top row, 30 versus 30 and bottom row, 50 versus 50) modeled on estimated parameters from the Pickrell et al. (2010) dataset. Each point represents the average over 10 repeated simulations
Fig. 6.
Fig. 6.
(a) The distribution of the true LFCs for comparison 050 versus 025, where the true LFCs is predicted with the fitted non-linear model. (b) Scatter plot of estimated LFCs from apeglm over true LFCs for comparison 050 versus 025. The vertical and horizontal lines indicate the two type of bins that were used for stratifying estimation error. (c and d) MAE plot binned by true LFCs and by estimated LFCs for comparison 075 versus 025 (e and f) MAE plot binned by true LFCs and by estimated LFCs for comparison 050 versus 025

References

    1. Anders S., Huber W. (2010) Differential expression analysis for sequence count data. Genome Biol., 11, R106.. - PMC - PubMed
    1. Bottomly D. et al. (2011) Evaluating gene expression in C57BL/6J and DBA/2J mouse striatum using RNA-Seq and microarrays. PLoS One, 6, e17820.. - PMC - PubMed
    1. Brent R.P. (1972). Algorithms for Minimization without Derivatives. Prentice-Hall, Englewood Cliffs, New Jersey, 1973.
    1. Chen Y. et al. (2016) From reads to genes to pathways: differential expression analysis of RNA-Seq experiments using Rsubread and the edgeR quasi-Likelihood pipeline. F1000Res. 5, 1438. Doi: 10.12688/f1000research.8987.2. - PMC - PubMed
    1. Choi H. et al. (2008) Statistical validation of peptide identifications in large-scale proteomics using the target-decoy database search strategy and flexible mixture modeling. J. Proteome Res., 7, 286–292. - PubMed

Publication types