. 2018 Dec 3;128(12):5549-5560.
doi: 10.1172/JCI123360. Epub 2018 Nov 5.

An osteopontin/CD44 immune checkpoint controls CD8+ T cell activation and tumor immune evasion

Affiliations

An osteopontin/CD44 immune checkpoint controls CD8+ T cell activation and tumor immune evasion

John D Klement et al. J Clin Invest. .

Abstract

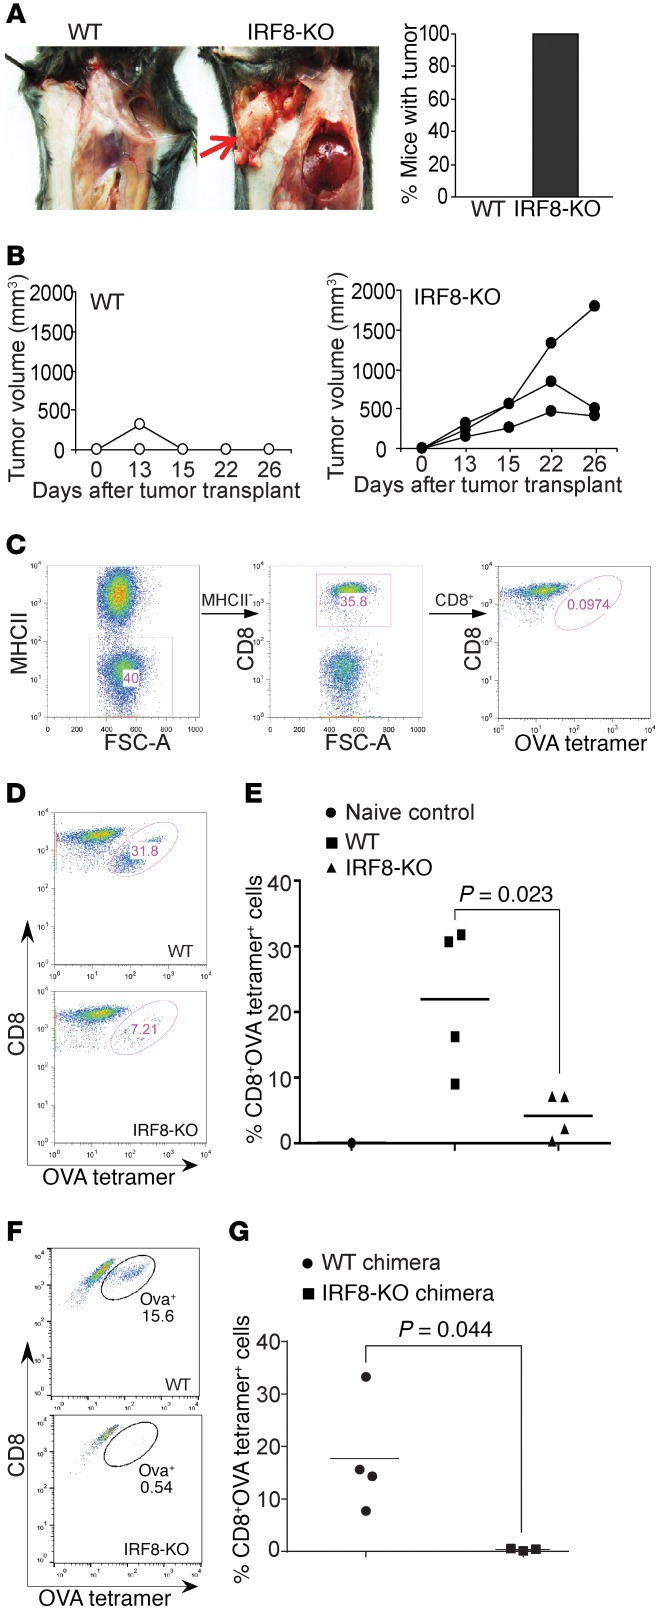
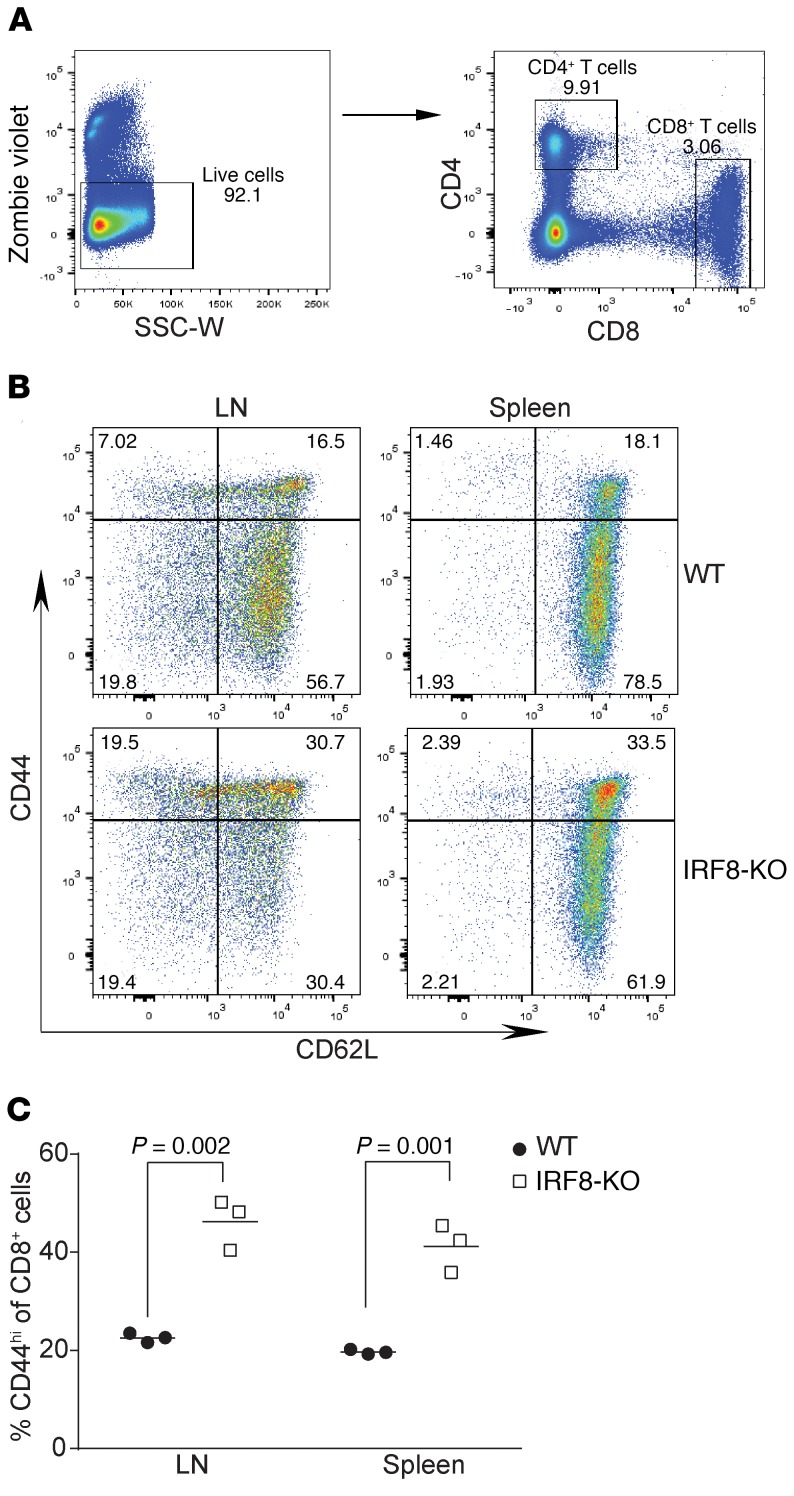
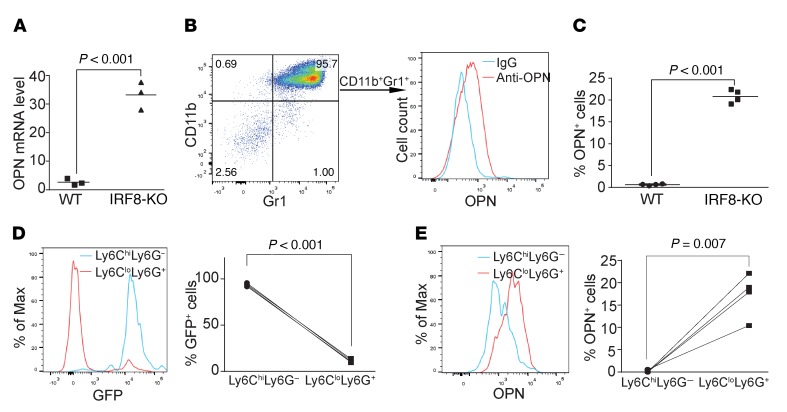
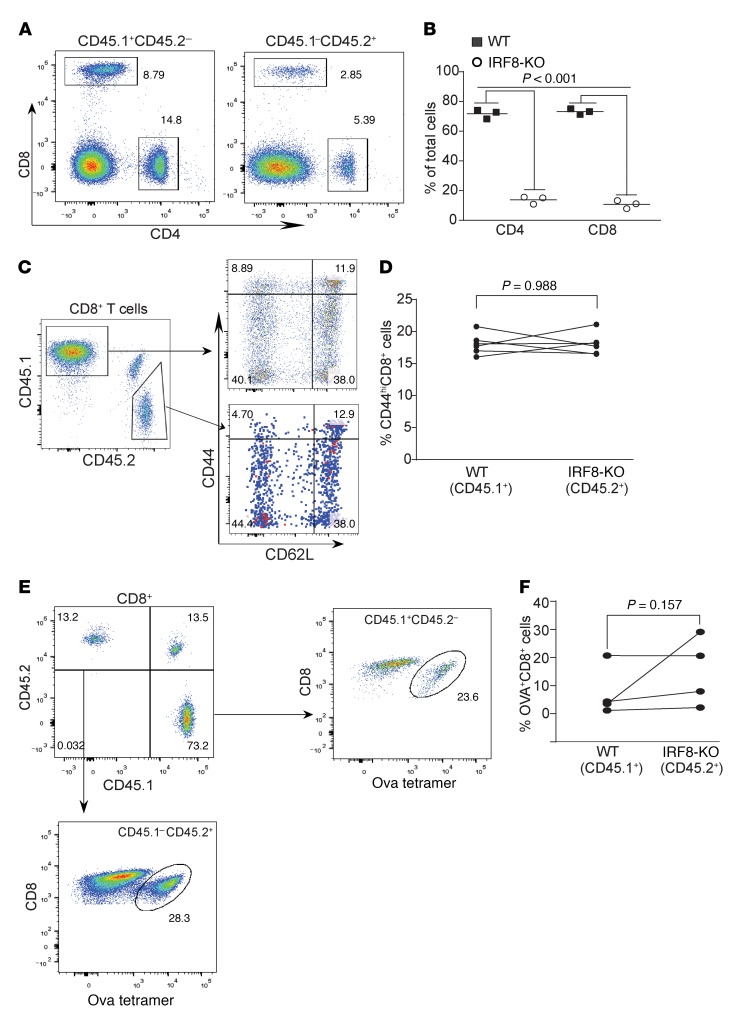
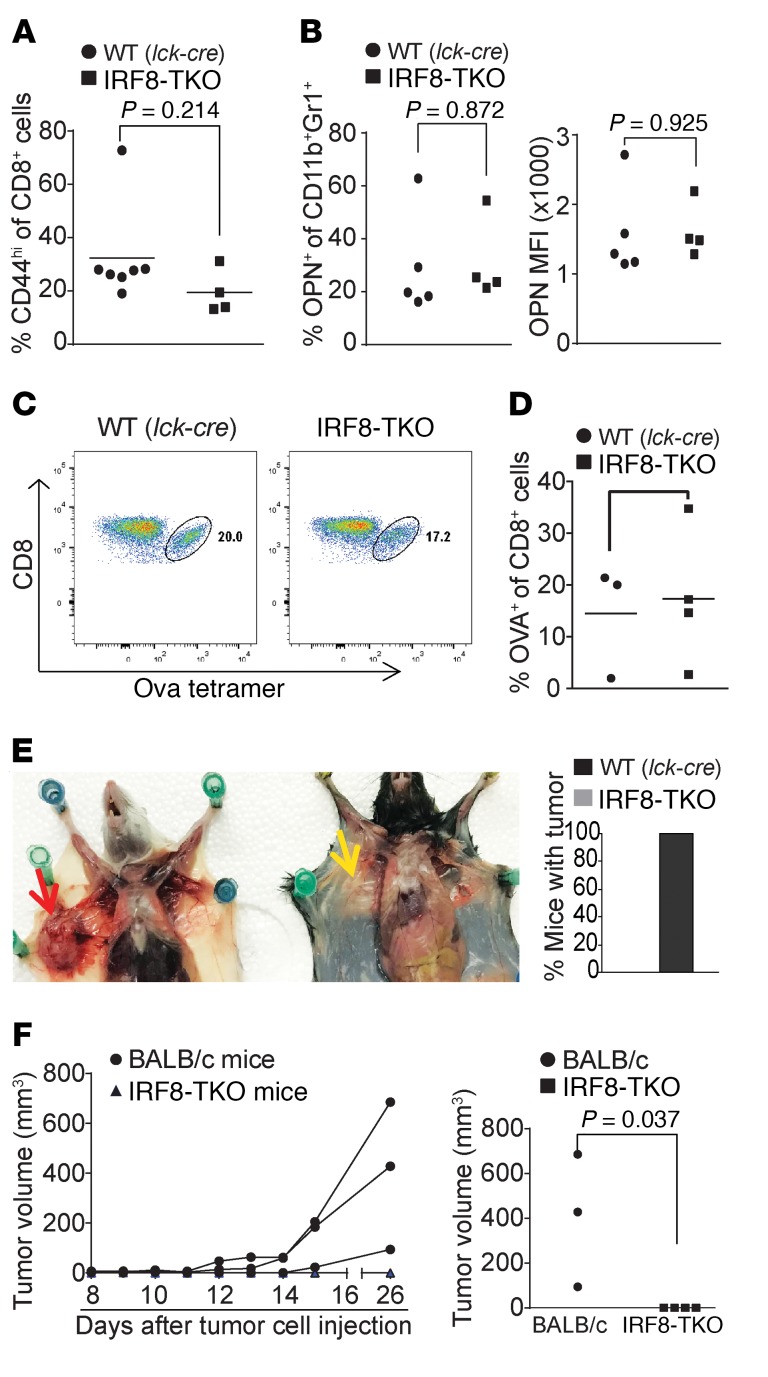
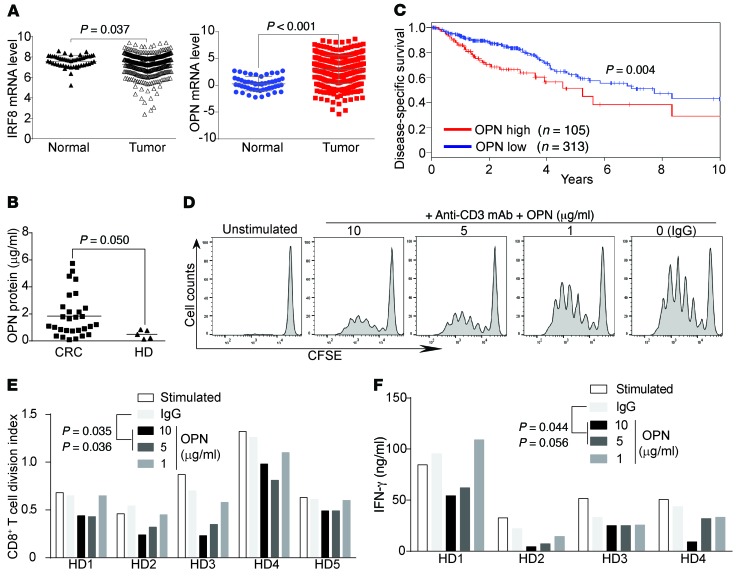
Despite breakthroughs in immune checkpoint inhibitor (ICI) immunotherapy, not all human cancers respond to ICI immunotherapy and a large fraction of patients with the responsive types of cancers do not respond to current ICI immunotherapy. This clinical conundrum suggests that additional immune checkpoints exist. We report here that interferon regulatory factor 8 (IRF8) deficiency led to impairment of cytotoxic T lymphocyte (CTL) activation and allograft tumor tolerance. However, analysis of chimera mice with competitive reconstitution of WT and IRF8-KO bone marrow cells as well as mice with IRF8 deficiency only in T cells indicated that IRF8 plays no intrinsic role in CTL activation. Instead, IRF8 functioned as a repressor of osteopontin (OPN), the physiological ligand for CD44 on T cells, in CD11b+Ly6CloLy6G+ myeloid cells and OPN acted as a potent T cell suppressor. IRF8 bound to the Spp1 promoter to repress OPN expression in colon epithelial cells, and colon carcinoma exhibited decreased IRF8 and increased OPN expression. The elevated expression of OPN in human colon carcinoma was correlated with decreased patient survival. Our data indicate that myeloid and tumor cell-expressed OPN acts as an immune checkpoint to suppress T cell activation and confer host tumor immune tolerance.

Keywords: Cancer immunotherapy; Immunology; Immunotherapy; T cells.


Conflict of interest statement

Conflict of interest: The authors have declared that no conflict of interest exists.

Figures

Figure 1
Figure 1. IRF8 is essential for tumor rejection and antigen-specific CD8+ T cell activation.
(A) The BALB/c mouse–derived mammary carcinoma 4T1 cells (1 × 10⁴ cells/mouse) were injected into the mammary gland of WT (C57BL6/J, n = 4) and IRF8-KO (C57BL/6, n = 3) mice. Mice were sacrificed at day 26 and dissected for examination of tumor presence. The image is representative of WT and IRF8-KO mice. The red arrow indicates location of 4T1 tumor. The right panel shows percentage of mice with tumor. Shown are representative images of 1 of 3 independent experiments. (B) Tumor growth was monitored over time. Each line represents the tumor growth kinetics of an individual mouse. (CE) WT (n = 4) and IRF8-KO (n = 4) mice were vaccinated with OVA peptide, followed by a boost with the same peptide regime 14 days later. Peripheral blood was collected 7 days after boost and stained with MHCII-, CD8-, and OVA tetramer–specific antibodies. MHCIICD8+ cells were gated for OVA tetramer+ cells. Naive C57BL/6 mice were used as negative and gating controls (C). FSC-A, forward scatter–area. Shown are representative plots of one pair of WT and IRF8-KO mice from 1 of 2 independent experiments (D). The tetramer+ CD8+ T cells were quantified (E). (F) WT C57BL/6 and IRF8-KO BM cells were adoptively transferred into lethally irradiated C57BL/6 recipient mice to recreate chimera mice with IRF8 deficiency only in the hematopoietic cells. The chimera WT (n = 4) and IRF8-KO (n = 3) mice were vaccinated as in AC and analyzed for OVA-specific CD8+ T cells. Shown are representative plots from one pair of mice. (G) Quantification of OVA-specific CD8+ T cells in WT and IRF8-KO chimera mice.
Figure 2
Figure 2. IRF8 deficiency increases CD44hiCD8+ memory T cells.
(A) Peripheral blood cells were stained with Zombie violet to exclude dead cells and the live cells were analyzed for CD4+ and CD8+ T cells. SSC-W, side scatter–width. (B) LN and spleen cells were collected from WT (n = 3) and IRF8-KO (n = 3) mice. The CD8+ cells gated out as in A were further analyzed for CD44hi cells with CD62L as reference. Shown are representative plots of 1 pair of the mice. (C) The percentage of CD8+CD44hi cells as shown in A were quantified.
Figure 3
Figure 3. IRF8 represses the expression of OPN expression in myeloid cells.
(A) RNA was prepared from total spleens of WT (n = 3) and IRF8-KO (n = 3) mice and analyzed by qPCR for OPN mRNA level. (B) Spleen cells of WT (n = 3) and IRF8-KO (n = 3) mice were stained with CD19-, CD3-, CD11b-, and Gr1-specific mAbs, followed by intracellular staining of OPN. The OPN+ cells were gated to show the CD11b+Gr1+ myeloid cells from IRF8-KO mice (left panel). OPN protein level in these CD11b+Gr1+ myeloid cells is shown in the right panel. (C) The OPN+ cells in total spleen cells of WT (n = 3) and IRF8-KO (n = 3) mice as shown in B were quantified. (D) Spleen cells from IRF8-GFP mice were stained with Ly6G- and Ly6C-specific mAbs. Ly6ChiLy6G+ and Ly6CloLy6G cells were overlaid for GFP intensity. Shown are representative plots of 1 of 3 mice (left panel). The GFP+ cells of the Ly6ChiLy6G+ and Ly6CloLy6G cells were quantified and are presented in the right panel. (E) The spleen cells were stained with Ly6C- and Ly6G-specific mAbs, followed by intracellular staining with OPN-specific antibody. The Ly6ChiLy6G+ and Ly6CloLy6G cells were gated and analyzed for OPN expression level. Representative plot of 1 of 3 mice is shown. The OPN+ cells in Ly6ChiLy6G+ and Ly6CloLy6G cells were quantified and are presented in the right panel.
Figure 4
Figure 4. OPN inhibits T cell activation in vitro.
(A) CD3+ T cells from WT mouse spleen were labeled with CFSE and cultured in plates coated with anti-CD3 (0.8 μg/ml) and anti-CD28 (10 μg/ml) mAbs and OPN at the indicated concentrations for 3 days. Cells were then stained with CD8-specific mAb and CD8+ T cells were analyzed for CFSE intensity. The CFSE labeled and unstimulated cells were used as control. Representative data of cells from 1 of the 3 mice are shown. (B) CFSE intensity as shown in A was quantified as division index. (C) CD3+ T cells were cultured in plates coated with anti-CD3 (0.8 μg/ml) and anti-CD28 (10 μg/ml) mAbs and OPN at the indicated concentrations in triplicate for 3 days. Culture supernatant was collected and measured for IFN-γ protein level by ELISA. Data from B and C were analyzed using a 1-way ANOVA, with Dunnett’s test for multiple comparisons. (D) CD3+ T cells were cultured in plates coated with anti-CD3 (0.8 μg/ml) and anti-CD28 (10 μg/ml) mAbs in the presence of IgG (5 μg/ml) or OPN (1 μg/ml and 5 μg/ml, respectively). Cells were collected at the indicated time points, stained with CD69-, CD25-, PD-1–, and CD8-specific mAbs, and analyzed by flow cytometry. Data are mean ± SD. Significance was calculated using a 2-way ANOVA with Tukey’s test.
Figure 5
Figure 5. IRF8 regulates antigen-specific CD8+ T cell differentiation and activation in a cell-extrinsic manner.
(A) Competitive mixed BM chimeras were created by adoptively transferring SJL (CD45.1+) WT whole BM cells with Irf8–/– BM cells into lethally irradiated C57BL/6×SJL) F1 recipients (CD45.1+CD45.2+). Peripheral blood cells were collected from WT and IRF8-KO mixed BM chimera mice, stained with CD45.1-, CD45.2-, CD4-, and CD8-specific mAbs, and analyzed by flow cytometry. Shown are representative plots of phenotypes of WT (CD45.1) and IRF8-KO (CD45.2) CD4+ and CD8+ T cells in the mixed BM chimeras. (B) The CD4+ and CD8+ cells from WT (CD45.1) and IRF8-KO (CD45.2) as shown in A were quantified. (C) Blood cells from WT and IRF8-KO mixed BM chimera mice were stained with CD45.1-, CD45.2-, CD8, CD44-, and CD62L-specific mAbs. CD8+ T cells were gated out for CD45.1 and CD45.2 cells. The WT and IRF8-KO CD8+ cells were then analyzed for CD44hi and CD62L+ cells. Representative plots of 1 of 3 mice are shown. (D) The percentage of CD44hi cells of the WT CD8+ and IRF8-KO CD8+ T cells was quantified. (E) WT (CD45.1) and IRF8-KO (CD45.2) mixed BM chimera mice were vaccinated with OVA peptide, followed by a boost with OVA peptide 14 days later. Peripheral blood was collected 7 days after boost and stained with MHCII-, CD8-, and OVA tetramer–specific antibodies. MHCII-CD8+ cells were gated for OVA tetramer+ cells. Shown are representative plots of OVA-specific WT and IRF8-KO CD8+ T cells. (F) The WT and IRF8-KO CD8+ OVA-specific T cells as shown in E were quantified.
Figure 6
Figure 6. Mice with IRF8 deficiency only in T cells exhibit no deficiency in generation of antigen-specific CD8+ T cells and reject allograft tumor.
(A) Blood cells were collected from WT (Lck-cre+/–Irf8+/+, n = 7) and IRF8-TKO (n = 4) mice. Cells were stained with CD8- and CD44-specific mAbs and analyzed by flow cytometry. The CD8+ and CD44hi cells were quantified. Column: mean; bar: SD. (B) Spleen cells were collected from WT (Lck-cre+/–Irf8+/+, n = 7) and IRF8-TKO (n = 4) stained with CD11b- and Gr1-specific mAbs, followed by intracellular staining with OPN-specific mAb. The CD11b+Gr1+ cells were then gated and analyzed for percentage of OPN+ cells (left panel) and OPN MFI (right panel). (C) WT (Lck-cre+/–Irf8+/+, n = 4) and IRF8-TKO (n = 3) mice vaccinated with OVA peptide, followed by a boost with OVA peptide 14 days later. Peripheral blood was collected 7 days after boost and stained with MHCII-, CD8-, and OVA tetramer–specific antibodies. MHCII-CD8+ cells were gated for OVA tetramer+ cells. Shown are representative plots of OVA-specific CD8+ T cells in WT and IRF8-TKO mice. (D) WT and IRF8-KO CD8+ OVA-specific T cells as shown in C were quantified. (E) 4T1 cells (1 × 10⁴ cells/mouse) were injected into the mammary gland of BALB/c (n = 3) and IRF8-TKO (C57BL/6, n = 4) mice. Mice were sacrificed at day 26 and dissected for examination of tumor presence. Shown is a representative image of 4T1 tumor-bearing BALB/c and 4T1 tumor-challenged IRF8-TKO mice. The red arrow indicates location of the 4T1 tumor. Yellow area indicates lack of tumor in injected area. The right panel shows percentage of mice with tumor. (F) Tumor growth was monitored over time and the tumor growth kinetics is presented in the left panel. Each line represents the tumor growth kinetics of an individual mouse. The tumor size at day 31 after tumor injection is presented in the right panel.
Figure 7
Figure 7. IRF8 functions as a transcriptional repressor of OPN in colon epithelial cells.
(A and B) Total RNA was isolated from mouse colon (n = 5) and AOM-DSS–induced colon carcinoma (n = 3) tissues and analyzed by qPCR for IRF8 (A) and OPN (B) expression levels. Each dot represents data from one mouse. Significance was determined using the nonparametric Mann-Whitney U test. (C) Colon tissues (c1 and c2) from tumor-free IRF8-GFP reporter mice (n = 3) and tumor tissues (c3) from AOM-DSS–induced colon tumor mice (n = 3) were collected analyzed for GFP intensity under a confocal microscope. Scale bars: 100 μM (c1 and c3) and 20 μM (c2). Shown are representative images of each group. (D) Serum was collected from tumor-free (n = 6) and AOM-DSS–induced colon tumor-bearing (n = 5) mice and analyzed for OPN protein level by ELISA. (E) The Spp1 promoter structure showing the 2 putative ISRE consensus sequence elements. The ChIP PCR-amplified regions are also indicated. +1 indicates Spp1 gene transcription initiation site. (F) Normal mouse colon tissues were analyzed by ChIP using IgG (negative control) and anti-IRF8 antibody. The Spp1 promoter–specific qPCR-amplified regions are indicated at the top panel. The ChIP qPCR were normalized to input DNA. (G) CD3+ T cells were stimulated on anti-CD3– and anti-CD28–coated plates for 3 days. Nuclear extracts were prepared and analyzed for IRF8 binding by using EMSA with the Pdcd1 promoter ISRE consensus sequence DNA probe (Supplemental Table 1). Anti-IRF8 antibody was used to identify the IRF8-DNA complexes. IgG was used as a negative control. Red arrows point to the IRF8-Pdcd1 ISRE DNA complexes. (H) Nuclear extract was prepared from normal mouse colon and incubated with the 2 ISRE DNA probes as shown in D. The unlabeled Pdcd1 ISRE DNA probe (cold probe) was used at the indicated amount (fold over the labeled Spp1 ISRE probes) to compete the Spp1 IRRE probes. Green arrow points IRF8-DNA complex.
Figure 8
Figure 8. OPN is elevated in human colon carcinoma and inversely correlated with patient survival.
(A) IRF8 and OPN mRNA expression data sets in normal colon and colon carcinoma tissues were extracted from TCGA database and compared as indicated. (B) Serums were collected from healthy donors and patients with colon cancer, and analyzed for OPN protein level by ELISA. Each dot represents serum OPN protein level from 1 donor or patient. (C) OPN mRNA expression levels in human patients with colon cancer were extracted from TCGA database and analyzed by Kaplan-Meier survival analysis. (D) CD3+ human T cells were purified from healthy donors, labeled with CFSE, and cultured in plates coated with anti-CD3 (1 μg/ml) mAb and OPN at the indicated concentrations for 3 days. Cells were then stained with CD8-specific mAb and CD8+ T cells were analyzed for CFSE intensity. The CFSE-labeled and unstimulated cells were used as control. Representative data of cells from 1 of 5 donors are shown. (E) CFSE intensity as shown in D was quantified as division index. Data from 5 healthy donors (HD1-HD5) are shown. (F) Human CD3+ T cells were cultured in plates coated with anti-CD3 (1 μg/ml) mAb and OPN at the indicated concentrations for 3 days. Culture supernatant was collected and measured for IFN-γ protein level by ELISA. Data from 4 healthy donors are shown. Statistical significance for each treatment in E and F was determined by ANOVA, using Dunett’s test for multiple comparisons.

Comment in

References

    1. Thaker YR, Schneider H, Rudd CE. TCR and CD28 activate the transcription factor NF-κB in T-cells via distinct adaptor signaling complexes. Immunol Lett. 2015;163(1):113–119. doi: 10.1016/j.imlet.2014.10.020. - DOI - PMC - PubMed
    1. Chen L, Flies DB. Molecular mechanisms of T cell co-stimulation and co-inhibition. Nat Rev Immunol. 2013;13(4):227–242. doi: 10.1038/nri3405. - DOI - PMC - PubMed
    1. Kägi D, et al. Fas and perforin pathways as major mechanisms of T cell-mediated cytotoxicity. Science. 1994;265(5171):528–530. doi: 10.1126/science.7518614. - DOI - PubMed
    1. Boussiotis VA. Molecular and biochemical aspects of the PD-1 checkpoint pathway. N Engl J Med. 2016;375(18):1767–1778. doi: 10.1056/NEJMra1514296. - DOI - PMC - PubMed
    1. Keir ME, Butte MJ, Freeman GJ, Sharpe AH. PD-1 and its ligands in tolerance and immunity. Annu Rev Immunol. 2008;26:677–704. doi: 10.1146/annurev.immunol.26.021607.090331. - DOI - PMC - PubMed

Publication types

MeSH terms