

Antenatal placental assessment in the prediction of adverse pregnancy outcome after reduced fetal movement
- PMID: 30395584
- PMCID: PMC6218043
- DOI: 10.1371/journal.pone.0206533
Antenatal placental assessment in the prediction of adverse pregnancy outcome after reduced fetal movement
Abstract
Objective: To assess the value of in utero placental assessment in predicting adverse pregnancy outcome after reported reduced fetal movements (RFM).
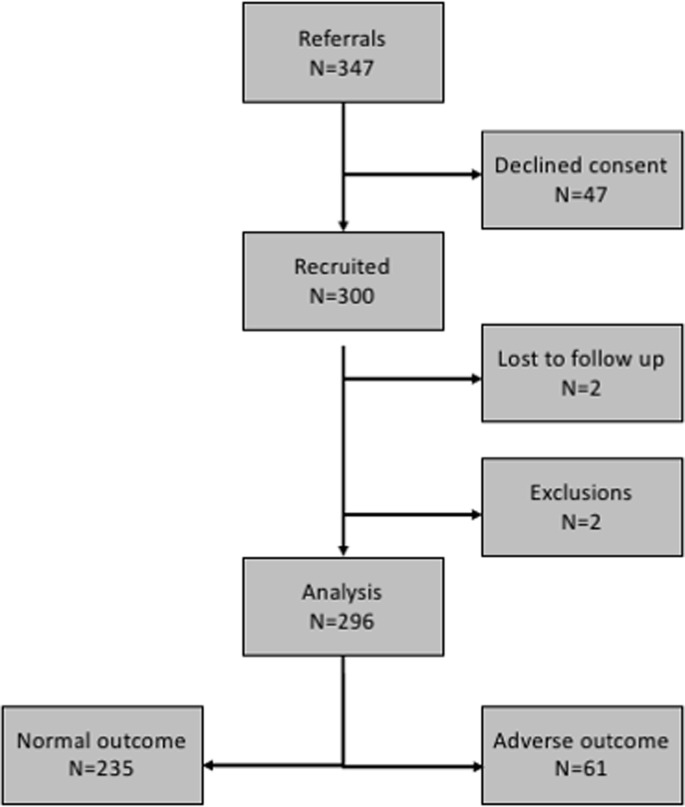
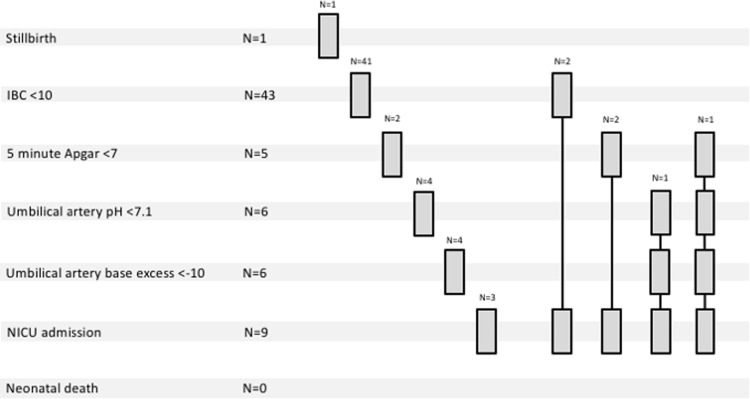
Method: A non-interventional prospective cohort study of women (N = 300) with subjective RFM at ≥28 weeks' gestation in singleton non-anomalous pregnancies at a UK tertiary maternity hospital. Clinical, sonographic (fetal weight, placental size and maternal, fetal and placental arterial Doppler) and biochemical (maternal serum hCG, hPL, progesterone, PlGF and sFlt-1) assessment was conducted. Multiple logistic regression identified combinations of measurements (models) most predictive of adverse pregnancy outcome (perinatal mortality, birth weight <10th centile, five minute Apgar score <7, umbilical arterial pH <7.1 or base excess <-10, neonatal intensive care admission). Models were compared by test performance characteristics (ROC curve, sensitivity, specificity, positive/negative predictive value, positive/negative likelihood ratios) against baseline care (estimated fetal weight centile, amniotic fluid index and gestation at presentation).
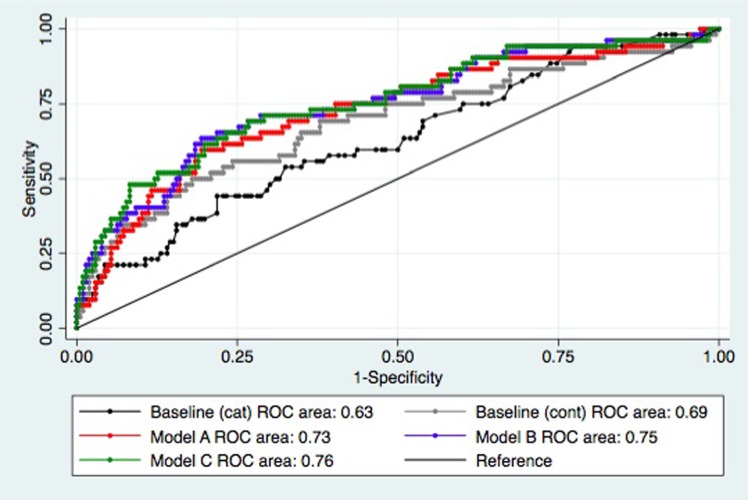
Results: 61 (20.6%) pregnancies ended in adverse outcome. Models incorporating PlGF/sFlt-1 ratio and umbilical artery free loop Doppler impedance demonstrated modest improvement in ROC area for adverse outcome (baseline care 0.69 vs. proposed models 0.73-0.76, p<0.05). However, there was little improvement in other test characteristics (baseline vs. best proposed model: sensitivity 21.7% [95% confidence interval 13.1-33.6] vs. 35.8%% [24.4-49.3], specificity 96.6% [93.4-98.3] vs. 94.7% [90.7-97.0], PPV 61.9% [40.9-79.3] vs. 63.3% [45.5-78.1], NPV 82.8% [77.9-86.8] vs. 85.2% [80.0-89.2], positive LR 6.3 [2.8-14.6] vs. 6.7 [3.4-3.3], negative LR 0.81 [0.71-0.93] vs. 0.68 [0.55-0.83]) and wide confidence intervals. Negative post-test probability remained high (16.7% vs. 14.0%).
Conclusion: Antenatal placental assessment may improve identification of RFM pregnancies at highest risk of adverse pregnancy outcome but further work is required to understand and refine currently available outcome definitions and diagnostic techniques to improve clinical utility.
Conflict of interest statement
The authors have declared that no competing interests exist.
Figures
References
-
- MacDorman MF. Fetal and Perinatal Mortality, United States, 2006. National Vital Statistics Reports, Volume 60 Number 8 2012 [cited; Available from: http://www.cdc.gov/nchs/data/nvsr/nvsr60/nvsr60_08.pdf - PubMed
-
- Ministry of Health. Fetal and Infant Deaths 2008 and 2009. 2012 [cited; Available from: http://www.health.govt.nz/system/files/documents/publications/fetal-infa...
-
- Zeitlin JM, A.; Delnord M. European Perinatal Health Report. Health and Care of Pregnant Women and Babies in Europe in 2010; 2013. - PubMed
Publication types
MeSH terms
Grants and funding
LinkOut - more resources
Full Text Sources
Research Materials
