. 2018 Nov 5;13(11):e0206467.
doi: 10.1371/journal.pone.0206467. eCollection 2018.

Pyronaridine exerts potent cytotoxicity on human breast and hematological cancer cells through induction of apoptosis

Affiliations

Pyronaridine exerts potent cytotoxicity on human breast and hematological cancer cells through induction of apoptosis

Paulina J Villanueva et al. PLoS One. .

Abstract

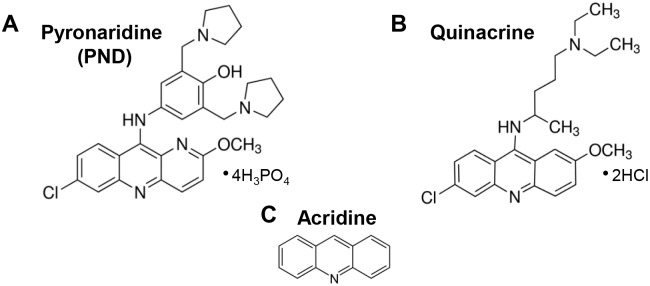
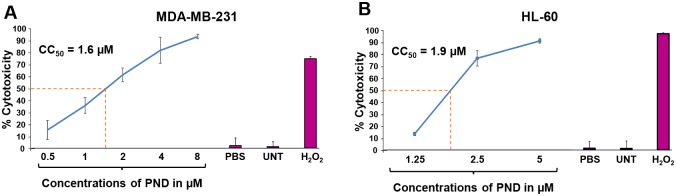
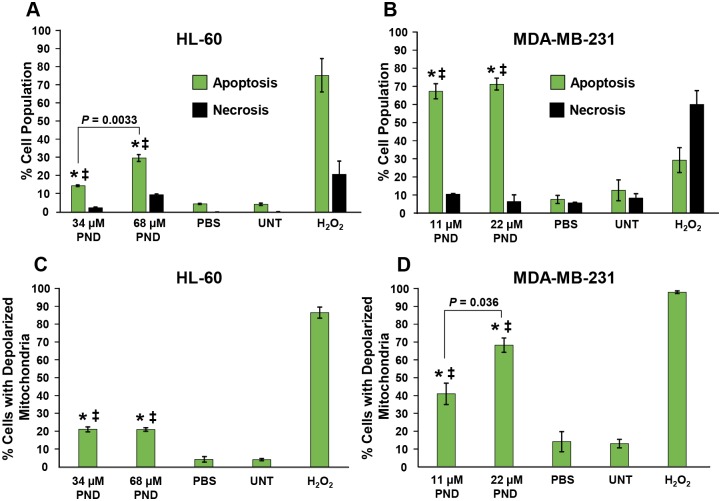
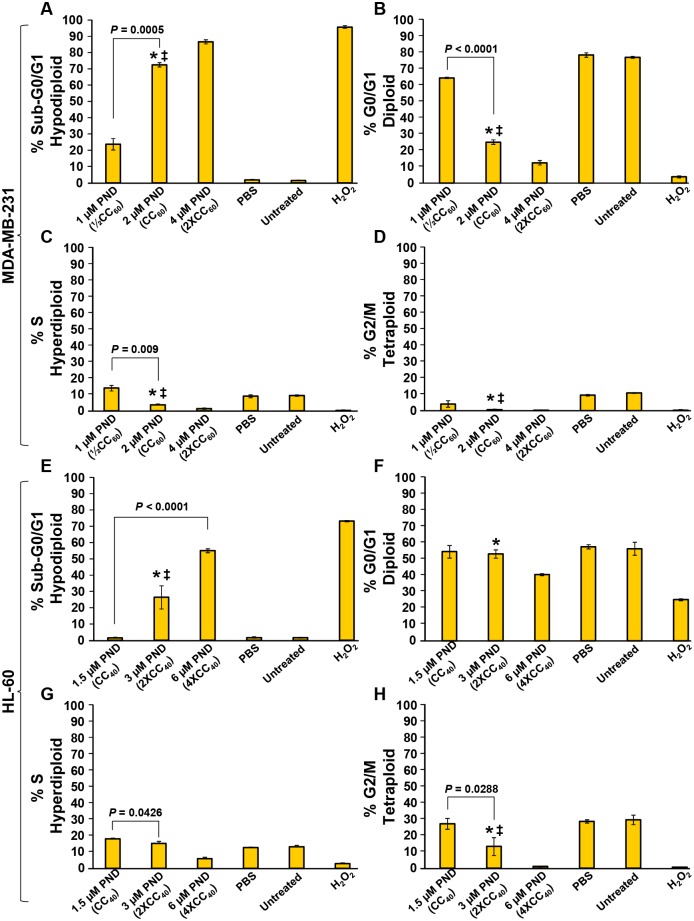
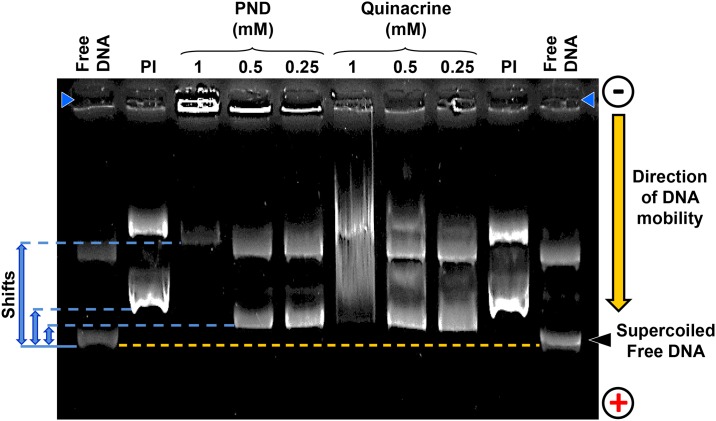
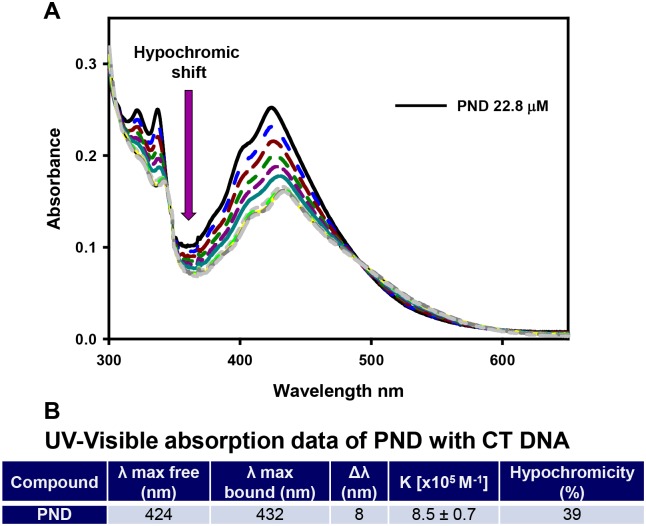
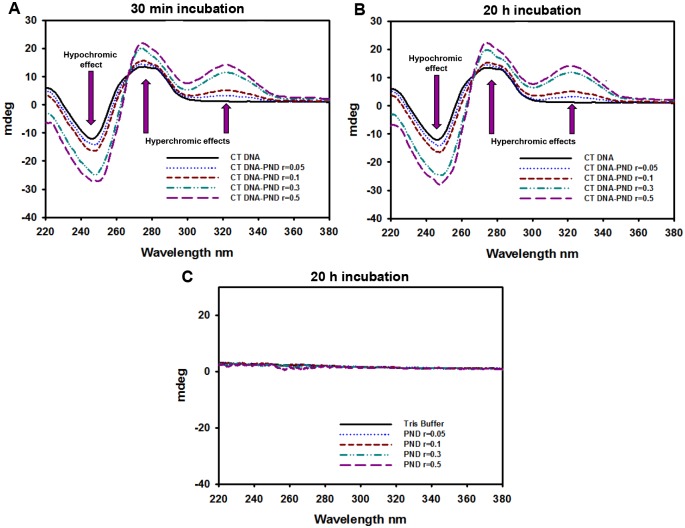
The potent antimalarial drug pyronaridine (PND) was tested for its potential as an anticancer drug. After exposing cancerous (17) and non-cancerous (2) cells to PND for 72 hr, PND was found to exhibit consistent and potent cytotoxic activity at low micromolar (μM) concentrations that ranged from 1.6 μM to 9.4 μM. Moreover, PND exerted a significant selective cytotoxicity index (SCI) on five out of seven breast cancer cell lines tested, with favorable values of 2.5 to 4.4, as compared with the non-cancerous breast MCF-10A cell line. By using the same comparison, PND exhibited a significant SCI on three out of four leukemia/lymphoma cell lines with promising values of 3.3 to 3.5. One breast cancer and one leukemia cell line were tested further in order to determine the likely mode of action of PND. PND was found to consistently elicit phosphatidylserine externalization, mitochondrial depolarization, and DNA fragmentation, in both the triple negative MDA-MB-231 breast cancer and HL-60 leukemia cell lines. In addition, PND treatment altered cell cycle progression in both cancer cells. Subsequent DNA mobility-shift assays, UV-Visible spectroscopic titrations, and circular dichroism (CD) experiments revealed that PND intercalates with DNA. The findings presented in this study indicates that PND induces apoptosis and interfered with cell cycle progression of cancer cell lines and these results indicate that this drug has the potential as a repurposed drug for cancer therapy.


Conflict of interest statement

The authors have declared that no competing interests exist.

Figures

Fig 1
Fig 1. The chemical structures of pyronaridine tetraphosphate (A), quinacrine dihydrochloride (B) and acridine (C) are depicted for comparative purposes.
Quinacrine and acridine are related antimalarial compounds with similar chemical structures to PND and used as controls in some experiments.
Fig 2
Fig 2. Representative PND dose-response curves utilized to determine the CC50 values.
For these analyses, cells were exposed for 72 h to PND and cell viability was determined via the DNS assay. As an example, MDA-MB-231 (A) and HL-60 (B) were treated with a PND concentration gradient, as indicated on the x-axis while the percentage of cytotoxicity (dead cells) is shown on the y-axis. In this series of experiments, several controls were included: untreated cells and cells treated with the PBS diluent alone (0.5% v/v) were used as negative controls while 1 mM H2O2 was used as a positive control of cytotoxicity. Each experimental point represents the mean of four replicas and error bars their corresponding standard deviation. Cytotoxic concentration 50% (CC50) in micromolar (μM) units is defined as the concentration of PND required to perturb the plasma membrane of 50% of the cells after 72 h of incubation.
Fig 3
Fig 3. PND induced phosphatidylserine externalization on MDA-MB-231 (A) and HL-60 (B) cancer cells after 24 h of incubation.
The cell death mechanism was studied after double staining of cells with annexin V-FITC and PI and monitored via flow cytometry. (A-B) The total percentages of cell undergoing apoptosis (y-axis) are expressed as the sum of both early and late stages of apoptosis (green bars); whereas cells stained only with PI and annexin V-FITC negative, were counted as the necrotic cell population (black bars). Calculations of two-tailed Student’s paired t-test of PND-treated cells as compared with PBS-treated (*) and untreated (‡) cells controls, provided consistently values of P < 0.001, in both circumstances. Each bar represents the mean of triplicates, and error bars the standard deviation of the mean. PND inflicted its cytotoxic effect via mitochondrial membrane depolarization on MDA-MB-231 (C) and HL-60 (D) cells. Cells were treated with PND for 6 h and changes in the mitochondrial membrane potential (ΔΨm) were monitored by staining them with JC-1 and examined via flow cytometry. The JC-1 reagent emits a green fluorescence signal after mitochondrial depolarization. (C-D) Percentages of cells emitting a green fluorescence signal, y-axis, versus different treatments, x-axis, are depicted. 1 mM of H2O2 was used as a positive control as it strongly perturbs mitochondrial membrane potential (ΔΨm). Each bar represents the mean of three replicates and error bar the standard deviation. Two-tailed Student’s paired t-test of PND-treated cells, as compared with PBS-treated (*) and untreated (‡) cell controls, provided consistent values of P < 0.01 and P < 0.001, respectively.
Fig 4
Fig 4. PND disturbed the cell-cycle profile of two cancer cell lines, MDA-MB-231 (A-D) and HL-60 (E-H), and also exhibited apoptosis-induced DNA fragmentation in a dose-dependent mode.
After 72 h of PND treatment, cells were harvested, fixed, permeabilized, stained with DAPI and analyzed via flow cytometry. The percentages for each cell cycle phase are presented along with the y-axis, whereas the different treatments are displayed along the x-axis. For this series of experiments, the following controls were involved: untreated cells and cells treated with 0.1% PBS solvent were used as negative controls while 1 mM of H2O2 was used a positive control. Each bar denotes an average of three replicates, and the error bars indicate their corresponding standard deviation. For assay data acquisition and analysis purposes, the FL 9 detector, a single-cell gate and Kaluza flow cytometry software (Beckman Coulter) were utilized.
Fig 5
Fig 5. PND provoked DNA migration retardation in a dose-dependent manner.
Three different concentrations of PND and quinacrine were incubated individually with a 100 ng of plasmid DNA and the potential of complex formation was analyzed via agarose gel electrophoresis. Reaction products were separated by 1% agarose gel electrophoresis in Tris/acetate/EDTA buffer and stained with Ethidium bromide. Both PI and free plasmid DNA were used as positive and negative controls of DNA mobility, respectively. The loading wells are located on the top of the image indicated by two blue head arrows (top left and right corners). The yellow dashed line is indicating the maximum mobility of the free supercoiled DNA is included as a reference. Three DNA mobility-shifts are indicated by blue lines and arrows (left side of the image). The migration direction of DNA is indicated by an arrow (right side of the image); from the cathode (negative) to the anode (positive). A representative image used to review the potential formation of DNA complexes is depicted.
Fig 6
Fig 6. Calf Thymus DNA caused a hypochromic and batochromic effect on PND maxima of absorbance.
UV-Visible spectrophotometric titration (300–650 nm) of PND (22.8 μM) in Tris/HCl buffer upon consecutive additions of Calf Thymus (CT) DNA (10.1 mM). The arrow indicates the spectral changes when DNA is added. (B) Summary of the UV-Visible titration data from PND and CT DNA interaction.
Fig 7
Fig 7. PND induced an increase in the intensity of the positive and negative bands of the circular dichroism spectra of Calf Thymus DNA.
Changes in the circular dichroism (CD) spectra of Calf Thymus (CT) DNA as it interacts with PND. CT DNA (150 μM) in Tris/HCl buffer was subjected to CD analysis after 30 min (A) or 20 h (B) of incubation with PND at molar ratios of 0.03, 0.06, 0.2 and 0.3. The arrows specify the CD spectral changes of CT DNA under a gradient of increasing PND concentrations. Blanks of CD spectra with the same gradient of PND concentrations in absence of CT DNA incubated for 20 h (C). Millidegrees = mdegs.

References

    1. Croft S, Duparc S, Arbe-Barnes SJ, Craft JC, Shin CS, Fleckenstein L, et al. Review of pyronaridine anti-malarial properties and product characteristics. Malaria J. 2012; 11(270). - PMC - PubMed
    1. Auparakkitanon S, Chapoomram S, Kuaha K, Chirachariyavej T, Wilairat P. Targeting of hematin by the antimalarial pyronaridine. Antimicrob Agents Chemother. 2006; 50 (6):2197–2200. 10.1128/AAC.00119-06 - DOI - PMC - PubMed
    1. Chavalitshewinkoon P, Wilairat P, Gamage S, Denny W, Figgitt D, Ralph R. Structure-activity relationships and modes of action of 9-anilinoacridines against chloroquine-resistant Plasmodium falciparum in vitro. Antimicrob Agents Chemother. 1993; 37(3):403–406. - PMC - PubMed
    1. Qi J, Wang S, Liu G, Peng H, Wang J, Zhu Z, et al. Pyronaridine, a novel modulator of P-glycoprotein-mediated multidrug resistance in tumor cells in vitro and in vivo. Biochem Biophys Res Commun. 2004; 319(4):1124–1131. 10.1016/j.bbrc.2004.05.099 - DOI - PubMed
    1. Qi J, Yang CZ, Wang CY, Wang SB, Yang M, Wang JH. Function and mechanism of pyronaridine: a new inhibitor of P-glycoprotein-mediated multidrug resistance. Acta Pharmacol Sin. 2002; 23(6):544–550. - PubMed

Publication types

MeSH terms