

Characterization of a B16-F10 melanoma model locally implanted into the ear pinnae of C57BL/6 mice
- PMID: 30395629
- PMCID: PMC6218054
- DOI: 10.1371/journal.pone.0206693
Characterization of a B16-F10 melanoma model locally implanted into the ear pinnae of C57BL/6 mice
Abstract
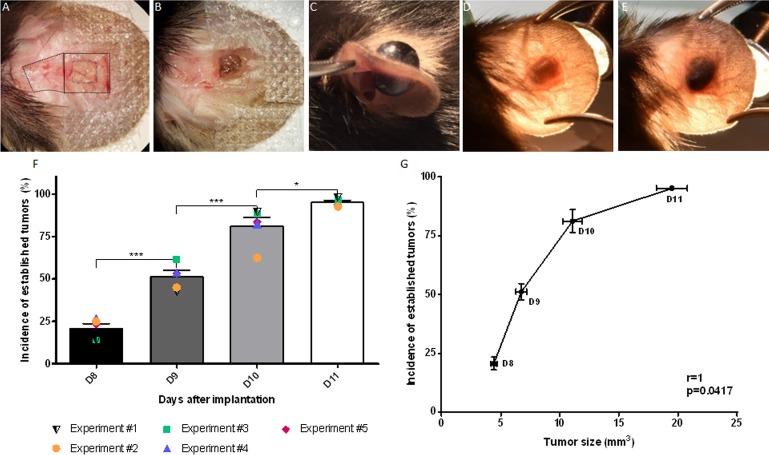
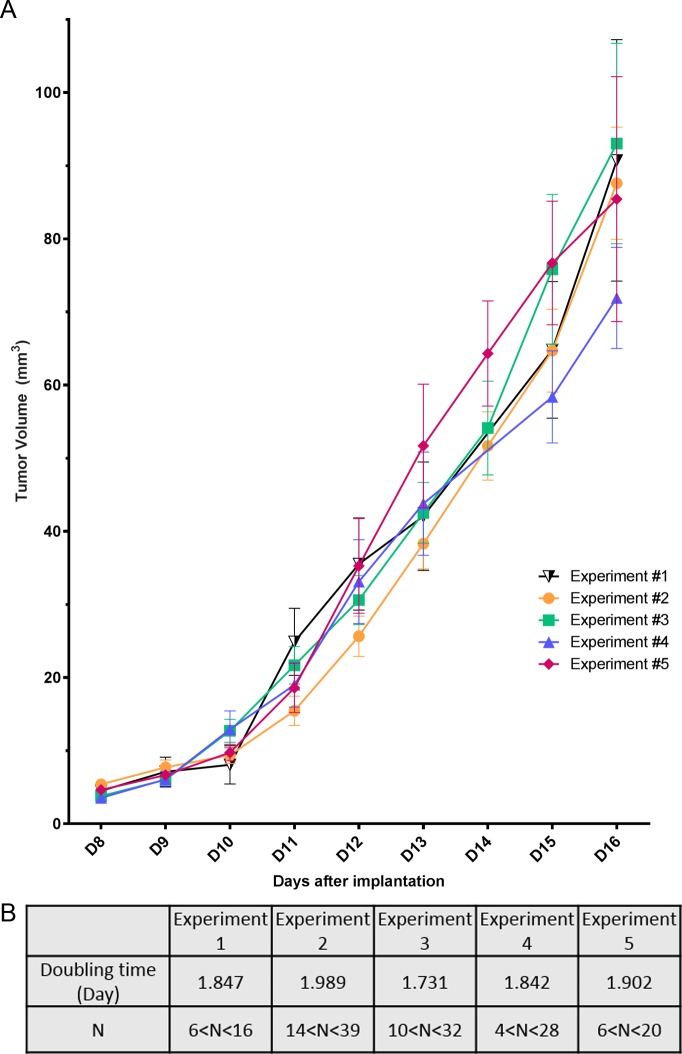
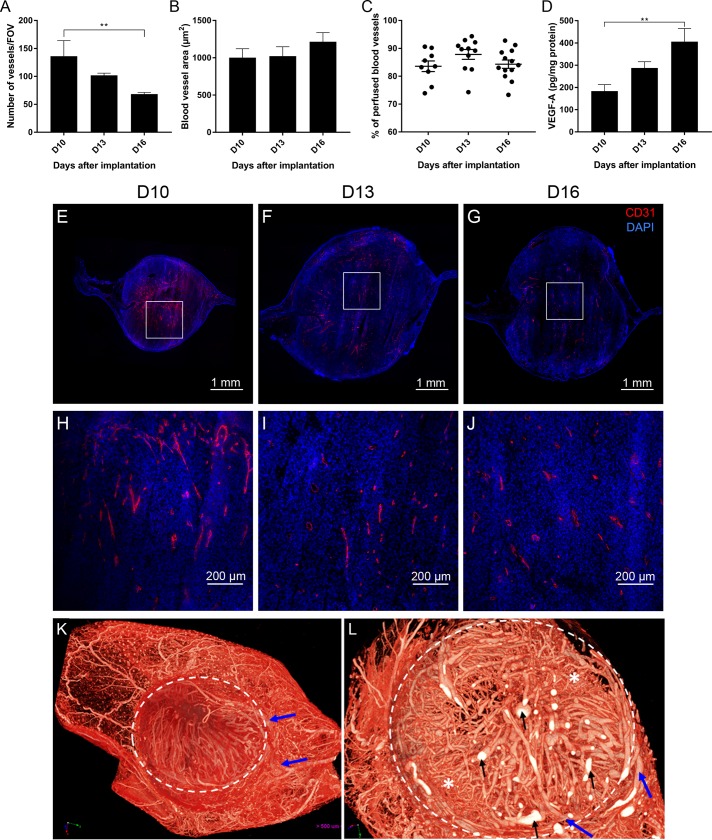
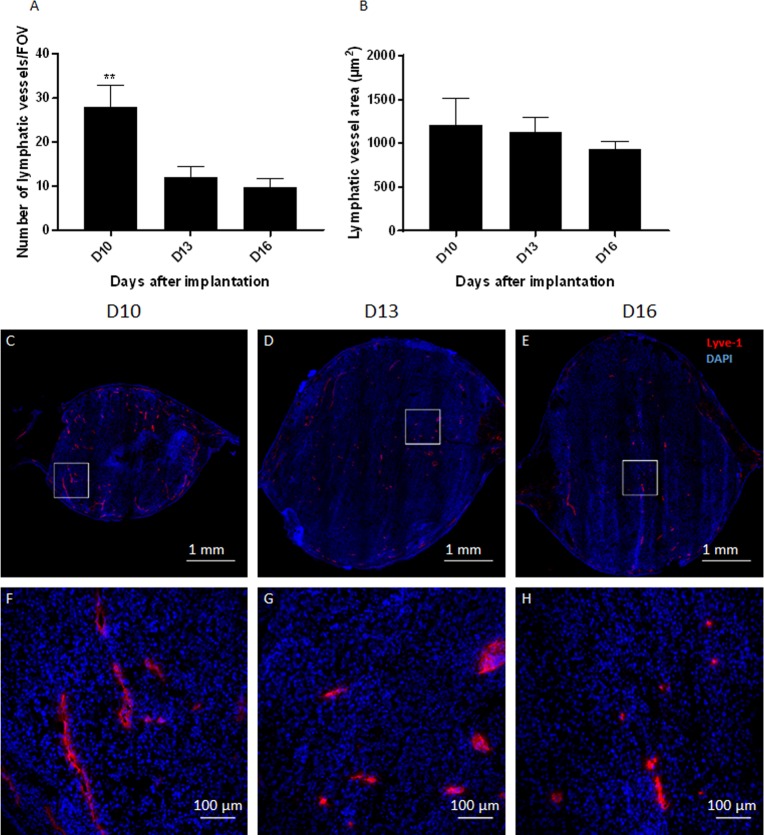
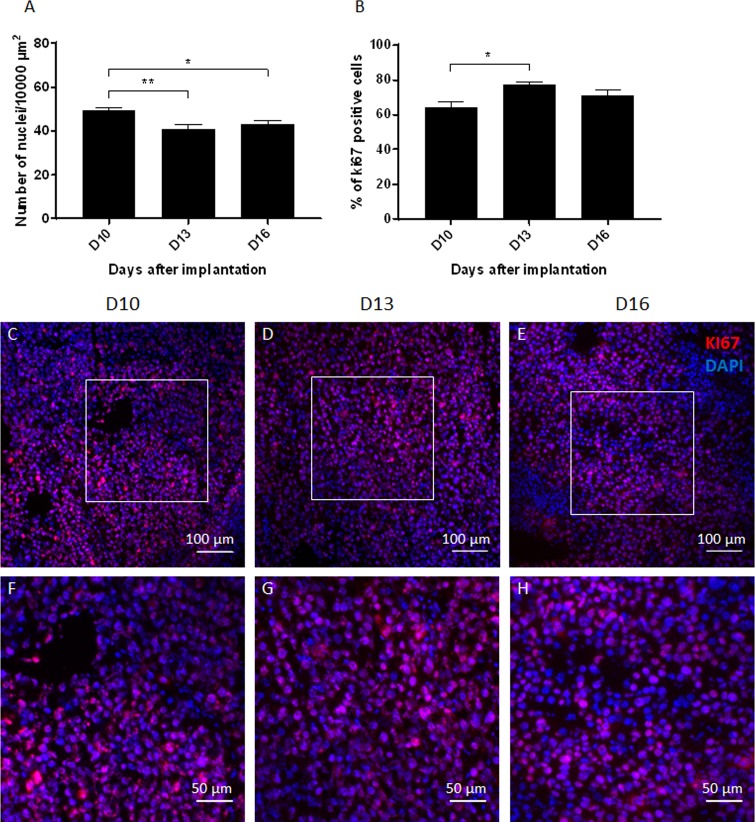
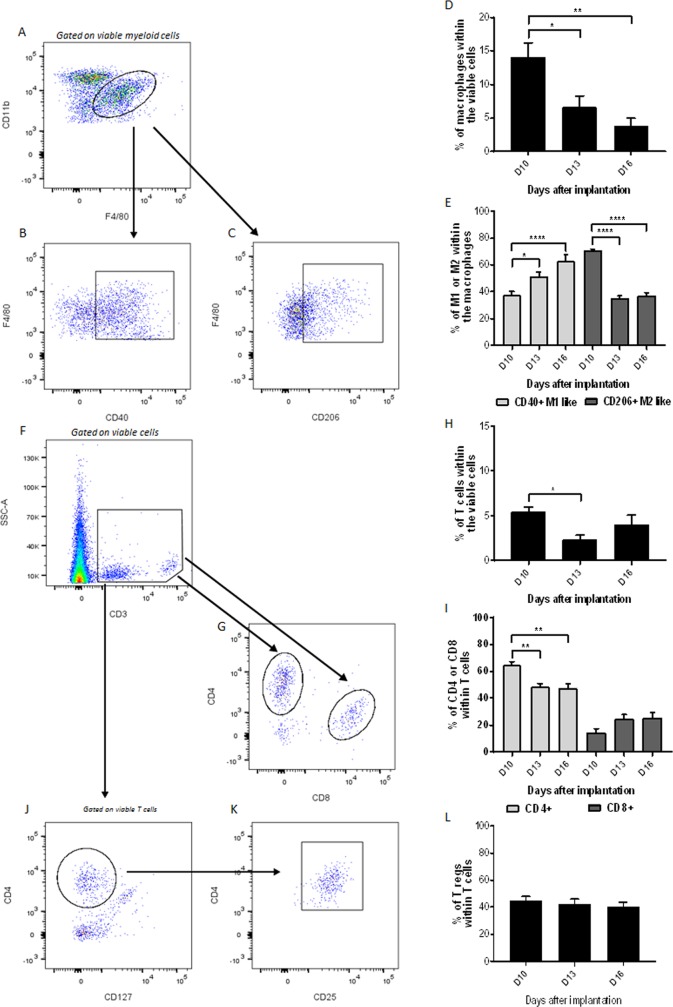
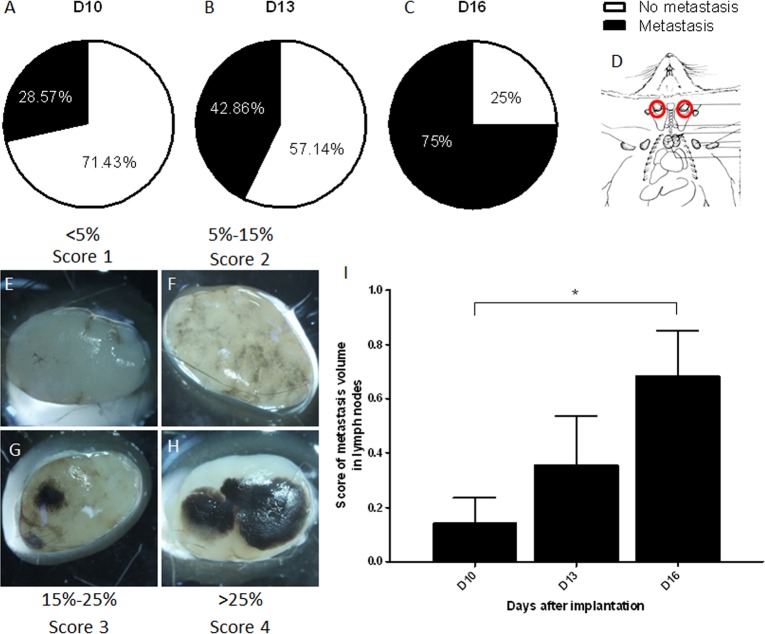
The common experimental use of B16-F10 melanoma cells focuses on exploring their metastatic potential following intravenous injection into mice. In this study, B16-F10 cells are used to develop a primary tumor model by implanting them directly into the ears of C57BL/6J mice. The model represents a reproducible and easily traceable tool for local tumor growth and for making additional in vivo observations, due to the localization of the tumors. This model is relatively simple and involves (i) surgical opening of the ear skin, (ii) removal of a square-piece of cartilage followed by (iii) the implantation of tumor cells with fibrin gel. The remodeling of the fibrin gel within the cartilage chamber, accompanying tumor proliferation, results in the formation of blood vessels, lymphatics and tissue matrix that can be readily distinguished from the pre-existing skin structures. Moreover, this method avoids the injection-enforced artificial spread of cells into the pre-existing lymphatic vessels. The tumors have a highly reproducible exponential growth pattern with a tumor doubling time of around 1.8 days, reaching an average volume of 85mm3 16 days after implantation. The melanomas are densely cellular with proliferative indices of between 60 and 80%. The induced angiogenesis and lymphangiogenesis resulted in the development of well-vascularized tumors. Different populations of immunologically active cells were also present in the tumor; the population of macrophages decreases with time while the population of T cells remained quasi constant. The B16-F10 tumors in the ear frequently metastasized to the cervical lymph nodes, reaching an incidence of 75% by day 16. This newly introduced B16-F10 melanoma model in the ear is a powerful tool that provides a new opportunity to study the local tumor growth and metastasis, the associated angiogenesis, lymphangiogenesis and tumor immune responses. It could potentially be used to test different treatment strategies.
Conflict of interest statement
The authors have declared that no competing interests exist.
Figures
Similar articles
-
Tumors induce coordinate growth of artery, vein, and lymphatic vessel triads.BMC Cancer. 2014 May 21;14:354. doi: 10.1186/1471-2407-14-354. BMC Cancer. 2014. PMID: 24886322 Free PMC article.
-
A clinically relevant, syngeneic model of spontaneous, highly metastatic B16 mouse melanoma.Anticancer Res. 2010 Dec;30(12):4799-803. Anticancer Res. 2010. PMID: 21187455
-
Tumor-induced sentinel lymph node lymphangiogenesis and increased lymph flow precede melanoma metastasis.Am J Pathol. 2007 Feb;170(2):774-86. doi: 10.2353/ajpath.2007.060761. Am J Pathol. 2007. PMID: 17255343 Free PMC article.
-
Angiogenesis and lymphangiogenesis of skin cancers.Hematol Oncol Clin North Am. 2004 Oct;18(5):1059-70, viii. doi: 10.1016/j.hoc.2004.06.009. Hematol Oncol Clin North Am. 2004. PMID: 15474335 Review.
-
The role of innate immune cells in modulating vascular dynamics in skin malignancies.Biochim Biophys Acta Rev Cancer. 2025 Jul;1880(3):189331. doi: 10.1016/j.bbcan.2025.189331. Epub 2025 Apr 23. Biochim Biophys Acta Rev Cancer. 2025. PMID: 40280501 Review.
Cited by
-
Melanization as unfavorable factor in amelanotic melanoma cell biology.Protoplasma. 2021 Sep;258(5):935-948. doi: 10.1007/s00709-021-01613-5. Epub 2021 Jan 27. Protoplasma. 2021. PMID: 33506271 Free PMC article.
-
Interleukin-17 signaling influences CD8+ T cell immunity and tumor progression according to the IL-17 receptor subunit expression pattern in cancer cells.Oncoimmunology. 2023 Oct 5;12(1):2261326. doi: 10.1080/2162402X.2023.2261326. eCollection 2023. Oncoimmunology. 2023. PMID: 37808403 Free PMC article.
-
Intravital Imaging of Adoptive T-Cell Morphology, Mobility and Trafficking Following Immune Checkpoint Inhibition in a Mouse Melanoma Model.Front Immunol. 2020 Jul 22;11:1514. doi: 10.3389/fimmu.2020.01514. eCollection 2020. Front Immunol. 2020. PMID: 32793206 Free PMC article.
-
Investigating Effects of IR-780 in Animal Models of B16-F10 Melanoma: New Approach in Lung Metastasis.Molecules. 2023 Oct 5;28(19):6942. doi: 10.3390/molecules28196942. Molecules. 2023. PMID: 37836787 Free PMC article.
-
Endothelial VEGFR Coreceptors Neuropilin-1 and Neuropilin-2 Are Essential for Tumor Angiogenesis.Cancer Res Commun. 2022 Dec 14;2(12):1626-1640. doi: 10.1158/2767-9764.CRC-22-0250. eCollection 2022 Dec. Cancer Res Commun. 2022. PMID: 36970722 Free PMC article.
References
-
- Giovanella BC, Stehlin JS Jr., Williams LJ Jr., Lee SS, Shepard RC. Heterotransplantation of human cancers into nude mice: a model system for human cancer chemotherapy. Cancer. 1978;42: 2269–2281. Available: http://www.ncbi.nlm.nih.gov/pubmed/719607 - PubMed
-
- Harding HE, Passey RD. A transplantable melanoma of the mouse. J Pathol Bacteriol. John Wiley & Sons, Ltd.; 1930;33: 417–427. 10.1002/path.1700330219 - DOI
Publication types
MeSH terms
LinkOut - more resources
Full Text Sources
Other Literature Sources
Medical
Miscellaneous
