. 2018 Nov 30:9:161-174.
doi: 10.1016/j.isci.2018.10.008. Epub 2018 Oct 15.

Ezh1 Targets Bivalent Genes to Maintain Self-Renewing Stem Cells in Ezh2-Insufficient Myelodysplastic Syndrome

Affiliations

Ezh1 Targets Bivalent Genes to Maintain Self-Renewing Stem Cells in Ezh2-Insufficient Myelodysplastic Syndrome

Kazumasa Aoyama et al. iScience. .

Abstract

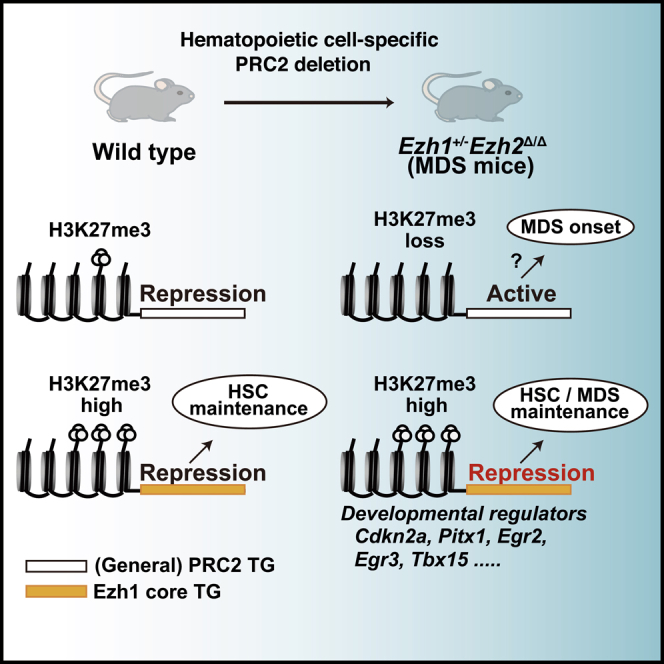
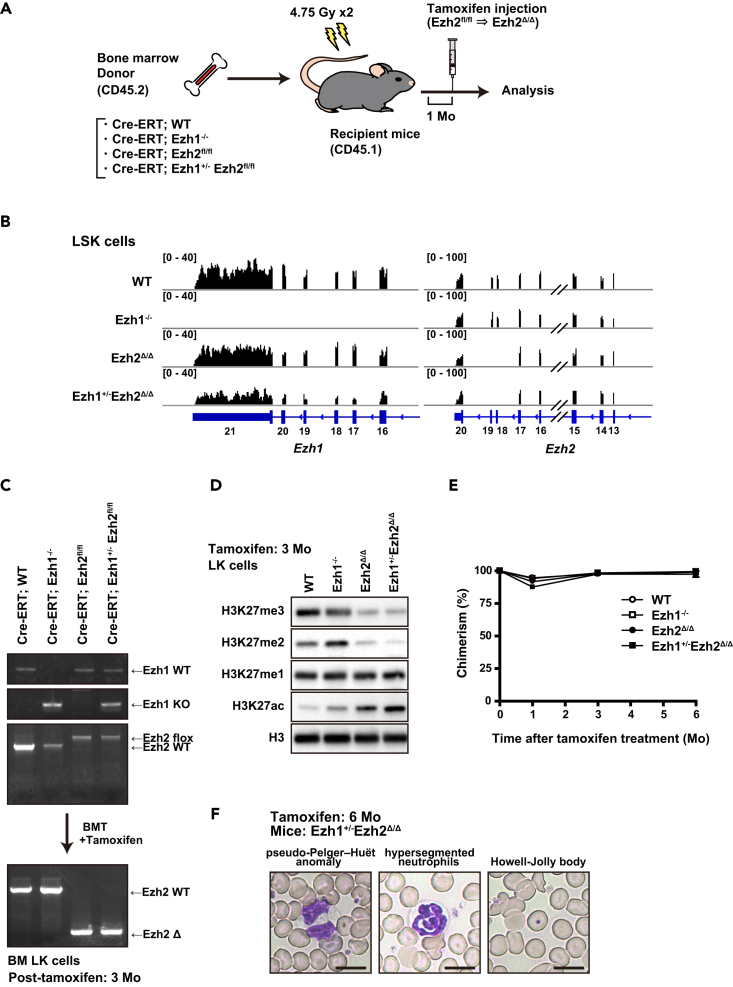
Polycomb repressive complex (PRC) 2 represses transcription through histone H3K27 trimethylation (H3K27me3). We previously reported that the hematopoietic-cell-specific deletion of Ezh2, encoding a PRC2 enzyme, induced myelodysplastic syndrome (MDS) in mice, whereas the concurrent Ezh1 deletion depleted hematopoietic stem and progenitor cells (HSPCs). We herein demonstrated that mice with only one Ezh1 allele (Ezh1+/-Ezh2Δ/Δ) maintained HSPCs. A chromatin immunopreciptation sequence analysis revealed that residual PRC2 preferentially targeted genes with high levels of H3K27me3 and H2AK119 monoubiquitination (H2AK119ub1) in HSPCs (designated as Ezh1 core target genes), which were mostly developmental regulators, and maintained H3K27me3 levels in Ezh1+/-Ezh2Δ/Δ HSPCs. Even upon the complete depletion of Ezh1 and Ezh2, H2AK119ub1 levels were largely retained, and only a minimal number of Ezh1 core targets were de-repressed. These results indicate that genes marked with high levels of H3K27me3 and H2AK119ub1 are the core targets of polycomb complexes in HSPCs as well as MDS stem cells.

Keywords: Biological Sciences; Cell Biology; Developmental Biology; Genetics; Immunology; Molecular Biology.


Figures

None
Graphical abstract
Figure 1
Figure 1
Efficient Deletion of Ezh1 and Ezh2 in Hematopoietic Cells (A) The experimental scheme of BM transplantation (BMT) and hematopoietic-cell-specific deletion of Ezh1 and Ezh2. (B) Snapshots of RNA-seq signals at Ezh1 and Ezh2 gene loci in LinSca-I+c-Kit+ cells (LSK cells) obtained from WT, Ezh1−/−, Ezh2Δ/Δ, and Ezh1+/-Ezh2Δ/Δ recipient mice 3 months (Mo) after the tamoxifen treatment. (C) Genomic PCR on Lin-c-Kit+ cells (LK cells) isolated as described in (B), using the tail genomic DNA of donor mice as control. (D) Western blot analysis of global histone modification levels in hematopoietic progenitor cells (HPCs). LK cells isolated as described in (B) were subjected to a western blot analysis using anti-H3K27me3, H3K27me2, H3K27me1, H3K27ac, and histone H3 antibodies. (E) The chimerism of donor-derived CD45.2+ cells in the PB of recipient mice. (F) Smear preparation of PB from WT and Ezh1+/-Ezh2Δ/Δ mice 6 months after the deletion of Ezh2 observed after May-Giemsa staining. Scale bar, 10 μm.
Figure 2
Figure 2
Ezh1+/-Ezh2Δ/Δ Mice Maintain HSC Functions (A) The experimental scheme of competitive repopulating assays. Two million BM cells (CD45.2) from Cre-ERT, Cre-ERT;Ezh1−/−, Cre-ERT;Ezh2fl/fl, and Cre-ERT;Ezh1+/-Ezh2fl/fl were transplanted into lethally irradiated recipient mice (CD45.1) with 1 × 106 competitor BM cells (CD45.1), and Ezh2 was then deleted by injecting tamoxifen 1 month (Mo) post-transplantation. (B) The chimerism of donor-derived CD45.2+ cells in the PB of recipient mice is shown as the ratio of chimerism values before treatment with tamoxifen (left panel). The chimerism 4 months after the tamoxifen treatment is summarized in a bar graph (right panel). Data are shown as the mean ± SD (WT, n = 4; Ezh1−/−, n = 5; Ezh2Δ/Δ, n = 3; Ezh1+/-Ezh2Δ/Δ, n = 4; Ezh1−/−Ezh2Δ/Δ, n = 4). (C) The experimental scheme of serial BM transplantation (BMT). For secondary transplantation, 5 × 106 BM cells from primary recipient mice 3 months after tamoxifen treatment were transplanted into lethally irradiated secondary recipient mice. (D) A summary of the engraftment rates of donor cells in secondary transplantation. (E) The chimerism of donor-derived CD45.2+ cells in PB in secondary recipients. Data are shown as the mean ± SD (WT, n = 5; Ezh2Δ/Δ, n = 9; Ezh1+/-Ezh2Δ/Δ, n = 5). (F) Genomic PCR of LK cells obtained from WT, Ezh2Δ/Δ, and Ezh1+/-Ezh2Δ/Δ recipient mice 9 months after secondary transplantation. **p < 0.01; and ***p < 0.001.
Figure 3
Figure 3
Profiling of PRC2 Target Genes in Ezh1+/-Ezh2Δ/Δ HSPCs (A) Scatterplots showing the relationship of the fold enrichment values of H3K27me3 ChIP signals against the input signals (ChIP/input) at TSS ± 2.0 kb of RefSeq genes (listed in RefSeq ID) between WT and Ezh1−/−, Ezh2Δ/Δ, or Ezh1+/-Ezh2Δ/Δ LK cells 3 months after the tamoxifen treatment. (B) Bar graph showing the number of H3K27me3 genes that showed ≥ 2-fold enrichment in the level of H3K27me3. (C) Box-and-whisker plots showing the H3K27me3 levels of PRC2 target genes (TG) and Ezh1 core TG in the indicated mice. Boxes represent 25–75 percentile ranges. Vertical lines represent 10–90 percentile ranges. Horizontal bars represent medians. Mean values are indicated by red dots. (D) Venn diagram showing the overlap between H3K27me3 genes in Ezh1+/-Ezh2Δ/Δ LSK cells (Ezh1 core TG) and those in WT, Ezh1−/−, or Ezh2Δ/Δ LSK cells. (E) Heatmap showing the levels of H3K27me3 at the range of TSS ± 10.0 kb.
Figure 4
Figure 4
Characterization of Ezh1 Core Target Genes (A) Gene ontology (GO) analysis of Ezh1 core TG using DAVID Bioinformatics Resources. (B) Pie graph showing the breakdown of Ezh1 core TG. (C) Box-and-whisker plots showing the expression levels of PRC2 TG and Ezh1 core TG in LSK cells 3 months (Mo) after the tamoxifen treatment. Boxes represent 25–75 percentile ranges. Vertical lines represent 10–90 percentile ranges. Horizontal bars represent medians. Mean values are indicated by red dots.
Figure 5
Figure 5
Identification of Responsible Genes Involved in HSC Depletion in PRC2-Null Mice (A) Box-and-whisker plots showing the expression levels of PRC2 TG and Ezh1 core TG in LSK cells 1 week (wk) after the tamoxifen treatment. Boxes represent 25–75 percentile ranges. Vertical lines represent 10–90 percentile ranges. Horizontal bars represent medians. Mean values are indicated by red dots. (B) Scatterplots showing the relationship between H3K27me3 levels in Ezh1+/-Ezh2Δ/Δ LSK cells and fold expression levels of PRC2 TG in DKO relative to Ezh1+/-Ezh2Δ/Δ LSK cells. (C) A quantitative RT-PCR analysis in WT, Ezh1−/−Ezh2Δ/Δ, and DKO LSK cells 1 week after the tamoxifen treatment. mRNA levels were normalized to Hprt1 expression, and relative expression levels are shown as the mean ± SD of triplicate analyses. Cells with expression levels arbitrarily set to 1 are indicated as “1.” ND, not detected. (D and E) Overexpression of selected Ezh1 core TG in WT LSK cells using a lentivirus. Sorted Venus-positive cells were cultured in the presence of SCF and TPO. (D) A quantitative RT-PCR analysis on cells cultured for 10 days. mRNA levels were normalized to Hprt1 expression, and expression levels relative to the control are shown as the mean ± SD of triplicate analyses. (E) Growth of cells overexpressing the indicated genes. Cell numbers are shown as the mean ± SD of triplicate cultures. *p < 0.05; **p < 0.01; ***p < 0.001.
Figure 6
Figure 6
Profiling of H3K4me3 in Ezh1+/-Ezh2Δ/Δ HSPCs (A) Scatterplots showing the relationship of the fold enrichment values (ChIP/input) of H3K27me3 and H3K4me3 at TSS ± 2.0 kb of RefSeq genes. WT, Ezh1−/−, Ezh2Δ/Δ, and Ezh1+/-Ezh2Δ/Δ LSK cells were obtained from mice 3 months after the tamoxifen treatment. Black and gray dots indicate PRC2 TG and others, respectively. (B) Venn diagram showing the overlap between Ezh1 core TG and bivalent genes in WT LSK cells. (C) GO analysis data of Ezh1 core TG overlapping with bivalent genes in (B) using DAVID Bioinformatics Resources. (D) Heatmap showing H3K27me3 and H3K4me3 levels at the range of TSS ± 10.0 kb. (E) Box-and-whisker plots showing H3K4me3 levels. Boxes represent 25–75 percentile ranges. Vertical lines represent 10–90 percentile ranges. Horizontal bars represent medians. Mean values are indicated by red dots. ***p < 0.001.
Figure 7
Figure 7
Involvement of H2AK119ub1 in Repression of Ezh1 Core TG (A) Western blot analysis of global histone modification levels in hematopoietic progenitor cells (HPCs). LK cells obtained from mice 3 months (Mo) or c-Kit+ cells obtained 1 week (wk) after the tamoxifen treatment were subjected to a western blot analysis using anti-H2AK119ub1 and histone H2A antibodies. H2AK119ub1 amounts relative to total H2A are indicated. (B) Scatterplots showing the relationship of the fold enrichment values (ChIP/input) of H3K27me3 and H2AK119ub1 at TSS ± 2.0 kb of RefSeq genes. WT, Ezh1−/−, Ezh2Δ/Δ, and Ezh1+/-Ezh2Δ/Δ LSK cells were obtained from mice 3 months after the tamoxifen treatment. Black and gray dots indicate PRC2 TG and others, respectively. (C) Venn diagram showing the overlap between genes marked with H2AK119ub1 and those with H3K27me3 at their promoters in WT (upper) and Ezh1+/-Ezh2Δ/Δ (lower) LSK cells. (D) Heatmap showing H3K27me3 and H2AK119ub1 levels at the range of TSS ±10.0 kb of PRC2 TG in LSK cells 3 months or c-Kit+ cells 1 week after the tamoxifen treatment. (E) Box-and-whisker plots showing H3K27me3 and H2AK119ub1 levels of PRC2 TG. Boxes represent 25–75 percentile ranges. Vertical lines represent 10–90 percentile ranges. Horizontal bars represent medians. Mean values are indicated by red dots.

References

    1. Bernstein B.E., Mikkelsen T.S., Xie X., Kamal M., Huebert D.J., Cuff J., Fry B., Meissner A., Wernig M., Plath K. A bivalent chromatin structure marks key developmental genes in embryonic stem cells. Cell. 2006;125:315–326. - PubMed
    1. Blackledge N.P., Farcas A.M., Kondo T., King H.W., McGouran J.F., Hanssen L.L., Ito S., Cooper S., Kondo K., Koseki Y. Variant PRC1 complex-dependent H2A ubiquitylation drives PRC2 recruitment and polycomb domain formation. Cell. 2014;157:1445–1459. - PMC - PubMed
    1. Blackledge N.P., Rose N.R., Klose R.J. Targeting Polycomb systems to regulate gene expression: modifications to a complex story. Nat. Rev. Mol. Cell Biol. 2015;16:643–649. - PMC - PubMed
    1. Cheng H., Hao S., Liu Y., Pang Y., Ma S., Dong F., Xu J., Zheng G., Li S., Yuan W. Leukemic marrow infiltration reveals a novel role for Egr3 as a potent inhibitor of normal hematopoietic stem cell proliferation. Blood. 2015;126:1302–1313. - PMC - PubMed
    1. Conway E., Healy E., Bracken A.P. PRC2 mediated H3K27 methylations in cellular identity and cancer. Curr. Opin. Cell Biol. 2015;37:42–48. - PubMed