

Gestational weight gain charts for different body mass index groups for women in Europe, North America, and Oceania
- PMID: 30396358
- PMCID: PMC6217770
- DOI: 10.1186/s12916-018-1189-1
Gestational weight gain charts for different body mass index groups for women in Europe, North America, and Oceania
Abstract
Background: Gestational weight gain differs according to pre-pregnancy body mass index and is related to the risks of adverse maternal and child health outcomes. Gestational weight gain charts for women in different pre-pregnancy body mass index groups enable identification of women and offspring at risk for adverse health outcomes. We aimed to construct gestational weight gain reference charts for underweight, normal weight, overweight, and grades 1, 2 and 3 obese women and to compare these charts with those obtained in women with uncomplicated term pregnancies.
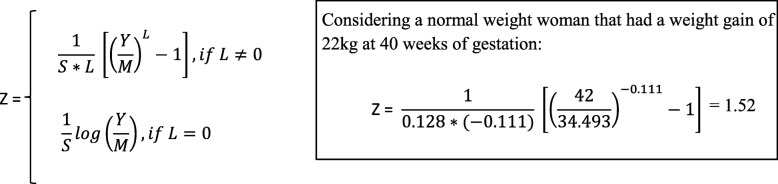
Methods: We used individual participant data from 218,216 pregnant women participating in 33 cohorts from Europe, North America, and Oceania. Of these women, 9065 (4.2%), 148,697 (68.1%), 42,678 (19.6%), 13,084 (6.0%), 3597 (1.6%), and 1095 (0.5%) were underweight, normal weight, overweight, and grades 1, 2, and 3 obese women, respectively. A total of 138, 517 women from 26 cohorts had pregnancies with no hypertensive or diabetic disorders and with term deliveries of appropriate for gestational age at birth infants. Gestational weight gain charts for underweight, normal weight, overweight, and grade 1, 2, and 3 obese women were derived by the Box-Cox t method using the generalized additive model for location, scale, and shape.
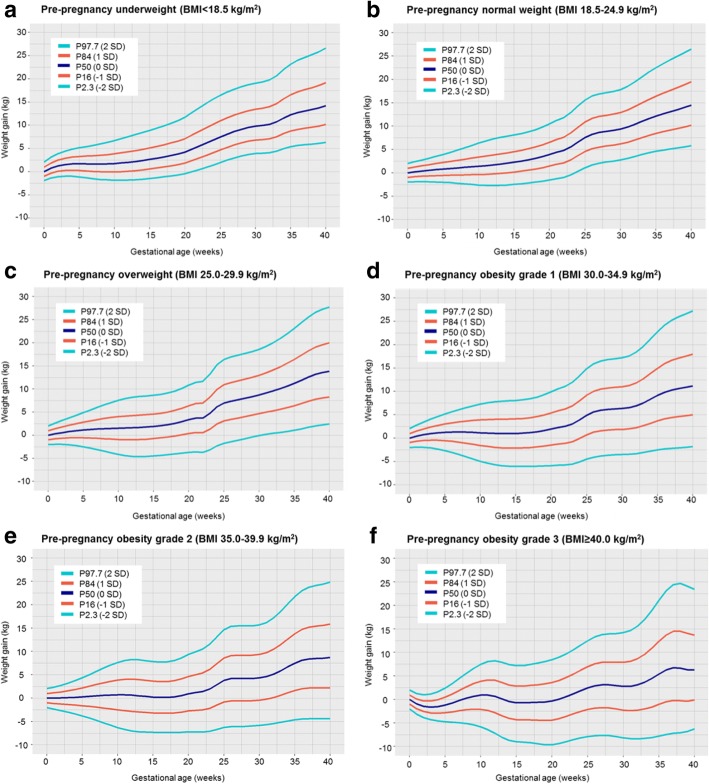
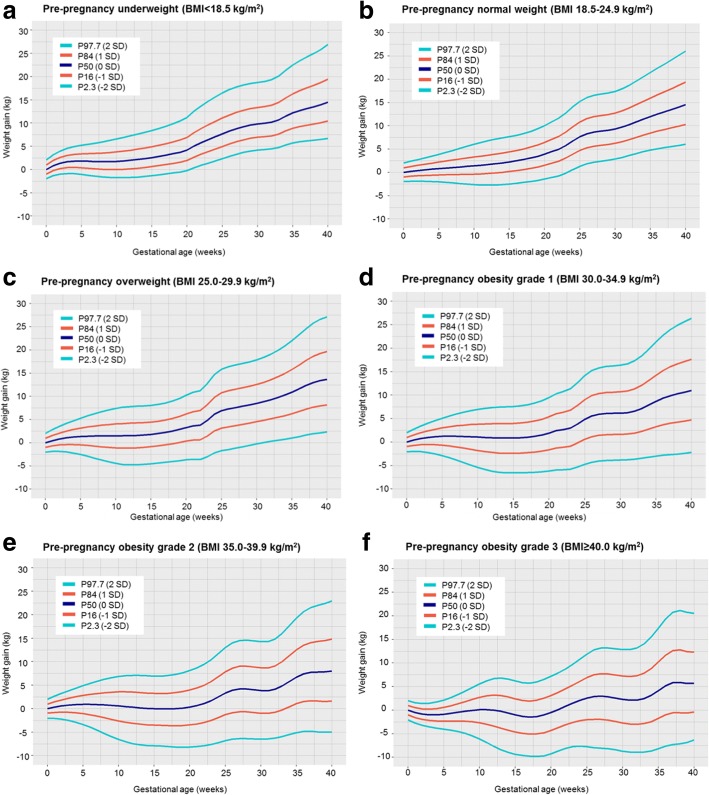
Results: We observed that gestational weight gain strongly differed per maternal pre-pregnancy body mass index group. The median (interquartile range) gestational weight gain at 40 weeks was 14.2 kg (11.4-17.4) for underweight women, 14.5 kg (11.5-17.7) for normal weight women, 13.9 kg (10.1-17.9) for overweight women, and 11.2 kg (7.0-15.7), 8.7 kg (4.3-13.4) and 6.3 kg (1.9-11.1) for grades 1, 2, and 3 obese women, respectively. The rate of weight gain was lower in the first half than in the second half of pregnancy. No differences in the patterns of weight gain were observed between cohorts or countries. Similar weight gain patterns were observed in mothers without pregnancy complications.
Conclusions: Gestational weight gain patterns are strongly related to pre-pregnancy body mass index. The derived charts can be used to assess gestational weight gain in etiological research and as a monitoring tool for weight gain during pregnancy in clinical practice.
Keywords: Charts; Pregnancy; References; Weight gain.
Conflict of interest statement
Ethics approval and consent to participate
Cohorts were approved by their local institutional ethical review boards (information per cohort is given in Additional file 1: Table S10) and consent to participate was obtained from participants.
Consent for publication
Not applicable.
Competing interests
Keith M. Godfrey has received reimbursement for speaking at conferences sponsored by companies selling nutritional products and is part of an academic consortium that has received research funding from Abbott Nutrition, Nestec, and Danone. Debbie A. Lawlor has received support from Roche Diagnostics and Medtronic in relation to biomarker research that is not related to the research presented in this paper. Andrea von Berg has received reimbursement for speaking at symposia sponsored by Nestlé and Mead Johnson, who partly financially supported the 15 years follow-up examination of the GINIplus study. The rest of the authors reported no conflicts of interest.
Publisher’s Note
Springer Nature remains neutral with regard to jurisdictional claims in published maps and institutional affiliations.
Figures
References
-
- Institute of Medicine (US) and National Research Council (US) Committee to Reexamine IOM Pregnancy Weight Guidelines . In: Weight gain during pregnancy: Reexamining the Guidelines. Rasmussen KM, Yaktine AL, editors. Washington, DC: National Academies Press (US); 2009. - PubMed
Publication types
MeSH terms
Grants and funding
- RG/15/17/31749/BHF_/British Heart Foundation/United Kingdom
- R03 TW007152/TW/FIC NIH HHS/United States
- TPR 15-230/HX/HSRD VA/United States
- MC_U147574226/MRC_/Medical Research Council/United Kingdom
- U01 NS047537/NS/NINDS NIH HHS/United States
- K12 ES019852/ES/NIEHS NIH HHS/United States
- P30 ES023513/ES/NIEHS NIH HHS/United States
- MC_UP_A620_1017/MRC_/Medical Research Council/United Kingdom
- R01 CA096525/CA/NCI NIH HHS/United States
- MC_U147574222/MRC_/Medical Research Council/United Kingdom
- R01 ES015282/ES/NIEHS NIH HHS/United States
- R01 ES010165/ES/NIEHS NIH HHS/United States
- P30 ES001247/ES/NIEHS NIH HHS/United States
- UG3 OD023286/OD/NIH HHS/United States
- WT_/Wellcome Trust/United Kingdom
- MC_UU_12013/5/MRC_/Medical Research Council/United Kingdom
- MC_UU_12011/4/MRC_/Medical Research Council/United Kingdom
- R01 DK103246/DK/NIDDK NIH HHS/United States
- 102215/2/13/2/WT_/Wellcome Trust/United Kingdom
- MOP 115071/CIHR/Canada
- N01 ES075558/ES/NIEHS NIH HHS/United States
- R01 HD034568/HD/NICHD NIH HHS/United States
- MR/J000094/1/MRC_/Medical Research Council/United Kingdom
