. 2018 Nov 5;6(1):117.
doi: 10.1186/s40478-018-0614-1.

Transcriptomic and epigenetic profiling of 'diffuse midline gliomas, H3 K27M-mutant' discriminate two subgroups based on the type of histone H3 mutated and not supratentorial or infratentorial location

Affiliations

Transcriptomic and epigenetic profiling of 'diffuse midline gliomas, H3 K27M-mutant' discriminate two subgroups based on the type of histone H3 mutated and not supratentorial or infratentorial location

David Castel et al. Acta Neuropathol Commun. .

Abstract

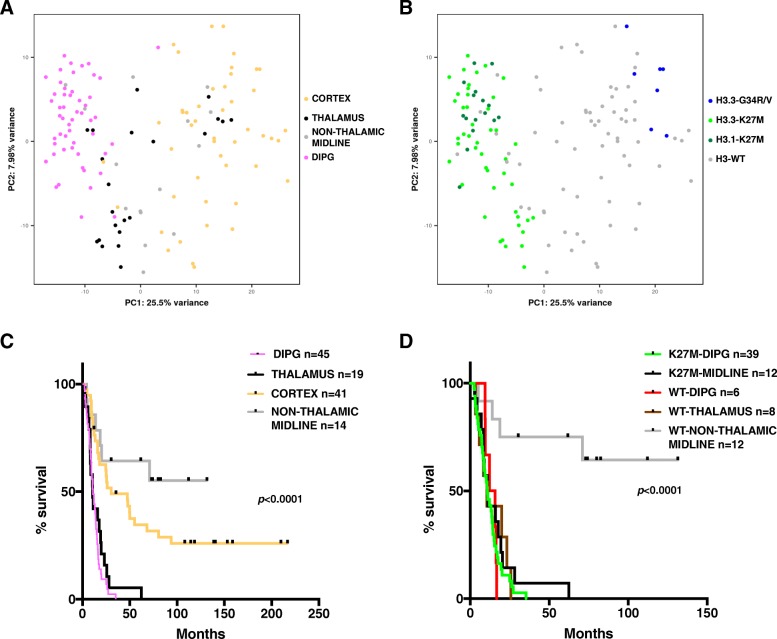
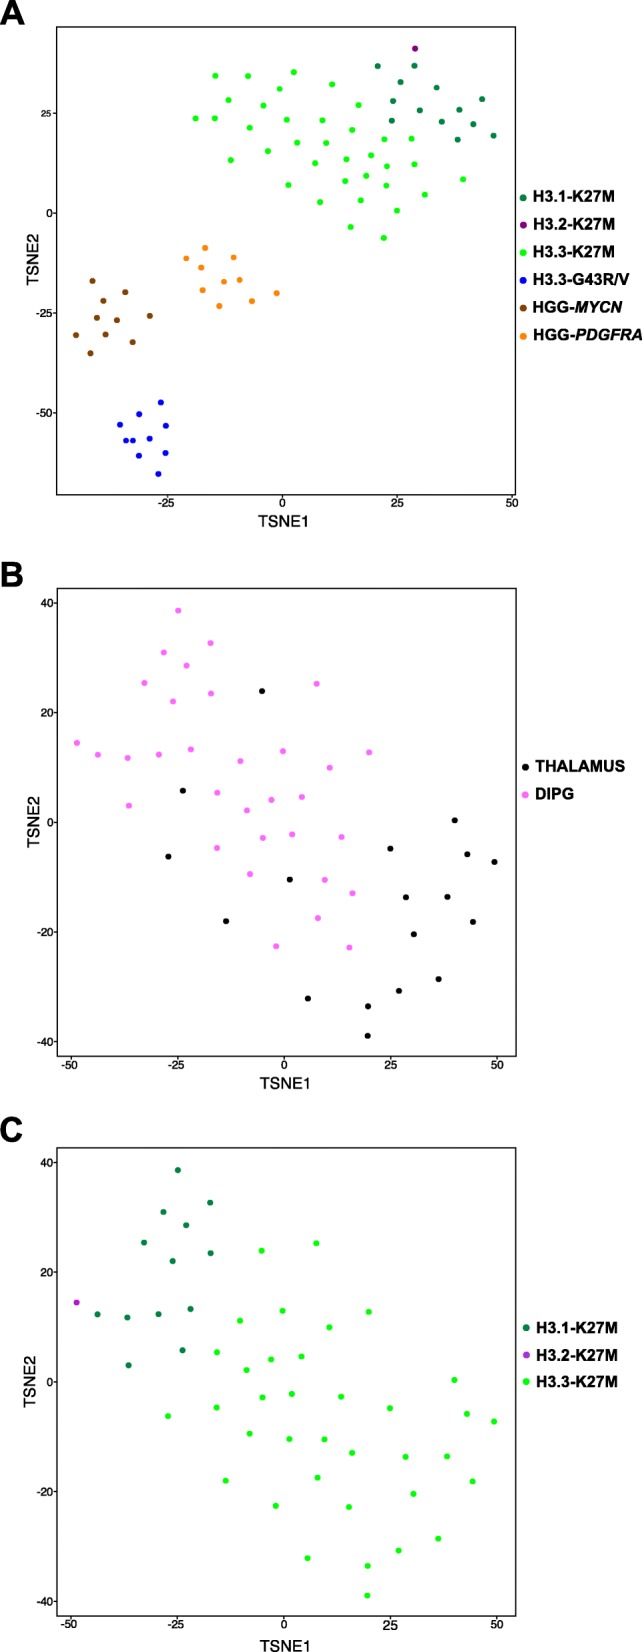
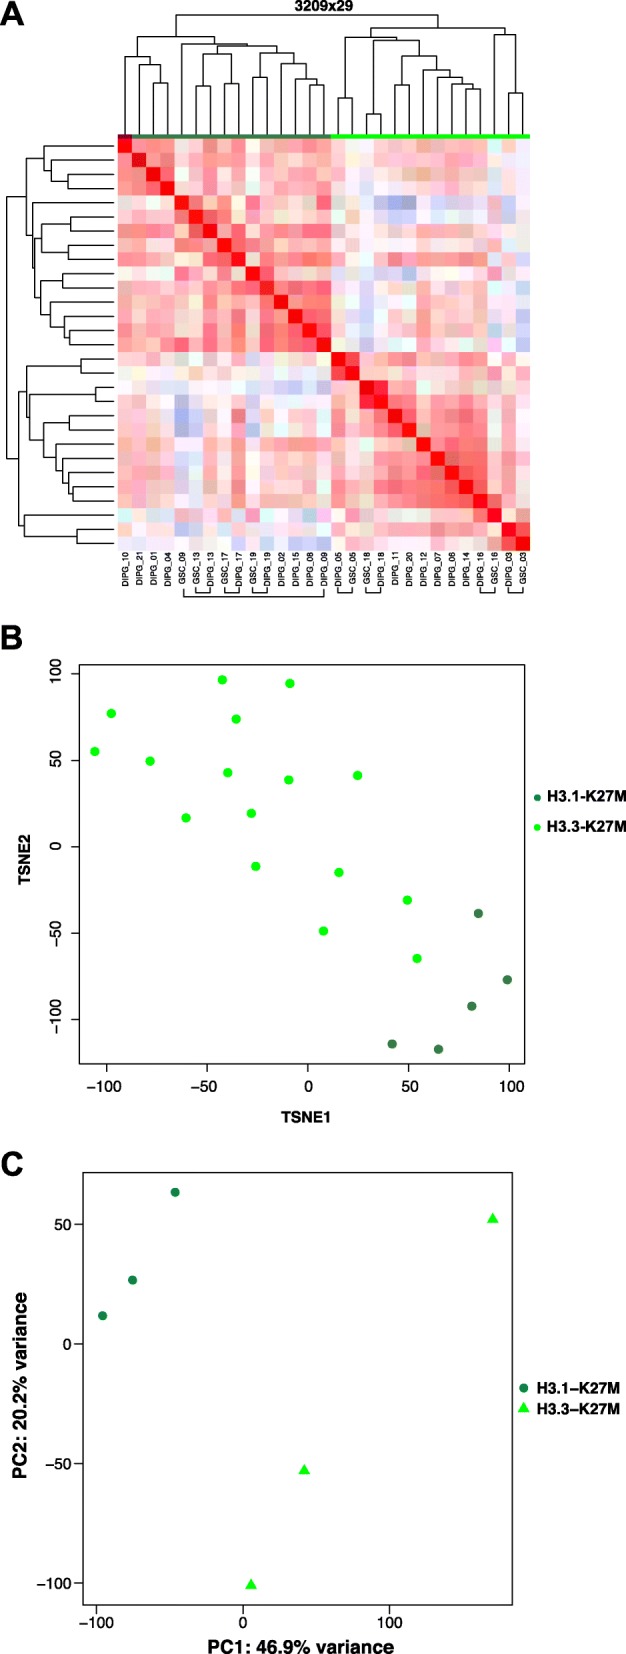
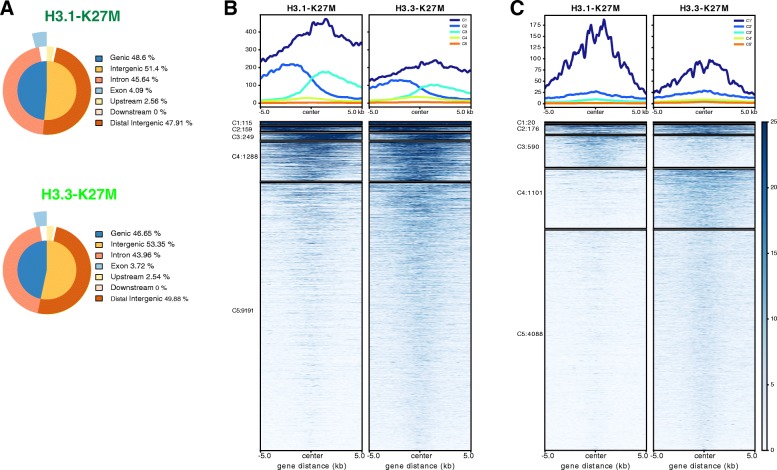
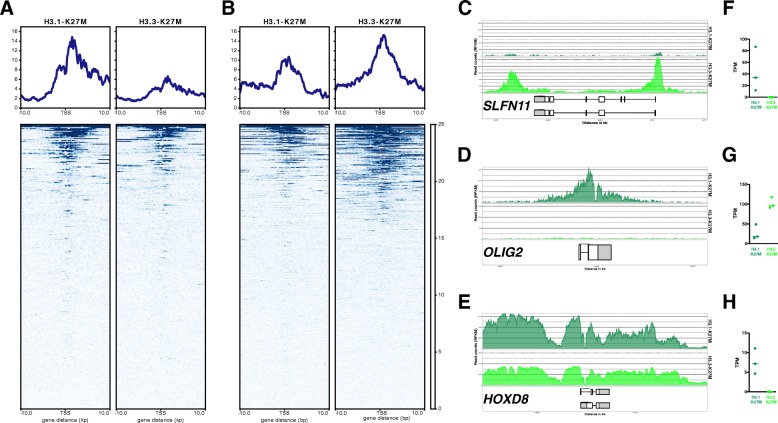
Diffuse midline glioma (DMG), H3 K27M-mutant, is a new entity in the updated WHO classification grouping together diffuse intrinsic pontine gliomas and infiltrating glial neoplasms of the midline harboring the same canonical mutation at the Lysine 27 of the histones H3 tail.Two hundred and fifteen patients younger than 18 years old with centrally-reviewed pediatric high-grade gliomas (pHGG) were included in this study. Comprehensive transcriptomic (n = 140) and methylation (n = 80) profiling was performed depending on the material available, in order to assess the biological uniqueness of this new entity compared to other midline and hemispheric pHGG.Tumor classification based on gene expression (GE) data highlighted the similarity of K27M DMG independently of their location along the midline. T-distributed Stochastic Neighbor Embedding (tSNE) analysis of methylation profiling confirms the discrimination of DMG from other well defined supratentorial tumor subgroups. Patients with diffuse intrinsic pontine gliomas (DIPG) and thalamic DMG exhibited a similarly poor prognosis (11.1 and 10.8 months median overall survival, respectively). Interestingly, H3.1-K27M and H3.3-K27M primary tumor samples could be distinguished based both on their GE and DNA methylation profiles, suggesting that they might arise from a different precursor or from a different epigenetic reorganization.These differences in DNA methylation profiles were conserved in glioma stem-like cell culture models of DIPG which mimicked their corresponding primary tumor. ChIP-seq profiling of H3K27me3 in these models indicate that H3.3-K27M mutated DIPG stem cells exhibit higher levels of H3K27 trimethylation which are correlated with fewer genes expressed by RNAseq. When considering the global distribution of the H3K27me3 mark, we observed that intergenic regions were more trimethylated in the H3.3-K27M mutated cells compared to the H3.1-K27M mutated ones.H3 K27M-mutant DMG represent a homogenous group of neoplasms compared to other pediatric gliomas that could be further separated based on the type of histone H3 variant mutated and their respective epigenetic landscapes. As these characteristics drive different phenotypes, these findings may have important implication for the design of future trials in these specific types of neoplasms.

Keywords: DNA methylation profiling; Diffuse intrinsic pontine glioma; Diffuse midline glioma; Epigenetics; Gene expression profiling; Glioma stem cell; H3 K27M-mutant; H3K27me3 landscape; Pediatric high-grade glioma.


Conflict of interest statement

Ethics approval and consent to participate

Informed consent for the translational research program was obtained from the parents or guardian according to the Institutional Review Board approved protocol (DC-2009- 955).

Consent for publication

Not applicable.

Competing interests

The authors declare that they have no competing interests.

Publisher’s Note

Springer Nature remains neutral with regard to jurisdictional claims in published maps and institutional affiliations.

Figures

Fig. 1
Fig. 1
Gene-expression based classification of high-grade gliomas and corresponding survival analyses. Principal component analysis of microarray GE profiling of 119 high-grade gliomas. In total, 131 data points are represented as 11 samples were duplicated allowing to monitor the batch effect correction. The genes associated with the highest standard deviation were selected (n = 120 genes) for the analysis and the tumors were color-coded according to their location (a) or mutational histone H3 status (b). Four groups were defined in the upper left panel corresponding to cortical (yellow), thalamic (black), pontine (pink) and non-thalamic midline (grey) glioma. In the right panel, the samples were divided in 4 subgroups according to the mutational status of histone H3 genes: H3.3-G34R (blue), H3.3-K27M (light green), H3.1-K27M (dark green) mutated tumors and tumors without any alteration of either H3F3A, HIST1H3B and HIST2H3A genes (grey). c Kaplan–Meier of the overall survival of patients with a high-grade glioma stratified by their location. DIPG (green) and thalamic (black) tumors are associated with the shortest overall survival (median of 11.1 months and 10.8 months respectively). The midline tumors (grey) which are located outside the thalamus show the most favorable prognosis. The subgroup of cortical tumors (yellow) shows an intermediate phenotype (median survival 30.5 months). Log rank test p-value < 0.0001. d Kaplan–Meier survival curves of patients with a midline HGG stratified by both tumor location and H3-K27 mutational status. The overall survival is rather similar for all tumor subgroups (overall median survival about 10.8, 13.86, 10.02, 10.5 months for K27M DIPG, WT DIPG, K27M midline, WT thalamus, respectively) except for the WT non-thalamic midline tumors presenting a much better prognosis. Log rank test p-value < 0.0001
Fig. 2
Fig. 2
Classification of high-grade gliomas based on genome-wide DNA methylation profiles. a t-SNE analysis of the methylation profiles of 80 pediatric high-grade gliomas using the topmost differentially methylated probes across the sample set (s.d. > 0.25). Midline tumors are color-coded according to the histone H3 gene mutated: dark green for H3.1-K27M (n = 13), purple for H3.2-K27M (n = 1) and light green for H3.3-K27M tumors (n = 36). Others H3-WT high-grade glioma are also presented: H3.3-G34R mutated tumors (n = 10, blue), PDGFRA (n = 10, orange) and MYCN (n = 10, brown) amplified tumors. b-c Analysis of methylation patterns of 50 pediatric H3-K27M midline tumors by t-SNE indicates that H3.1-K27M and H3.3-K27M tumors are clearly distinct from each other. Dimensionality reduction and visualization of methylome data was performed by t-SNE after selection of the probes with the greatest variance (n = 10,000; See Methods). Samples were color-coded according to their location (b), the histone H3 gene mutated (c). t-SNE show two main clusters corresponding to H3.1/H3.2-K27M and H3.3-K27M subgrouping
Fig. 3
Fig. 3
Subclassification of DIPG based on RNA-seq, methylome and H3K27me3 epigenetic profiles. a Heatmap and hierarchical clustering of the Pearson correlation matrix of 19 DIPG and 8 matched GSC cultures (H3.3-K27M and H3.1-K27M in light and dark green respectively) across 3209 probes used for DNA methylation measurements. b t-SNE analysis of RNA-seq data in DIPG. RNA sequencing of 21 DIPG samples was performed and the genes associated with the highest standard deviation (n = 250) were selected to conduct t-SNE analysis. The tumors were color-coded according to histone H3 mutated, i.e. H3.3-K27M in light green and H3.1-K27M in dark green. c Principal component analysis of 3 H3.1- and 3 H3.3-K27M GSC models of DIPG based on H3K27me3 epigenetic mark profiling (n = 16,977 genomic intervals)
Fig. 4
Fig. 4
Distribution of H3K27me3 epigenetic marks in in vitro models of DIPG. a Genome distribution of H3K27me3 peaks in H3.1- and H3.3-K27M GSC cells. Pie-charts represent the genomic annotation of the genomic loci bound by H3.3K27me3 in each subgroup performed using ChIPseeker package. The majority of the H3K27me3 occupied regions are located within the distal intergenic regions, and a small number of peaks are located in upstream regions. The percentage of each feature in H3.1- and H3.3-K27M subgroups is indicated in the legend. b-c H3K27me3 levels in overlapping (b) or non-overlapping (c) gene regions of 10 kb were normalized to equivalent total number of tags in the samples (in columns), and genomic intervals were subsequently clustered by k-means (k = 5). Left and right borders represent − 5 kb and + 5 kb, respectively. Blue color scale bar indicates relative coverage. Average signal of all H3K27me3 peak regions of each cluster is presented at the top. The number of genomic loci in each cluster is indicated in the legend
Fig. 5
Fig. 5
a-b H3K27me3 ChIP-seq signal at promoter regions of upregulated (a) and downregulated (b) genes between H3.1- and H3.3-K27M GSCs (adjusted p-value < 0.01). The average occupancy is centered on TSS and extended 10 kb upstream and downstream (− 10 kb and + 10 kb, respectively). Blue color scale bar indicates relative coverage. c-e H3K27me3 levels found at the loci of selected genes showing increased (OLIG2 and HOXD8) or decreased (SLFN11) mark deposition in H3.1-K27M. Read coverage around the genes of interest is represented in RPKM and gene structure from Ensembl database is shown below. f-h Expression level in tpm of OLIG2, SLFN11 and HOXD8 measured by RNA-seq in GSCs

References

    1. Castel D, Grill J, Debily M-A. Histone H3 genotyping refines clinico-radiological diagnostic and prognostic criteria in DIPG. Acta Neuropathol. 2016;131:795–796. doi: 10.1007/s00401-016-1568-7. - DOI - PMC - PubMed
    1. Castel D, Philippe C, Calmon R, Le Dret L, Truffaux N, Boddaert N, Pagès M, Taylor KR, Saulnier P, Lacroix L, Mackay A, Jones C, Sainte-Rose C, Blauwblomme T, Andreiuolo F, Puget S, Grill J, Varlet P, Debily M-A. Histone H3F3A and HIST1H3B K27M mutations define two subgroups of diffuse intrinsic pontine gliomas with different prognosis and phenotypes. Acta Neuropathol. 2015;130:815–827. doi: 10.1007/s00401-015-1478-0. - DOI - PMC - PubMed
    1. Cohen KJ, Jabado N, Grill J. Diffuse intrinsic pontine gliomas-current management and new biologic insights. Is there a glimmer of hope? Neuro-Oncology. 2017;19:1025–1034. doi: 10.1093/neuonc/nox021. - DOI - PMC - PubMed
    1. Eisenstat DD, Pollack IF, Demers A, Sapp MV, Lambert P, Weisfeld-Adams JD, Burger PC, Gilles F, Davis RL, Packer R, Boyett JM, Finlay JL. Impact of tumor location and pathological discordance on survival of children with midline high-grade gliomas treated on Children’s Cancer Group high-grade glioma study CCG-945. J Neuro-Oncol. 2015;121:573–581. doi: 10.1007/s11060-014-1669-x. - DOI - PMC - PubMed
    1. ENCODE Project Consortium. Bernstein BE, Birney E, Dunham I, Green ED, Gunter C, Snyder M. An integrated encyclopedia of DNA elements in the human genome. Nature. 2012;489:57–74. doi: 10.1038/nature11247. - DOI - PMC - PubMed

Publication types

MeSH terms