

Pentraxin 3 regulates synaptic function by inducing AMPA receptor clustering via ECM remodeling and β1-integrin
- PMID: 30396995
- PMCID: PMC6315291
- DOI: 10.15252/embj.201899529
Pentraxin 3 regulates synaptic function by inducing AMPA receptor clustering via ECM remodeling and β1-integrin
Abstract
Control of synapse number and function in the developing central nervous system is critical to the formation of neural circuits. Astrocytes play a key role in this process by releasing factors that promote the formation of excitatory synapses. Astrocyte-secreted thrombospondins (TSPs) induce the formation of structural synapses, which however remain post-synaptically silent, suggesting that completion of early synaptogenesis may require a two-step mechanism. Here, we show that the humoral innate immune molecule Pentraxin 3 (PTX3) is expressed in the developing rodent brain. PTX3 plays a key role in promoting functionally-active CNS synapses, by increasing the surface levels and synaptic clustering of AMPA glutamate receptors. This process involves tumor necrosis factor-induced protein 6 (TSG6), remodeling of the perineuronal network, and a β1-integrin/ERK pathway. Furthermore, PTX3 activity is regulated by TSP1, which directly interacts with the N-terminal region of PTX3. These data unveil a fundamental role of PTX3 in promoting the first wave of synaptogenesis, and show that interplay of TSP1 and PTX3 sets the proper balance between synaptic growth and synapse function in the developing brain.
Keywords: AMPARs; PTX3; astrocyte; synapse; thrombospondin.
© 2018 The Authors. Published under the terms of the CC BY NC ND 4.0 license.
Figures
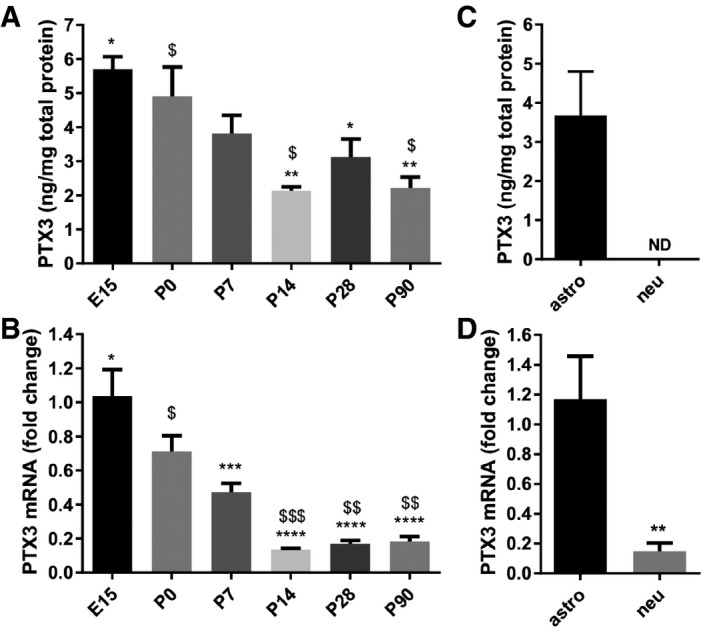
- A, B
(A) ELISA assay and (B) real‐time qPCR from brain lysates showing higher PTX3 expression in late embryonic and early postnatal brain, and lower in the adult brain. Data are presented as mean ± SEM. (A) ng PTX3/mg of total proteins, E15 = 5.702 ± 0.365, P0 = 4.904 ± 0.865, P7 = 3.818 ± 0.530, P14 = 2.140 ± 0.107, P28 = 3.125 ± 0.525, P90 = 2.212 ± 0.324. One‐way ANOVA followed by post hoc Tukey test: E15 vs. P14 **P = 0.001, E15 vs. P28 *P = 0.022, E15 vs. P90 **P = 0.002; P0 vs. P14 $ P = 0.013, P0 vs. P90 $ P = 0.016; four animals for each time point. (B) qPCR fold change normalized on E15, E15 = 1.037 ± 0.154, P0 = 0.711 ± 0.094, P7 = 0.472 ± 0.0524, P14 = 0.135 ± 0.007, P28 = 0.168 ± 0.020, P90 = 0.183 ± 0.029. One‐way ANOVA followed by post hoc Tukey test: E15 vs. P7 ***P = 0.0001, E15 vs. P14 ****P < 0.0001, E15 vs. P28 ****P < 0.0001, E15 vs. P90 ****P < 0.0001; P0 vs. P14 $$$ P = 0.0007, P0 vs. P28 $$ P = 0.001, P0 vs. P90 $$ P = 0.002; four animals for each time point.
- C, D
Quantitation of PTX3 levels in pure astrocyte and neuronal cultures. (C) ELISA assay performed on astrocyte and neuronal culture medium and (D) real‐time qPCR performed on astrocyte and neuronal lysates. Only astrocytes release PTX3 (ELISA, astro = 3.699 ± 1.129, neu = N.D., not detectable. Three independent astrocyte cultures evaluated. qPCR astro = 1.167 ± 0.288; neu = 0.148 ± 0.057; Mann–Whitney test **P = 0.0095. Two independent neuronal cultures evaluated. Data are presented as mean ± SEM.
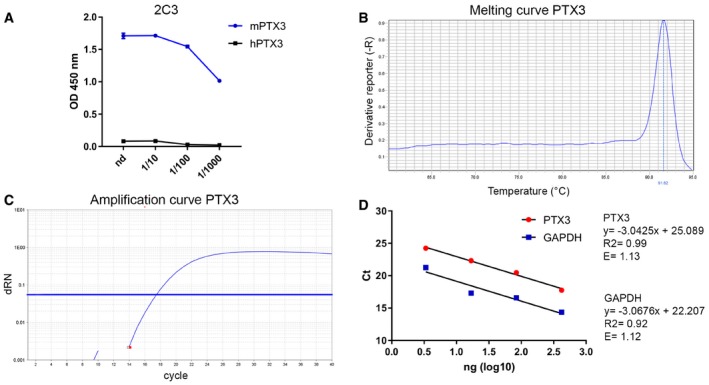
- A
The specificity of the PTX3 ELISA was tested using different dilutions of 2C3 antibody to measure immobilized murine and human PTX3. Purified recombinant murine and human PTX3 were immobilized in 96‐well ELISA plates, and then, different dilutions of 2C3 were added. The graph shows dose–response of 2C3 on immobilized murine or human PTX3. Human PTX3 was not detected by 2C3 antibody.
- B–D
Evaluation of the amplification efficiency of real‐time RT–PCR assay designed for PTX3 expression in astrocyte cell cultures. (B, C) Melting curve and amplification plot of PTX3 RT–qPCR assay. (D) Standard curves of PTX3 and GAPDH, used as reference mRNA, obtained using fivefold serial dilutions of the cDNA (420, 84, 16.8, 3.36 ng). The threshold cycle (C t) values (y‐axis) are plotted against log10 values of cDNA input amounts (x‐axis). The graphs are parallel lines and the calculated efficiencies (E) are, respectively, of 1.13 and 1.12 from a y‐slope of −3.04 and −3.07 and a correlation coefficient (R 2) > 0.9.
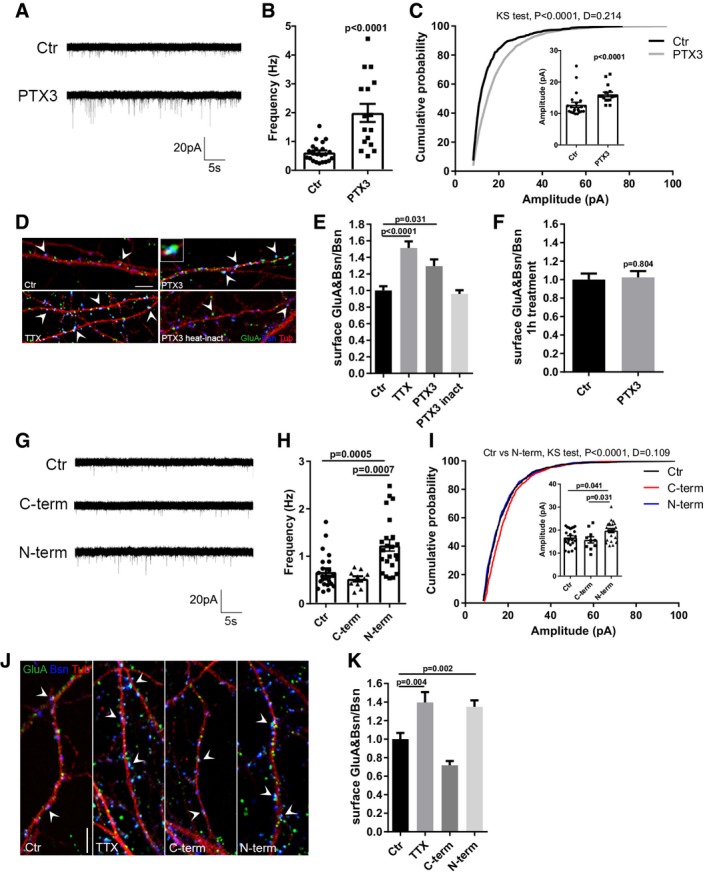
Representative mEPSC traces recorded from control and PTX3‐treated (1 μg/ml; 48 h) neurons.
mEPSC frequency quantitation (Hz, Ctr = 0.618 ± 0.069; PTX3 = 1.991 ± 0.313; number of neurons: Ctr = 22, PTX3 = 16; three independent experiments, Mann–Whitney test, data are presented as a distribution plus mean ± SEM).
mEPSC amplitude quantitation and cumulative probability distribution of mEPSC amplitudes (pA, Ctr = 12.76 ± 0.813; PTX3 = 16.07 ± 0.709. Number of neurons: Ctr = 22, PTX3 = 16; three independent experiments, Mann–Whitney test. Data are presented as a distribution plus mean ± SEM). Cumulative probability distributions are analyzed by Kolmogorov–Smirnov test.
Representative images showing 14DIV neurons stained for surface AMPAR (GluA, green), the presynaptic protein Bassoon (blue), and tubulin (red) in the different tested conditions. Arrowheads point to postsynaptic GluA clusters. Inset: Example of surface synaptic AMPARs cluster (GluA&Bsn). Scale bar: 5 μm.
Quantification of the surface synaptic AMPARs (GluA&Bsn) normalized to the total number of Bsn shows a statistically significant increase after TTX or PTX3 exposure (Ctr = 1 ± 0.051, TTX = 1.512 ± 0.080, PTX3 = 1.294 ± 0.081, PTX3 heat‐inactivated = 0.959 ± 0.044; number of fields examined: 27, 36, 37, 22, 19, respectively; one‐way ANOVA, P < 0.0001, followed by post hoc Tukey test for multiple comparison as indicated in figure; three independent experiments, data are presented as normalized mean values ± SEM).
One hour of PTX3 administration is not sufficient to elicit an increase in synaptic GluA content (Ctr: 1 ± 0.065, PTX3: 1.023 ± 0.068; number of fields: Ctr = 26, PTX3 = 26; unpaired t‐test, three independent experiments, data are presented as normalized mean values ± SEM).
Representative mEPSC traces recorded from control, C‐term PTX3 fragment‐treated, or N‐term PTX3 fragment‐treated cultures.
mEPSC frequency quantitation (Hz, Ctr = 0.668 ± 0.078; C‐term = 0.523 ± 0.056; N‐term = 1.228 ± 0.121. Number of neurons: Ctr = 23, C‐term = 10, N‐term = 23; three independent experiments. Kruskal–Wallis test, P < 0.0001 followed by Dunn's test as indicated, data are presented as a distribution plus mean ± SEM).
mEPSC amplitude quantitation (pA, Ctr = 16.81 ± 0.78; C‐term = 15.79 ± 1.37; N‐term = 19.78 ± 0.87. Number of neurons: Ctr = 23, C‐term = 10, N‐term = 23; three independent experiments. One‐way ANOVA, P = 0.013 followed by post hoc Tukey test as indicated in figure, data are presented as a distribution plus mean ± SEM) and cumulative probability distribution of mEPSC amplitudes (Kolmogorov–Smirnov test).
Representative images of 14DIV neurons stained for surface AMPARs (GluA, green), the presynaptic protein Bassoon (blue) and tubulin (red) in the different tested conditions. Arrowheads point to postsynaptic GluA clusters. Scale bar: 5 μm.
Quantification of the surface synaptic AMPARs normalized to the total number of Bsn shows an increase upon N‐terminal peptide application, but not upon C‐terminal peptide exposure. TTX is used as positive control (Ctr = 1.000 ± 0.066, TTX = 1.395 ± 0.113, C‐term = 0.717 ± 0.047, N‐term = 1.349 ± 0.069. Number of fields examined: 55, 31, 18, 54, respectively; one‐way ANOVA, P < 0.0001 followed by post hoc Tukey test as indicated in figure; at least three independent experiments, data are presented as normalized mean values ± SEM).
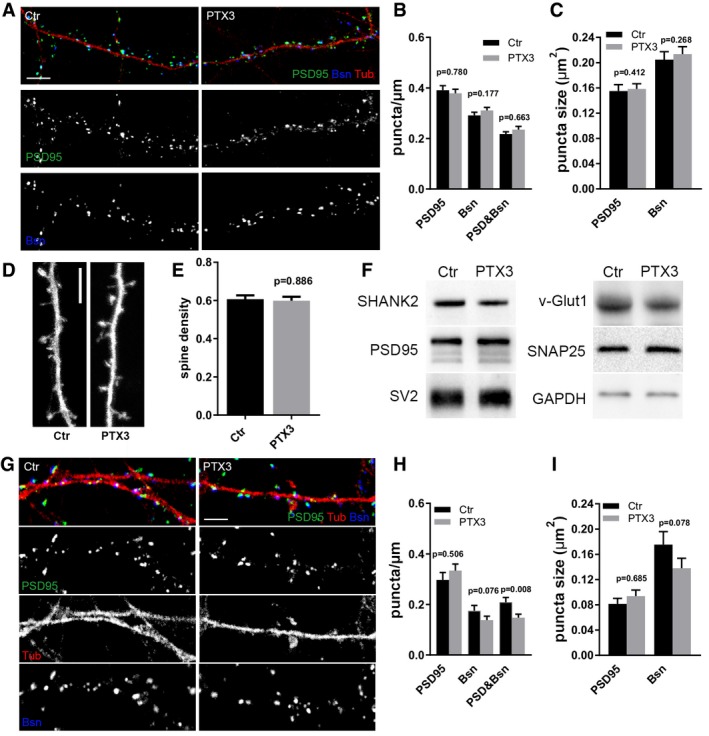
- A
Representative images of 14DIV control and PTX3‐treated cultures stained for the presynaptic marker Bassoon (blue), the postsynaptic protein PSD95 (green), and the microtubule protein tubulin (red). Scale bar: 5 μm.
- B
Quantification of synaptic density shows no differences either for postsynaptic marker (PSD95/μm), or for presynaptic marker (Bsn/μm) or as a total number of synapses (PSD95&Bsn/μm) in control and PTX3‐treated cultures (PSD95/μm, Ctr = 0.391 ± 0.018; PTX3 = 0.379 ± 0.016; Bsn/μm, Ctr = 0.291 ± 0.012, PTX3 = 0.311 ± 0.012; PSD95&Bsn/μm, Ctr = 0.218 ± 0.009, PTX3 = 0.235 ± 0.013. Number of dendrites: 109 Ctr, 107 PTX3, Mann–Whitney test; five independent experiments, data are presented as mean ± SEM).
- C
Quantitative analysis of the mean size of PSD95 and Bsn puncta shows no differences in control or PTX3‐treated neurons (in μm2, PSD95: Ctr = 0.155 ± 0.010; PTX3 = 0.158 ± 0.008; Bsn: Ctr = 0.205 ± 0.013, PTX3 = 0.214 ± 0.012; Number of dendrites: 134 ctr, 124 PTX3, Mann–Whitney test; five independent experiments, data are presented as mean ± SEM).
- D, E
(D) Representative images of GFP‐expressing dendritic branches of control and PTX3‐treated neurons and (E) quantification of dendritic spine density, i.e., number of spines per μm of parent dendrite (Ctr = 0.607 ± 0.020, PTX3 = 0.598 ± 0.021, number of examined dendrites: 73 and 71 respectively; Mann–Whitney test; three independent experiments, data are presented as mean ± SEM). Scale bar: 5 μm.
- F
Western blotting analysis of major synaptic proteins on lysates from control or PTX3‐treated cultures. GAPDH was used as reference marker.
- G–I
Chronic PTX3 administration does not increase neither synaptic density nor synaptic puncta size. (G) Representative images of 14DIV control and PTX3‐treated cultures stained for the presynaptic marker Bassoon (blue), and the postsynaptic protein PSD95 (green) and tubulin (red). Scale bar: 5 μm. (H) Quantification of synaptic density parameters (PSD95/μm; Bsn/μm; PSD95&Bsn/μm) in control and PTX3‐treated neurons (PSD95/μm, Ctr = 0.297 ± 0.029; PTX3 = 0.334 ± 0.026; Bsn/μm, Ctr = 0.261 ± 0.021, PTX3 = 0.221 ± 0.020; PSD95&Bsn/μm, Ctr = 0.209 ± 0.019, PTX3 = 0.148 ± 0.014. Number of dendrites: Ctr = 20, PTX3 = 40, Mann–Whitney test; three independent experiments; data represented as mean ± SEM). (I) Analysis of the mean size of PSD95 and Bsn puncta shows no differences in control or PTX3‐treated neurons (in μm2, PSD95: Ctr = 0.081 ± 0.009; PTX3 = 0.094 ± 0.010; Bsn: Ctr = 0.175 ± 0.021, PTX3 = 0.138 ± 0.016; number of dendrites: Ctr = 22, PTX3 = 48, Mann–Whitney test; three independent experiments, data represented as mean ± SEM).
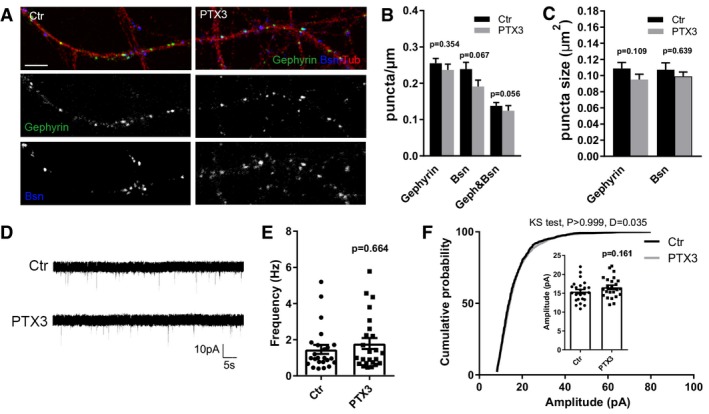
Representative images of 14DIV control and PTX3‐treated cultures stained for the presynaptic marker bassoon (blue), and the postsynaptic inhibitory protein gephyrin (green) and the microtubule protein tubulin (red). Scale bar: 5 μm.
Quantification of synaptic density showing no differences either for postsynaptic marker (gephyrin) or for presynaptic marker (Bsn) or as a total number of synapses (geph&Bsn) in control or PTX3‐treated neurons (gephyrin/μm, Ctr = 0.255 ± 0.014, PTX3 = 0.237 ± 0.016; Bsn/μm, Ctr = 0.239 ± 0.018, PTX3 = 0.191 ± 0.018; gephyrin&Bsn/μm, ctr = 0.138 ± 0.010, PTX3 = 0.125 ± 0.014. Number of dendrites: Ctr = 71, PTX3 = 56; Mann–Whitney test. Three independent experiments, data are presented as mean ± SEM).
Quantitative analysis of the mean size of gephyrin and bassoon puncta showing no differences in control and PTX3‐treated neurons (in μm2, gephyrin: Ctr = 0.109 ± 0.008; PTX3 = 0.095 ± 0.006; Bsn: Ctr = 0.107 ± 0.008, PTX3 = 0.099 ± 0.005, number of dendrites: Ctr = 53, PTX3 = 41; Mann–Whitney test; three independent experiments, data are presented as mean ± SEM).
Representative traces of mIPSCs recorded from control and PTX3‐treated neurons.
mIPSC frequency quantitation (Hz, Ctr = 1.464 ± 0.250; PTX3 = 1.792 ± 0.306. Number of neurons: Ctr = 24, PTX3 = 24; five independent experiments. Mann–Whitney test, data are presented as a distribution plus mean ± SEM).
Cumulative probability plot and (inset) average of mIPSC amplitude (pA, Ctr = 15.43 ± 0.572; PTX3 = 16.58 ± 0.565. Number of neurons: Ctr = 24, PTX3 = 24; five independent experiments. Unpaired t‐test, data are presented as a distribution, mean ± SEM and cumulative probability distribution of amplitudes analyzed with Kolmogorov–Smirnov test).
- A
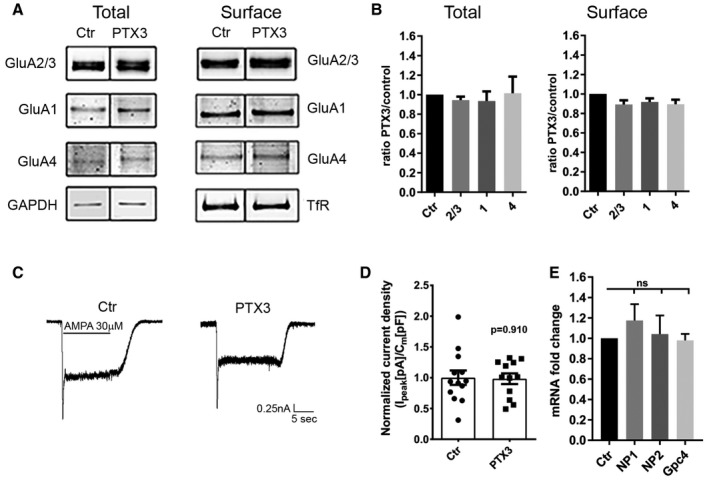
Western blotting analysis of total and surface (biotinylated) GluA subunits of control and PTX3‐treated neurons as indicated showing no differences either for the total levels of expression or for the global surface levels of the different GluA subunits.
- B
Quantification of total receptors levels was normalized to GAPDH in each sample, whereas surface GluA subunits were normalized to surface transferrin receptor, TfR, in each sample. Data are shown as ratio PTX3 over control for each GluA subunit (total: Ctr = 1 ± 0; GluA2/3 = 0.943 ± 0.036, GluA1 = 0.93 ± 0.098, GluA4 = 1.014 ± 0.17. Number of samples: 7, 6, 7, 7 respectively; Kruskal–Wallis test, P = 0.472. Surface: Ctr = 1 ± 0; GluA2/3 = 0.89 ± 0.041, GluA1 = 0.92 ± 0.038, GluA4 = 0.89 ± 0.047; number of samples: 6, 6, 6, 6, respectively. Kruskal–Wallis test, P = 0.112; 3 independent experiments, normalized values, mean ± SEM).
- C, D
(C) Representative traces and (D) quantitative analysis of total current density evoked by application of 30 μM AMPA in control and PTX3‐treated cultures (Ctr = 1 ± 0.117; PTX3 = 0.983 ± 0.87; Student's t‐test; number of neurons: Ctr = 13, PTX3 = 12; 3 independent experiments, data are presented as distribution plus normalized mean ± SEM).
- E
PTX3 does not affect neuronal pentraxins and glypican 4 expression. qRT–PCR analysis of mRNA levels for NP1, NP2, and glypican 4 (Gpc4) performed in pure neuronal cultures treated with PTX3 (1 μg/ml for 48 h). qPCR fold change normalized on control: Ctr = 1.000 ± 0.000; NP1 = 1.174 ± 0.16; NP2 = 1.041 ± 0.182; Gpc4 = 0.980 ± 0.062. Wilcoxon test: Ctr vs. NP1: P = 0.312, Ctr vs. NP2: P = 0.688, Ctr vs. Gpc4: P > 0.999. Graphs show mean ± SEM. At least 5 independent experiments.
- A
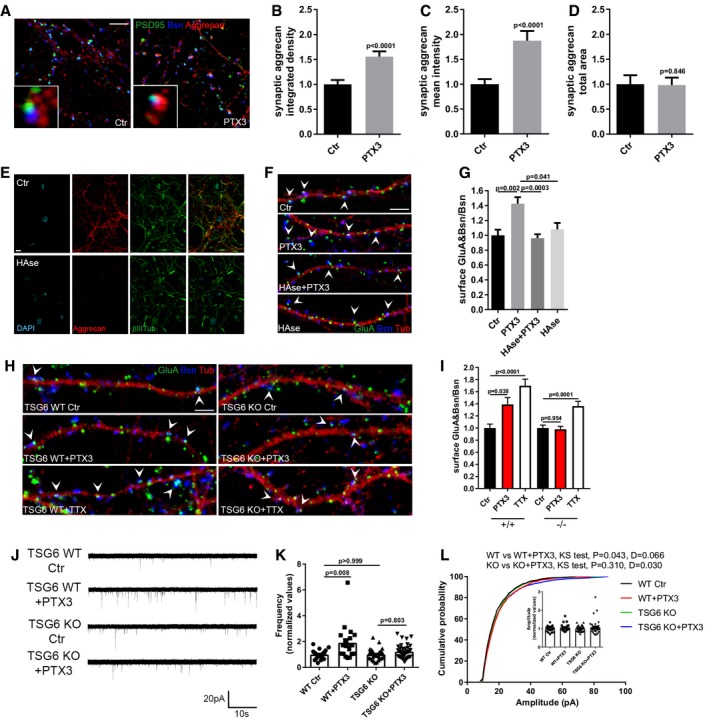
Low and high magnification images of control and PTX3‐treated neurons stained for the PNN main component, aggrecan (red), the synaptic proteins PSD95 (green), and Bsn (blue). Scale bar: 5 μm.
- B–D
PTX3 application induces a remodeling of the PNN in culture, as assessed by the increase mean intensity and integrated density value of the synapse‐co‐localizing aggrecan signal, whereas no difference in the total area of aggrecan is evident (integrated density: Ctr = 1 ± 0.103, PTX3 = 1.874 ± 0.197; mean intensity: Ctr = 1.000 ± 0.088, PTX3 = 1.556 ± 0.107; total area: Ctr = 1 ± 0.179, PTX3 = 0.982 ± 0.149. Number of fields examined: 26 Ctr, 22 PTX3; Mann–Whitney test; three independent experiments, data are presented as normalized mean values ± SEM).
- E
Overnight treatment with hyaluronidase destroys PNN as shown by immunofluorescence for aggrecan (red), DAPI (cyan), and βIII tubulin (green) and confocal analysis. Scale bar: 20 μm.
- F
Representative images showing 14DIV neurons stained for surface AMPARs (GluA, green), the presynaptic protein Bassoon (blue), and tubulin (red) in the different tested conditions. Arrowheads point to postsynaptic GluA clusters. Scale bar: 5 μm.
- G
HAse treatment blocks PTX3‐induced synaptic surface AMPA receptors clustering (Ctr = 1.000 ± 0.075, PTX3 = 1.425 ± 0.088, PTX3+HAse = 0.961 ± 0.053, HAse = 1.080 ± 0.087. Number of fields examined: 37, 23, 53, 28, respectively; Kruskal–Wallis test, P = 0.0004 followed by post hoc Tukey test as indicated in figure; three independent experiments, data are presented as normalized mean value ± SEM).
- H
Representative images showing 14DIV WT and TSG6 KO neurons stained for surface AMPARs (GluA, green), the presynaptic protein Bassoon (blue), and tubulin (red) in the different tested conditions. Arrowheads point to postsynaptic GluA clusters. Scale bar: 5 μm.
- I
Synaptic surface GluA quantitation showing no effect of PTX3 treatment in TSG6 KO cultures. On the contrary WT cultures (from littermates) display increased surface GluA&Bsn/Bsn upon PTX3 treatment. A significant enhancement of surface GluA receptors was induced by TTX in both TSG6 KO and WT cultures (WT = 1 ± 0.06; WT+PTX3 = 1.389 ± 0.113; WT+TTX = 1.698 ± 0.109; Number of fields examined: 40, 39, 32 respectively; Kruskal–Wallis test P < 0.0001 followed by post hoc Dunn's test. TSG6 KO = 1.000 ± 0.047; TSG6 KO+PTX3 = 0.979 ± 0.048; TSG6 KO + TTX = 1.363 ± 0.077. Number of fields examined: 54, 57, 29 respectively; one‐way ANOVA, P < 0.0001 followed by post hoc Tukey test as indicated in figure. n = 3 independent experiments, data are presented as normalized mean values ± SEM).
- J
Representative mEPSC traces recorded from WT and TSG6 KO littermates cultures treated or not with PTX3 (1 μg/ml for 48 h).
- K
On the contrary of WT cultures, mEPSC frequency quantitation shows no increase in frequency in TSG6 KO cultures when treated with PTX3 (normalized frequency, WT Ctr: 1.000 ± 0.074; Wt + PTX3 = 1.912 ± 0.289; TSG6 KO Ctr = 1 ± 0.079; TSG6 KO + PTX3 = 1.226 ± 0.096; 22, 20, 30, 24 cells, respectively, 6 TSG6 KO mice and 4 WT littermates. One‐way ANOVA test P = 0.002 followed by post hoc Dunn's test, data are presented as normalized mean ± SEM plus the distribution).
- M
Cumulative probability plot of mEPSC amplitude and average mEPSC amplitude quantitation (inset) showing no difference in amplitude (WT Ctr: 1.000 ± 0.034, Wt + PTX3 = 1.069 ± 0.046, TSG6 KO Ctr = 1.000 ± 0.028; TSG6 KO + PTX3 = 1.074 ± 0.67; 22, 20, 30, 24 cells, respectively, 6 TSG6 KO mice and 4 WT littermates. One‐way ANOVA test P = 0.817 followed by post hoc Dunn's test, data are presented as normalized mean ± SEM plus the distribution. Cumulative distribution is analyzed by Kolmogorov–Smirnov test).
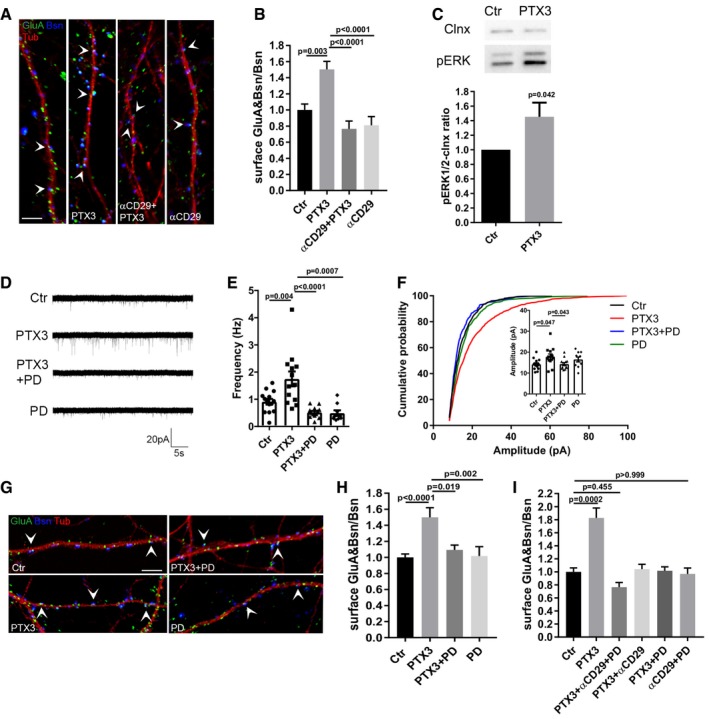
Representative images showing 14DIV neurons stained for surface AMPARs (GluA, green), the presynaptic protein Bassoon (blue), and tubulin (red) in the different tested conditions. Arrowheads point to postsynaptic GluA clusters. Scale bar: 5 μm.
Blocking β1‐integrins activity by using the specific anti‐β1 integrin monoclonal antibody prevents the PTX3‐induced postsynaptic AMPAR recruitment (Ctr = 1.000 ± 0.074, PTX3 = 1.504 ± 0.098, αCD29+PTX3 = 0.766 ± 0.097, αCD29 = 0.810 ± 0.108. Number of fields examined: 37, 33, 23, 24 respectively; one‐way ANOVA, P < 0.0001 followed by post hoc Tukey test; three independent experiments, data are presented as normalized mean values ± SEM).
Western blotting analysis of p‐ERK levels on lysates from control and PTX3‐treated neurons upon 30‐min stimulation (Ctr = 1 ± 0; PTX3 = 1.453 ± 0.195, six independent experiments, unpaired t‐test, data are presented normalized on control and as mean ± SEM).
Representative mEPSC traces recorded from the indicated experimental conditions.
mEPSC frequency quantitation showing that pre‐incubation with PD98059 (30 μM) completely prevents the PTX3‐dependent increase of mEPSC frequency (Hz, Ctr = 0.911 ± 0.104; PTX3 = 1.748 ± 0.273; PTX3 + PD = 0.518 ± 0.055; PD = 0.491 ± 0.104. Number of neurons: Ctr = 14, PTX3 = 14, PTX3 + PD = 13; PD = 9; three independent experiments. One‐way ANOVA, P < 0.0001 followed by post hoc Tukey test as indicated in figure. Data are presented as a distribution plus mean ± SEM).
Inset: average mEPSC amplitude quantitation (pA), Ctr = 14.19 ± 0.70; PTX3 = 19.09 ± 1.71; PTX3+PD = 14.31 ± 0.70, PD = 16.51 ± 1.17. Number of neurons: Ctr = 14, PTX3 = 14, PTX3+PD = 13; PD = 9; three independent experiments. Kruskal–Wallis test, P = 0.015 followed by Dunn's test as indicated in figure, data are presented as a distribution plus mean ± SEM. Cumulative probability plot of mEPSC amplitudes is analyzed with Kolmogorov–Smirnov test: Ctr vs. PTX3: P < 0.0001, D = 0.183, PTX3 vs. PTX3 + PD: P < 0.0001, D = 0.251, PTX3 vs. PD: P < 0.0001, D = 0.157.
Representative images showing 14DIV neurons stained for surface AMPARs (GluA, green), the presynaptic protein Bassoon (blue), and tubulin (red) in the different tested conditions. Arrowheads point to postsynaptic GluA clusters. Scale bar: 5 μm.
Quantification of the surface synaptic AMPARs normalized to the total number of Bsn [(GluA&Bsn)/Bsn] shows a statistically significant increase after PTX3 exposure, while pre‐incubation with PD98059 prevents the PTX3‐dependent increase (Ctr = 1 ± 0.042, PTX3 = 1.499 ± 0.121, PTX3 + PD = 1.093 ± 0.060, PD = 1.017 ± 0.117; number of fields examined: 49, 15, 15, 20, respectively; one‐way ANOVA, P = 0.0002 followed by post hoc Tukey test as indicated in figure; at least three independent experiments, data are presented as normalized mean values ± SEM).
Quantification of surface synaptic GluA upon PTX3 application and simultaneous inhibition of β1‐integrin and ERK1/2 signaling pathways reveals no additive effects with respect to single αCD29 or PD applications (Ctr = 1 ± 0.061; PTX3 = 1.828 ± 0.151; αCD29 + PD + PTX3 = 0.766 ± 0.070; PTX3 + αCD29 = 1.043 ± 0.073; PTX3 + PD = 1.016 ± 0.061; PD = 0.969 ± 0.090; number of fields examined: 29, 31, 30, 23, 14, 33, respectively; one‐way ANOVA, P < 0.0001 followed by post hoc Dunn's test as indicated in figure; at least three independent experiments, data are presented as normalized mean values ± SEM).
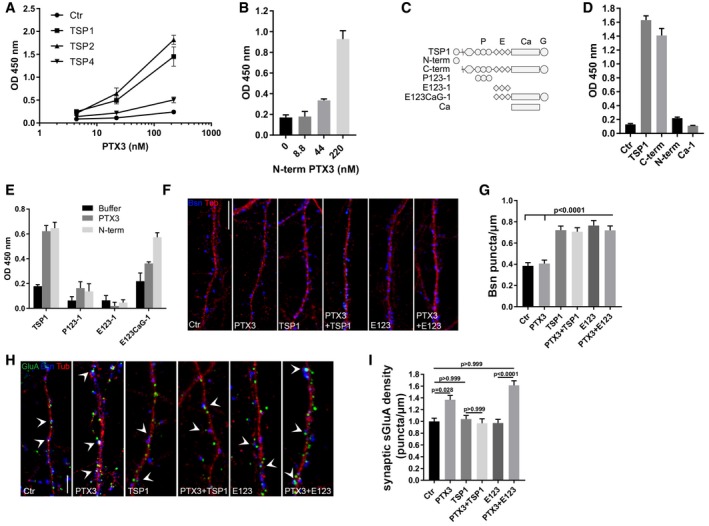
PTX3 binds TSP1 and TSP2 but not TSP4. Different amounts of human recombinant PTX3 were incubated in microplate wells coated with purified human TSP1 or recombinant TSP2 and TSP4. Binding is reported as absorbance at 450 nm (mean ± SD). Data are from one experiment out of three performed.
N‐terminal PTX3 binds TSP1. Binding of PTX3 N‐term domain was performed on TSP1 immobilized on plastic wells. Data are reported as absorbance at 450 nm (mean ± SD) and are representative of one out of two experiments performed.
Schematic representation of TSP1 monomer and the TSP1 proteolytic fragments (N‐term, C‐term) and recombinant domains (P123‐1, E123‐1, E123CaG‐1, Ca‐1) used in the study.
PTX3 binds the C‐term proteolytic fragment of TSP1. TSP1 and its fragments C‐term, N‐term, and Ca‐1 (type III repeats) were immobilized in plastic wells (5 μg/ml) and binding of PTX3 is reported as absorbance at 450 nm (mean ± SD). Data refers to one out of two experiments performed with similar results.
PTX3 and its N‐terminal domain bind TSP1 C‐terminal globular domain. 50 nM of P123‐1 (type I “properdin” repeats), E123‐1 (type II EGF repeats), E123CaG‐1 (type II repeats plus type III repeats and globular C‐terminus), and TSP1 were immobilized in plastic well. Binding with PTX3 or N‐terminal domain (both at 220 nM) was analyzed. Data are reported as absorbance at 450 nm (mean ± SD) and refer to one out of two experiments performed with similar results.
Representative images of 14DIV control and PTX3‐treated cultures stained for the presynaptic marker bassoon (blue) and the microtubule protein tubulin (red). Scale bar: 10 μm.
Quantification of synaptic density (Bsn/μm) in the different experimental conditions (Ctr = 0.385 ± 0.029, PTX3 = 0.407 ± 0.032, TSP1 = 0.721 ± 0.039, PTX3+TSP1 = 0.707 ± 0.037, E123 = 0.764 ± 0.047, PTX3+E123 = 0.719 ± 0.041. Number of fields examined: 86, 80, 75, 72, 46, 55 respectively; Kruskal–Wallis test, P < 0.0001 followed by Dunn's test as indicated in figure; at least three independent experiments, data are presented as mean values ± SEM).
Representative images showing 14DIV neurons stained for surface AMPAR (GluA, green), the presynaptic protein Bassoon (blue), and tubulin (red) in the different tested conditions. Arrowheads point to postsynaptic GluA clusters. Scale bar: 5 μm.
Quantification of the synaptic surface GluA density (number of sGluA puncta/μm) in the different tested conditions showing that GluA density increases in neuronal cultures treated with PTX3 or E123 + PTX3 but not in cultures treated with the full‐length TSP1 + PTX3 (Ctr = 1.000 ± 0.055; PTX3 = 1.367 ± 0.074; TSP1 = 1.04 ± 0.061; PTX3 + TSP1 = 0.968 ± 0.076; E123 = 0.971 ± 0.063; PTX3 + E123 = 1.613 ± 0.077. Number of dendrites examined: 103, 80, 88, 57, 51, 62, respectively; Kruskal–Wallis test, P < 0.0001 followed by Dunn's test as indicated in figure; at least three independent experiments, data are presented as normalized mean values ± SEM).
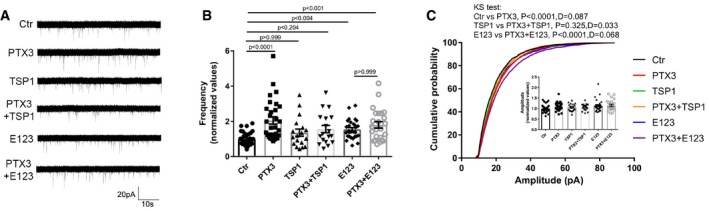
Examples of mEPSC recordings in the indicated conditions.
mEPSC frequency quantification showing that co‐incubation of PTX3 and full‐length TSP1 did not result in increased miniature frequency. Of note application of E123 alone induced per se a statistically significant increase of mEPSC frequency, whereas no difference was detectable upon co‐incubation of E123 fragment +PTX3 with respect to E123 alone (normalized average frequency: Ctr = 1.000 ± 0.065; PTX3 = 2.055 ± 0.209; TSP1 = 1.358 ± 0.202; PTX3+TSP1 = 1.562 ± 0.212; E123 = 1.548 ± 0.100; PTX3+E123 = 1.803 ± 0.183. Number of recorded cells: 33, 30, 18, 18, 29, 24, respectively, from at least 3 different culture preparations. Kruskal–Wallis test P < 0.0001 followed by post hoc Dunn's test. Data are presented normalized mean ± SEM along with distribution of values).
Cumulative probability plot of mEPSCs amplitudes showing that there is a significant shift in the distribution by the Kolmogorov–Smirnov test in Ctr vs. PTX3 and E123 vs. E123 + PTX3 but not in TSP1 vs. TSP1 + PTX3 further supporting the evidence that full‐length TSP1, but not E123 fragment, inhibits PTX3 activity. Inset: No statistically significant difference was instead detectable in the average amplitude (normalized average amplitude: Ctr = 1.000 ± 0.033; PTX3 = 1.088 ± 0.036; TSP1 = 1.06 ± 0.043; PTX3+TSP1 = 1.053 ± 0.038; E123 = 1.137 ± 0.051; PTX3 + E123 = 1.152 ± 0.052. Number of recorded cells: 33, 30, 18, 18, 29, 24, respectively, from at least three different culture preparations. Kruskal–Wallis test P = 0.172 followed by post hoc Dunn's test. Data are presented normalized mean ± SEM along with the distribution of values.).
- A
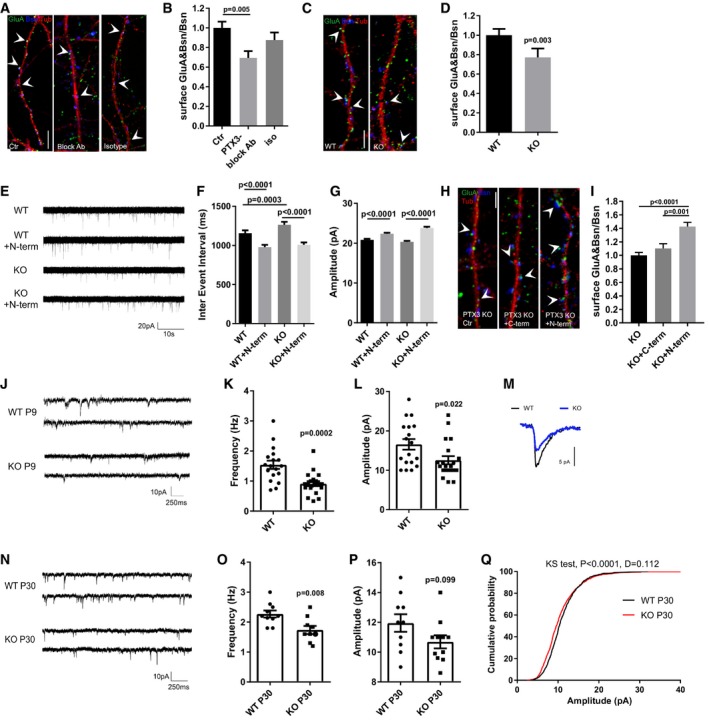
Representative images of 14DIV neurons stained for surface AMPARs (GluA, green), Bassoon (blue), and tubulin (red) in the different tested conditions. Arrowheads point to postsynaptic GluA clusters. Scale bar: 5 μm.
- B
Quantification of the surface synaptic AMPARs normalized to the total number of Bsn shows a decrease of the surface synaptic AMPAR clusters upon chronic application of the PTX3 blocking antibody to mixed cultures (Ctr = 1.000 ± 0.063, PTX3 block = 0.694 ± 0.069, isotype Ab = 0.876 ± 0.077. Number of fields examined: 34, 23, 19, respectively; one‐way ANOVA, P < 0.0001 followed by post hoc Tukey test as indicated in figure; three independent experiments, data are presented as normalized mean values ± SEM).
- C
Representative images of 14DIV WT and PTX3 KO neurons stained for surface AMPARs (GluA, green), Bassoon (blue), and tubulin (red). Arrowheads point to postsynaptic GluA clusters. Scale bar: 5 μm.
- D
Quantification of the surface synaptic AMPARs normalized to the total number of Bsn shows a reduction in PTX3 KO cultures with respect to WT (WT = 1 ± 0.065, KO = 0.771 ± 0.0.92; number of fields examined: 36 and 42, respectively; Mann–Whitney test; number of animals 5 WT and 6 PTX3 KO, data are presented as normalized mean values ± SEM).
- E
Examples of mEPSCs recorded in the indicated experimental conditions.
- F
Quantitation of mEPSC inter‐event interval showing a rescue of mEPSC frequency in PTX3 KO cultures treated with the N‐terminal fragment of PTX3 (WT = 1158 ± 34.67; WT+N‐term = 979.1 ± 28.27; PTX3 KO = 1263 ± 38.99; PTX3 KO+N‐term = 1008 ± 30.14. Number of neurons: WT, Ctr = 25, WT+N‐term = 29; PTX3 KO, Ctr = 24; PTX3 KO+N‐term = 22; three independent experiments. Kruskal–Wallis test, P < 0.0001 followed by Dunn's test as indicated in figure, data are presented as mean ± SEM).
- G
Quantitation of mEPSC amplitude showing a rescue in PTX3 KO cultures treated with the N‐terminal fragment of PTX3 (pA, WT = 20.85 ± 0.249 WT+N‐term = 22.37 ± 0.234; PTX3 KO = 20.31 ± 0.264; PTX3 KO+N‐term = 23.8 ± 0.316. Number of neurons: WT, Ctr = 25, WT+N‐term = 29; PTX3 KO, Ctr = 24; PTX3 KO+N‐term = 22; 3 independent experiments. Kruskal–Wallis test, P < 0.0001 followed by Dunn's test as indicated in figure, data are presented as mean ± SEM).
- H
Representative images of 14DIV PTX3 KO neurons (Ctr, +N‐terminal PTX3, +C‐terminal PTX3) stained for surface AMPARs (GluA, green), Bassoon (blue), and tubulin (red). Arrowheads point to postsynaptic GluA clusters. Scale bar: 5 μm.
- I
Quantification of the surface synaptic AMPARs normalized to the total number of Bsn shows an increase in PTX3 KO treated with N‐terminal fragment of PTX3 but not with the C‐terminal fragment (PTX3 KO = 1.000 ± 0.042, PTX3 KO + C‐term = 1.103 ± 0.070, PTX3 KO + N‐term = 1.428 ± 0.061. Number of fields examined: 63, 38, 57 respectively; Kruskal–Wallis test, P < 0.0001 followed by Dunn's test; 3 independent experiments, data are presented as normalized mean values ± SEM).
- J–L
(J) Examples of mEPSCs recordings in WT and PTX3 KO (littermates) hippocampal slices at P8‐9 showing that frequency (K) and amplitude (L) are significantly decreased in KO neurons with respect to WT (Hz: WT = 1.54 ± 0.136; PTX3 KO = 0.912 ± 0.083; Mann–Whitney test. pA: WT = 16.57 ± 1.334; PTX3 KO = 12.55 ± 1.037; unpaired t‐test. Data are presented as a distribution plus mean ± SEM. WT: 18 cells, 4 mice; PTX3 KO: 20 cells, 5 mice).
- M
Representative superimposed average traces aligned by rise time.
- N
Examples of mEPSCs recordings of P30 WT and PTX3 KO hippocampal slices.
- O
Quantification of mEPSC frequency showing reduced frequency in PTX3 KO mice with respect to WT (Hz: WT = 2.27 ± 0.115; PTX3 KO = 1.74 ± 0.136. WT: 10 cells, 4 mice; PTX3 KO: 11 cells, 5 mice. Unpaired t‐test P = 0.008. Data are presented as a distribution plus mean ± SEM).
- P, Q
(P) No difference in the average amplitude is evident (pA: WT = 11.95 ± 0.589; PTX3 KO = 10.69 ± 0.438; unpaired t‐test P = 0.099. Data are presented as a distribution plus mean ± SEM. WT: 10 cells, 4 mice; PTX3 KO: 11 cells, 5 mice); however, the cumulative probability plot of amplitudes (Q) for mEPSCs in WT and PTX3 KO shows that there is a significant shift in the distribution by the Kolmogorov–Smirnov test (P < 0.0001, D = 0.112).
References
-
- Alles VV, Bottazzi B, Peri G, Golay J, Introna M, Mantovani A (1994) Inducible expression of PTX3, a new member of the pentraxin family, in human mononuclear phagocytes. Blood 84: 3483–3493 - PubMed
Publication types
MeSH terms
Substances
LinkOut - more resources
Full Text Sources
Molecular Biology Databases
Miscellaneous
