. 2019 Jan 3;39(2):e00390-18.
doi: 10.1128/MCB.00390-18. Print 2019 Jan 15.

Hypoxia Restrains Lipid Utilization via Protein Kinase A and Adipose Triglyceride Lipase Downregulation through Hypoxia-Inducible Factor

Affiliations

Hypoxia Restrains Lipid Utilization via Protein Kinase A and Adipose Triglyceride Lipase Downregulation through Hypoxia-Inducible Factor

Ji Seul Han et al. Mol Cell Biol. .

Abstract

Oxygen is a key molecule for efficient energy production in living organisms. Although aerobic organisms have adaptive processes to survive in low-oxygen environments, it is poorly understood how lipolysis, the first step of energy production from stored lipid metabolites, would be modulated during hypoxia. Here, we demonstrate that fasting-induced lipolysis is downregulated by hypoxia through the hypoxia-inducible factor (HIF) signaling pathway. In Caenorhabditis elegans and mammalian adipocytes, hypoxia suppressed protein kinase A (PKA)-stimulated lipolysis, which is evolutionarily well conserved. During hypoxia, the levels of PKA activity and adipose triglyceride lipase (ATGL) protein were downregulated, resulting in attenuated fasting-induced lipolysis. In worms, HIF stabilization was sufficient to moderate the suppressive effect of hypoxia on lipolysis through ATGL and PKA inhibition. These data suggest that HIF activation under hypoxia plays key roles in the suppression of lipolysis, which might preserve energy resources in both C. elegans and mammalian adipocytes.

Keywords: ATGL; HIF; PKA; hypoxia; lipolysis.


Figures

FIG 1
FIG 1
Hypoxia suppresses fasting-induced lipolysis in Caenorhabditis elegans. (A and B) Young adult worms were placed in a hypoxic chamber or 1.5-ml tube filled with isotonic (M9) buffer. Representative images and quantitation data of oil red O (ORO) staining in young adult worms under feeding and at 8 h of fasting under hypoxic conditions (incubated in a 1% O2 hypoxia chamber or drowned with or without aeration by shaking). Anterior intestinal parts were subjected to quantification of ORO staining. Scale bars, 50 μm. (C) Confocal microscopic images of iaIs7[nhr-57p::gfp; unc-119(+)] fed and fasted (4 h) worms under hypoxic conditions (1% O2, 6 h). Scale bars, 50 μm. (D) Confocal microscopic images of hjIs67[atgl-1p::atgl-1::gfp] fed and fasted (4 h) young adult worms under hypoxia (1% O2, 6 h). Scale bars, 20 μm. (E) mRNA levels of atgl-1 and fasting-responsive genes such as fil-1 and cpt-3 were measured by quantitative reverse transcription-PCR and normalized to the level of act-1/act-3 mRNA. Data are expressed as means plus SD (**, P < 0.01).
FIG 2
FIG 2
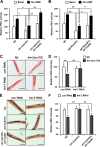
Hypoxia inhibits PKA-induced lipolysis in C. elegans. (A and B) Representative images and quantitation data of ORO staining in a PKA-hyperactive kin-2 mutant strain (ce179 strain) after hypoxia (1% O2, 8 h). Marked areas were subjected to quantitation of ORO staining. Scale bars, 100 μm. (C) Confocal microscopic images of hjIs67[atgl-1p::atgl-1::gfp] young adult worms after control (L4440; con) RNAi or kin-2 RNAi under hypoxia (1% O2, 6 h). Scale bars, 20 μm. (D) mRNA levels of atgl-1 and fasting-responsive genes such as fil-1 and cpt-3 were measured by quantitative reverse transcription-PCR and normalized to the level of act-1/act-3 mRNA. Data are expressed as means plus SD (*, P < 0.05; **, P < 0.01).
FIG 3
FIG 3
Hypoxia attenuates stimulated lipolysis in mammalian adipocytes. (A) Glycerol concentration in culture medium from differentiated adipocytes. 3T3-L1 adipocytes were treated with ISO (1 μM), FSK (10 μM), or IBMX (520 μM) after hypoxia (1% O2, 6 h). (B) Representative images of differentiated adipocytes upon treatment with ISO (1 μM, 9 h) under hypoxia (1% O2, 24 h). BODIPY 493/503 staining after fixation is shown. (C) Western blotting of lipolysis-related proteins in differentiated adipocytes upon treatment with ISO (1 μM, 1 h) after hypoxia (1% O2, 6 h). β-Actin protein was used as a loading control. (D) Representative images of immunocytochemistry (ICC) analysis of PLIN1 (green) and ATGL (red) with ISO (1 μM, 9 h) under hypoxia (1% O2, 24 h). (E) mRNA levels in 3T3-L1 adipocytes with ISO (1 μM, 3 h) under hypoxic conditions (1% O2, 8 h). mRNA levels were normalized to the level of cyclophilin mRNA. (F) Western blotting of lipolysis-related proteins in differentiated adipocytes with ISO (1 μM, 1 h), FSK (10 μM, 1 h), IBMX (520 μM, 1 h), or db-cAMP (0.5 mM, 1 h) after hypoxia (1% O2, 6 h). β-Actin protein was used as a loading control. (G) Intracellular cAMP levels were measured in adipocytes. Differentiated adipocytes were treated with ISO (1 μM), FSK (10 μM), or IBMX (520 μM) for 15 min after hypoxia (1% O2, 6 h). (H) Intracellular cAMP levels were measured in C. elegans after 4 h of fasting under hypoxic conditions (1% O2, 8 h). (I) mRNA levels in 3T3-L1 adipocytes under hypoxic conditions (1% O2, 8 h). mRNA levels were normalized to the level of 36b4 mRNA. Data are expressed as means + SD (*, P < 0.05; **, P < 0.01).
FIG 4
FIG 4
Hypoxia suppresses PKA-induced lipolysis in mammalian adipocytes. (A) Glycerol concentration in culture medium from differentiated adipocytes 24 h after siRNA transfection with siRIα and siRIIβ. After siRNA transfection, cells were subjected to hypoxia (1% O2, 6 h). (B) Representative images of adipocytes after siRNA transfection with siRIα and siRIIβ. After siRNA transfection, cells were subjected to hypoxia (1% O2, 24 h). BODIPY 493/503 was used for staining after fixation. siNC, siRNA targeting the negative control. (C) Western blotting of lipolysis-related proteins in differentiated adipocytes with siRNA transfection. Hypoxic conditions (1% O2, 6 h) were induced after siRNA transfection. β-Actin protein was used as a loading control. (D) Representative images of ICC analysis of PLIN1 (green) and ATGL (red) at 48 h after siRNA transfection with siRIα and siRIIβ. The hypoxic condition (1% O2, 6 h) was induced after siRNA transfection. Data are expressed as means plus SD (*, P < 0.05; **, P < 0.01).
FIG 5
FIG 5
HIF-1 is sufficient and necessary to suppress fasting-induced lipolysis in C. elegans. (A to D) Representative images and quantitation data of ORO staining in fed and fasted (8 h) young adult worms of the indicated strains. Marked areas were subjected to quantitation of ORO staining. Scale bars, 100 μm. (E) Confocal microscopic images of hjIs67[atgl-1p::atgl-1::gfp] fed and fasted (4 h) worms after control (L4440) RNAi or vhl-1 RNAi. Scale bars, 20 μm. (F) mRNA level of cpt-3 was measured by quantitative reverse transcription-PCR and normalized to the level of act-1/act-3 mRNA. (G and H) Representative images and quantitation data of ORO staining in fed and fasted (8 h) young adult N2 and iaIs34[hif-1p::hif-1a (P621G)::tag + unc-119(+)] worms. Marked areas were subjected to quantitation of ORO staining. Scale bars, 100 μm. (I) mRNA level of cpt-3 was measured by quantitative reverse transcription-PCR and normalized to the level of act-1/act-3 mRNA. (J and K) Representative images and quantitation data of ORO staining in fed and fasted (8 h) young adult N2 and hif-1(ia04) worms under hypoxia (1% O2, 8 h). Scale bars, 100 μm. (L) Confocal microscopic images of hjIs67[atgl-1p::atgl-1::gfp] fed and fasted (4 h) worms under hypoxia (1% O2, 8 h) after control (L4440) RNAi or hif-1 RNAi. Scale bars, 20 μm. (M) mRNA level of cpt-3 was measured by quantitative reverse transcription-PCR and normalized to the level of act-1/act-3 mRNA. Data are expressed as means plus SD (*, P < 0.05; **, P < 0.01; n.s., P > 0.05).
FIG 6
FIG 6
HIF-1 restrains PKA activity in C. elegans. (A and B) PKA activity assays using the Kemptide substrate and total protein extracts obtained from young adult worms of the indicated strains in the absence or presence of dibutyryl-cAMP (db-cAMP). (C and D) Representative images and quantitation data of ORO staining in a PKA-hyperactive kin-2 mutant strain (ce179 strain) after control (L4440) RNAi or vhl-1 RNAi. Marked areas were subjected to quantitation of ORO staining. Scale bars, 100 μm. (E and F) Representative images and quantitation data of ORO staining in N2, vhl-1(ok161), and vhl-1(ok161); hif-1(ia04) worms with control (L4440) RNAi or kin-2 RNAi. Boxed areas were subjected to quantitation of ORO staining. Scale bars, 100 μm. Data are expressed as means plus SD (*, P <0.05; **, P <0.01).
FIG 7
FIG 7
Regulation of ATGL-1 protein is mediated by HIF-1. (A and B) Representative images and quantitation data of ORO staining in N2 and hjIs67[atgl-1p::atgl-1::gfp] worms under hypoxic conditions (1% O2, 8 h). (C and D) Representative images and quantitation data of ORO staining in N2 and hjIs67[atgl-1p::atgl-1::gfp] worms after control (L4440) RNAi or vhl-1 RNAi. For ORO staining, boxed areas were subjected to quantitation of ORO staining. Scale bars, 100 μm. (E) Confocal microscopic images of hjIs67[atgl-1p::atgl-1::gfp] fed and fasted (4 h) worms under hypoxic conditions (1% O2, 6 h). MG132 (100 μM) was used for pretreatment for 1 h before hypoxia. (F) Confocal microscopic images of hjIs67[atgl-1p::atgl-1::gfp] fed and fasted (4 h) worms after control (L4440) RNAi or vhl-1 RNAi. MG132 (100 μM) was used for treatment under the fasting condition. Scale bar, 20 μm. Data are expressed as means plus SD (**, P <0.01).
FIG 8
FIG 8
Mammalian HIFα inhibits PKA-induced lipolysis through ATGL regulation. (A) Glycerol concentration in culture medium from differentiated adipocytes treated with ISO (1 μM) after 72 h of infection with adenovirus expressing GFP (Ad-Mock), HIF1α (Ad-HIF1α), or HIF2α (Ad-HIF2α). (B and C) Western blotting in differentiated adipocytes treated with ISO (1 μM, 1 h) after 72 h of infection with adenovirus expressing GFP (Ad-Mock), HIF1α (Ad-HIF1α), or HIF2α (Ad-HIF2α). β-Actin protein was used as a loading control. (D) Glycerol concentration in culture medium from differentiated adipocytes. 3T3-L1 adipocytes were treated with ISO (1 μM) after CoCl2 treatment (200 μM, 24 h). (E) Western blotting in differentiated adipocytes with ISO (1 μM, 1 h) after CoCl2 treatment (200 μM, 24 h). (F) Intracellular cAMP levels were measured in adipocytes after 72 h of infection with adenovirus expressing GFP (Ad-Mock), HIF1α (Ad-HIF1α), or HIF2α (Ad-HIF2α). Adipocytes were treated with ISO (1 μM) for 15 min. (G) Glycerol concentration in culture medium from differentiated adipocytes 24 h after siRIα and siRIIβ transfection. Adipocytes were infected with adenovirus expressing GFP (Ad-Mock) or HIF1α (Ad-HIF1α) 48 h before transfection. (H) Western blotting in differentiated adipocytes 24 h after siRIα and siRIIβ transfection. Adipocytes were infected with adenovirus expressing GFP (Ad-Mock) or HIF1α (Ad-HIF1α) 48 h before transfection. β-Actin protein was used as a loading control. (I) Western blotting in differentiated adipocytes treated with ISO (1 μM, 1 h) 48 h after transfection of HA-HIF1α, HA-HIF1α ΔNAD, or HA-HIF1α ΔCAD. β-Actin protein was used as a loading control. (J) Glycerol concentration in culture medium from differentiated adipocytes in the absence or presence of ISO (1 μM) under hypoxia (1% O2, 6 h). siRNA was transfected 48 h before glycerol release was measured. (K) Western blotting in differentiated adipocytes upon hypoxia (1% O2, 6 h). Adipocytes were pretreated with MG132 (20 μM) 1 h before hypoxia. β-Actin protein was used as a loading control. Data are expressed as means plus SD (*, P < 0.05; **, P < 0.01; n.s., P > 0.05).
FIG 9
FIG 9
Proposed model.

References

    1. Martin S, Parton RG. 2006. Lipid droplets: a unified view of a dynamic organelle. Nat Rev Mol Cell Biol 7:373–378. doi:10.1038/nrm1912. - DOI - PubMed
    1. Duncan RE, Ahmadian M, Jaworski K, Sarkadi-Nagy E, Sul HS. 2007. Regulation of lipolysis in adipocytes. Annu Rev Nutr 27:79–101. doi:10.1146/annurev.nutr.27.061406.093734. - DOI - PMC - PubMed
    1. Zechner R, Zimmermann R, Eichmann TO, Kohlwein SD, Haemmerle G, Lass A, Madeo F. 2012. Fat signals—lipases and lipolysis in lipid metabolism and signaling. Cell Metab 15:279–291. doi:10.1016/j.cmet.2011.12.018. - DOI - PMC - PubMed
    1. Fruhbeck G, Mendez-Gimenez L, Fernandez-Formoso JA, Fernandez S, Rodriguez A. 2014. Regulation of adipocyte lipolysis. Nutr Res Rev 27:63–93. doi:10.1017/S095442241400002X.5.5. - DOI - PubMed
    1. Brookheart RT, Michel CI, Schaffer JE. 2009. As a matter of fat. Cell Metab 10:9–12. doi:10.1016/j.cmet.2009.03.011. - DOI - PMC - PubMed

Publication types

LinkOut - more resources