

Population-specific social dynamics in chimpanzees
- PMID: 30397113
- PMCID: PMC6233085
- DOI: 10.1073/pnas.1722614115
Population-specific social dynamics in chimpanzees
Abstract
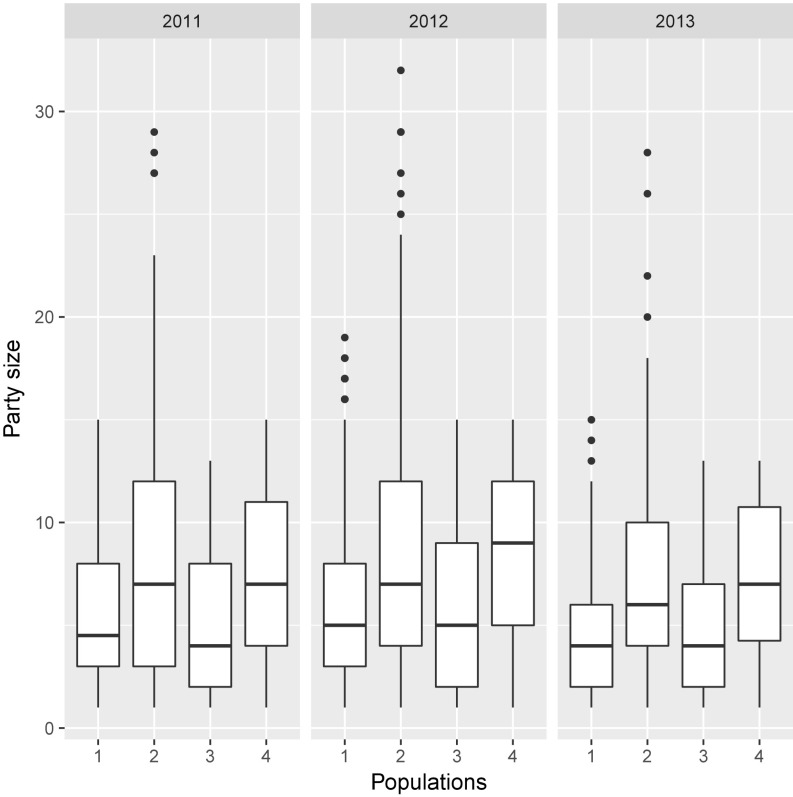
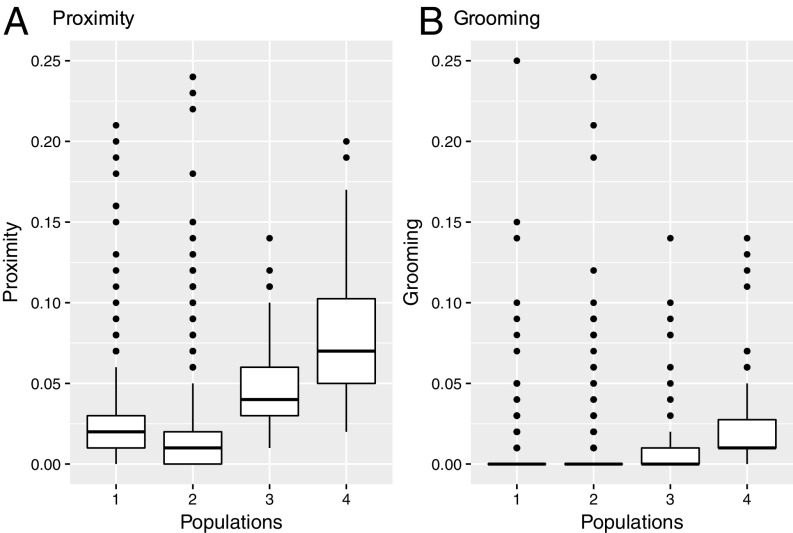
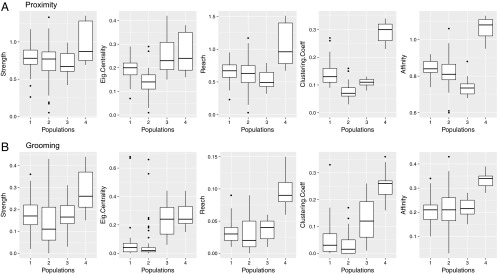
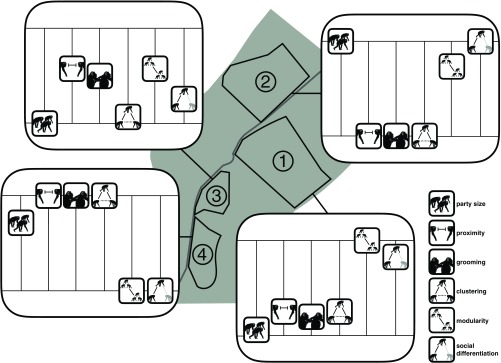
Understanding intraspecific variation in sociality is essential for characterizing the flexibility and evolution of social systems, yet its study in nonhuman animals is rare. Here, we investigated whether chimpanzees exhibit population-level differences in sociality that cannot be easily explained by differences in genetics or ecology. We compared social proximity and grooming tendencies across four semiwild populations of chimpanzees living in the same ecological environment over three consecutive years, using both linear mixed models and social network analysis. Results indicated temporally stable, population-level differences in dyadic-level sociality. Moreover, group cohesion measures capturing network characteristics beyond dyadic interactions (clustering, modularity, and social differentiation) showed population-level differences consistent with the dyadic indices. Subsequently, we explored whether the observed intraspecific variation in sociality could be attributed to cultural processes by ruling out alternative sources of variation including the influences of ecology, genetics, and differences in population demographics. We conclude that substantial variation in social behavior exists across neighboring populations of chimpanzees and that this variation is in part shaped by cultural processes.
Keywords: animal culture; behavioral diversity; chimpanzees; social learning; sociality.
Conflict of interest statement
The authors declare no conflict of interest.
Figures
Comment in
-
Reply to Farine and Aplin: Chimpanzees choose their association and interaction partners.Proc Natl Acad Sci U S A. 2019 Aug 20;116(34):16676-16677. doi: 10.1073/pnas.1905745116. Epub 2019 Aug 13. Proc Natl Acad Sci U S A. 2019. PMID: 31409702 Free PMC article. No abstract available.
-
Spurious inference when comparing networks.Proc Natl Acad Sci U S A. 2019 Aug 20;116(34):16674-16675. doi: 10.1073/pnas.1900143116. Epub 2019 Aug 13. Proc Natl Acad Sci U S A. 2019. PMID: 31409703 Free PMC article. No abstract available.
References
-
- Lott DF. Intraspecific variation in the social systems of wild vertebrates. Behaviour. 1984;88:266–325.
-
- Wrangham RW. An ecological model of female-bonded primate groups. Behaviour. 1980;75:262–300.
Publication types
MeSH terms
LinkOut - more resources
Full Text Sources
