

The role of parasitism in the energy management of a free-ranging bird
- PMID: 30397174
- PMCID: PMC6307876
- DOI: 10.1242/jeb.190066
The role of parasitism in the energy management of a free-ranging bird
Abstract
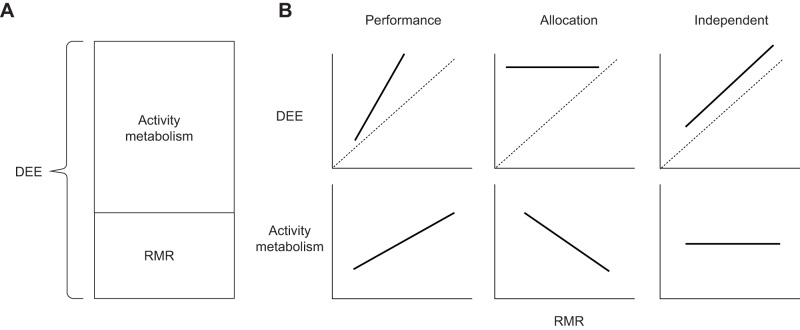
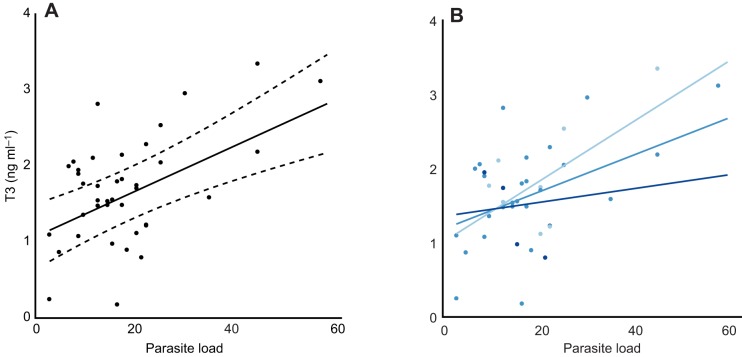
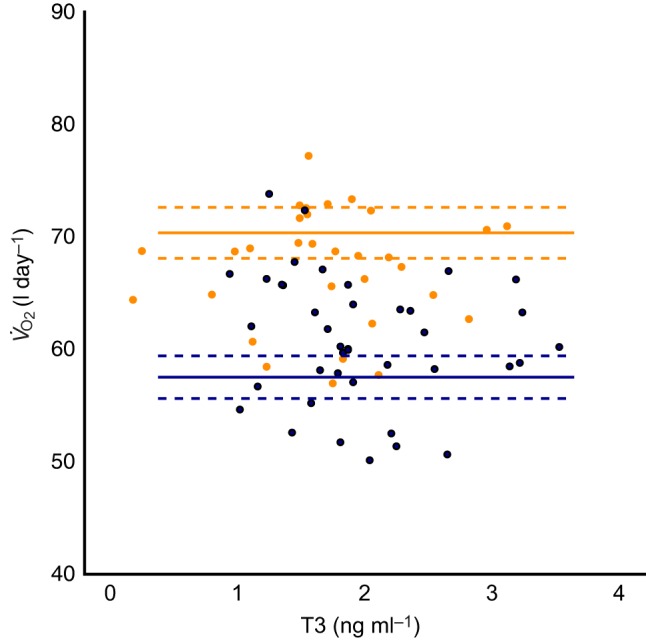
Parasites often prompt sub-lethal costs to their hosts by eliciting immune responses. These costs can be hard to quantify but are crucial to our understanding of the host's ecology. Energy is a fundamental currency to quantify these costs, as energetic trade-offs often exist between key fitness-related processes. Daily energy expenditure (DEE) comprises of resting metabolic rate (RMR) and energy available for activity, which are linked via the energy management strategy of an organism. Parasitism may play a role in the balance between self-maintenance and activity, as immune costs can be expressed in elevated RMR. Therefore, understanding energy use in the presence of parasitism enables mechanistic elucidation of potential parasite costs. Using a gradient of natural parasite load and proxies for RMR and DEE in a wild population of breeding European shags (Phalacrocorax aristotelis), we tested the effect of parasitism on maintenance costs as well as the relationship between proxies for RMR and DEE. We found a positive relationship between parasite load and our RMR proxy in females but not males, and no relationship between proxies for RMR and DEE. This provides evidence for increased maintenance costs in individuals with higher parasite loads and suggests the use of an allocation energy management strategy, whereby an increase to RMR creates restrictions on energy allocation to other activities. This is likely to have fitness consequences as energy allocated to immunity is traded off against reproduction. Our findings demonstrate that understanding energy management strategies alongside fitness drivers is central to understanding the mechanisms by which these drivers influence individual fitness.
Keywords: Accelerometry; Daily energy expenditure; Immune costs; Resting metabolic rate; Thyroid hormones; Trade-off.
© 2018. Published by The Company of Biologists Ltd.
Conflict of interest statement
Competing interestsThe authors declare no competing or financial interests.
Figures
Similar articles
-
Associations between Resting, Activity, and Daily Metabolic Rate in Free-Living Endotherms: No Universal Rule in Birds and Mammals.Physiol Biochem Zool. 2016 May-Jun;89(3):251-61. doi: 10.1086/686322. Epub 2016 Apr 14. Physiol Biochem Zool. 2016. PMID: 27153134
-
The energetic cost of parasitism in a wild population.Proc Biol Sci. 2018 May 30;285(1879):20180489. doi: 10.1098/rspb.2018.0489. Proc Biol Sci. 2018. PMID: 29848646 Free PMC article.
-
Energetic costs of diving and thermal status in European shags (Phalacrocorax aristotelis).J Exp Biol. 2005 Sep;208(Pt 18):3451-61. doi: 10.1242/jeb.01791. J Exp Biol. 2005. PMID: 16155218
-
Body size, energy metabolism and lifespan.J Exp Biol. 2005 May;208(Pt 9):1717-30. doi: 10.1242/jeb.01556. J Exp Biol. 2005. PMID: 15855403 Review.
-
Meta-analysis reveals that resting metabolic rate is not consistently related to fitness and performance in animals.J Comp Physiol B. 2021 Nov;191(6):1097-1110. doi: 10.1007/s00360-021-01358-w. Epub 2021 Mar 15. J Comp Physiol B. 2021. PMID: 33721034
Cited by
-
Chigger mite (Eutrombicula alfreddugesi) ectoparasitism does not contribute to sex differences in growth rate in eastern fence lizards (Sceloporus undulatus).Ecol Evol. 2023 Oct 11;13(10):e10590. doi: 10.1002/ece3.10590. eCollection 2023 Oct. Ecol Evol. 2023. PMID: 37829181 Free PMC article.
-
Sublethal effects of natural parasitism act through maternal, but not paternal, reproductive success in a wild population.Ecology. 2019 Aug;100(8):e02772. doi: 10.1002/ecy.2772. Epub 2019 Jul 10. Ecology. 2019. PMID: 31165474 Free PMC article.
-
Survival costs of reproduction are independent of energy costs in a seabird, the pelagic cormorant.Ecol Evol. 2024 Jul 23;14(7):e11414. doi: 10.1002/ece3.11414. eCollection 2024 Jul. Ecol Evol. 2024. PMID: 39045503 Free PMC article.
-
Crossed effects of helminth infection and lead exposure on fitness: An experimental study in feral pigeons (Columba livia).J Anim Ecol. 2024 Dec;93(12):1996-2009. doi: 10.1111/1365-2656.14211. Epub 2024 Oct 30. J Anim Ecol. 2024. PMID: 39473276 Free PMC article.
-
Resting costs too: the relative importance of active and resting energy expenditure in a sub-arctic seabird.J Exp Biol. 2022 Feb 15;225(4):jeb243548. doi: 10.1242/jeb.243548. Epub 2022 Feb 16. J Exp Biol. 2022. PMID: 35019973 Free PMC article.
References
-
- Abollo E., Gestal C. and Pascual S. (2001). Anisakid infection in the European shag Phalacrocorax aristotelis aristotelis. J. Helminthol. 75, 209-214. - PubMed
-
- Bates D., Mächler M., Bolker B. and Walker S. (2014). Fitting linear mixed-effects models using lme4. J. Stat. Softw. 67.
-
- Blackmer A. L., Mauck R. A., Ackerman J. T., Huntington C. E., Nevitt G. A. and Williams J. B. (2005). Exploring individual quality: basal metabolic rate and reproductive performance in storm-petrels. Behav. Ecol. 16, 906-913. 10.1093/beheco/ari069 - DOI
Publication types
MeSH terms
Associated data
LinkOut - more resources
Full Text Sources
