. 2018 Nov 5;9(1):4611.
doi: 10.1038/s41467-018-07038-8.

Potassium channel-based optogenetic silencing

Affiliations

Potassium channel-based optogenetic silencing

Yinth Andrea Bernal Sierra et al. Nat Commun. .

Abstract

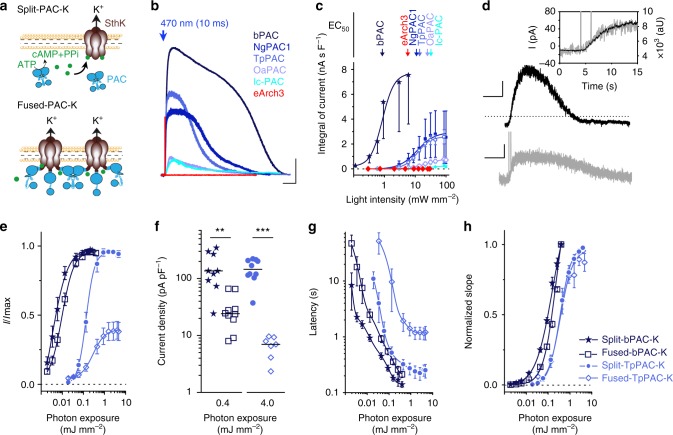
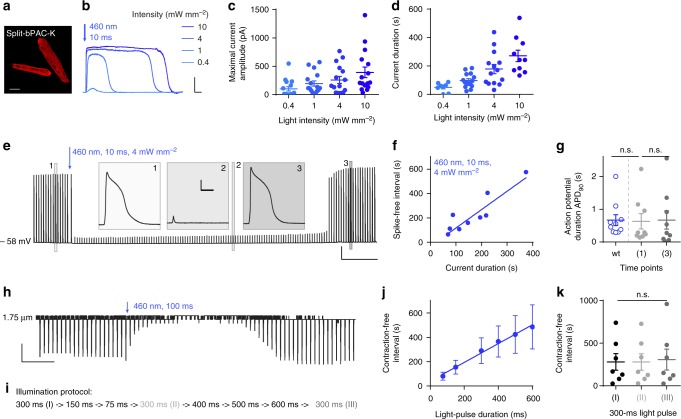
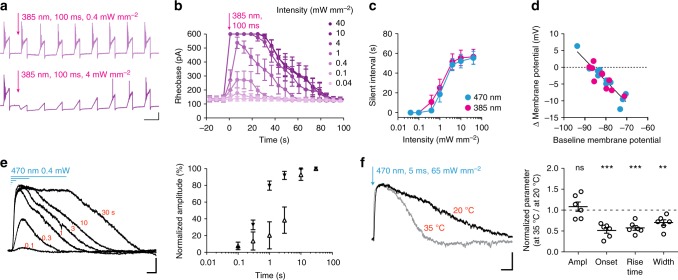
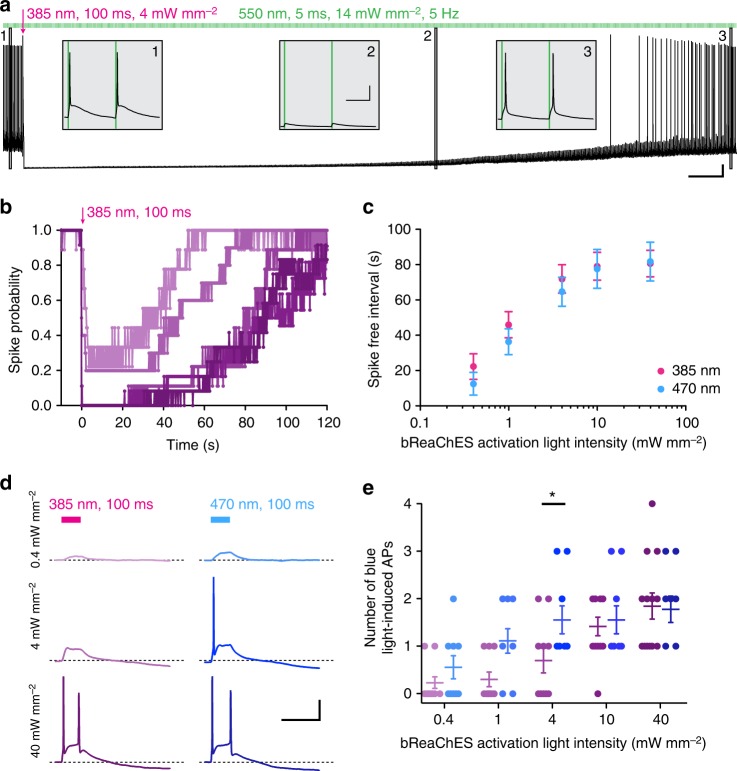
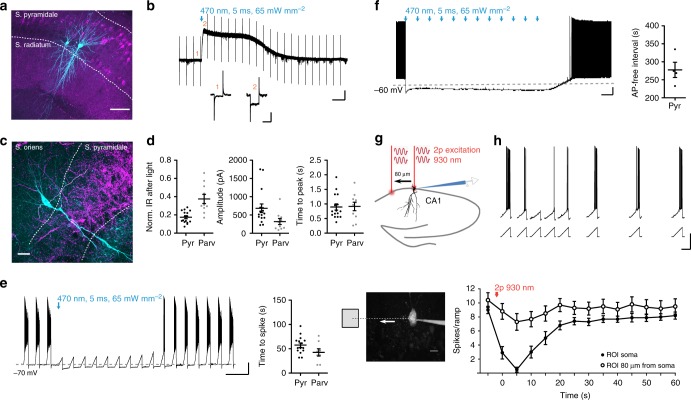
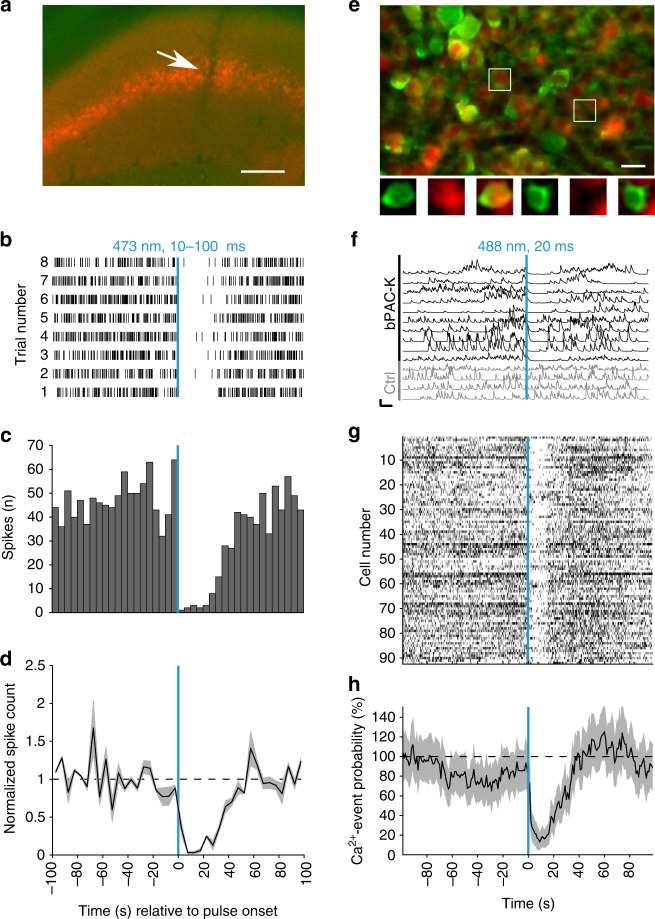
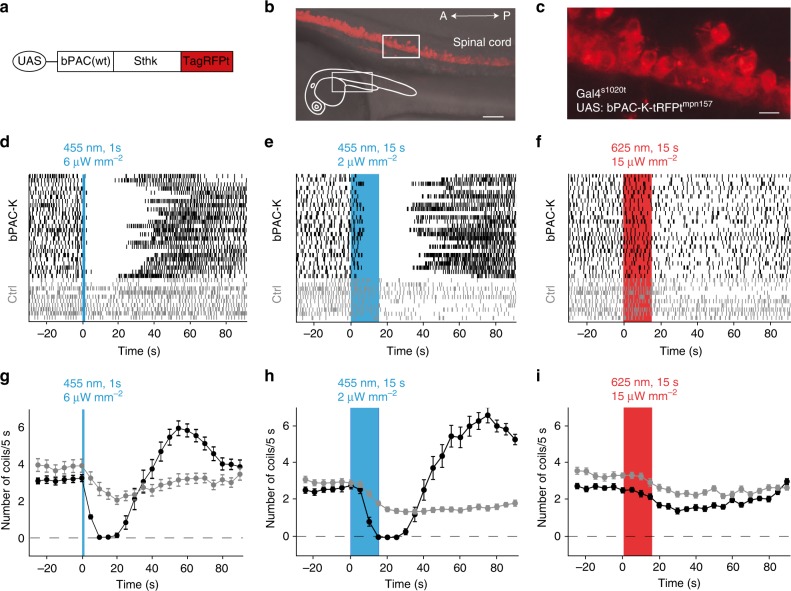
Optogenetics enables manipulation of biological processes with light at high spatio-temporal resolution to control the behavior of cells, networks, or even whole animals. In contrast to the performance of excitatory rhodopsins, the effectiveness of inhibitory optogenetic tools is still insufficient. Here we report a two-component optical silencer system comprising photoactivated adenylyl cyclases (PACs) and the small cyclic nucleotide-gated potassium channel SthK. Activation of this 'PAC-K' silencer by brief pulses of low-intensity blue light causes robust and reversible silencing of cardiomyocyte excitation and neuronal firing. In vivo expression of PAC-K in mouse and zebrafish neurons is well tolerated, where blue light inhibits neuronal activity and blocks motor responses. In combination with red-light absorbing channelrhodopsins, the distinct action spectra of PACs allow independent bimodal control of neuronal activity. PAC-K represents a reliable optogenetic silencer with intrinsic amplification for sustained potassium-mediated hyperpolarization, conferring high operational light sensitivity to the cells of interest.


Conflict of interest statement

The authors declare no competing interests.

Figures

Fig. 1
Fig. 1
Optogenetic activation of SthK channels by various PACs in cell lines. a Illustration of the split-PAC-K and fused-PAC-K construct design for SthK co-expression with PACs. b Photocurrents elicited by different split-PAC-K variants after 10 ms exposure to a 470 nm light pulse. Scale bars: 10 s, 0.5 nA. c Normalized integrals of photocurrents as a function of the intensity of a 10 ms light pulse. Arrows denote the EC50 for current activation by light (n = 3 cells, two cultures). d Combined whole-cell patch-clamp (black) and optical recording (gray) of a HEK 293 cell expressing fused-bPAC-K and a fluorescent cAMP sensor. bPAC was excited with two 1 ms light flashes (470 nm). The dotted line indicates the zero current level. Scale bars: 20 s, 20 pA (upper trace); 20 s, 2000 aU (lower trace). e Comparison of photocurrent amplitudes generated by bPAC or TpPAC and SthK as split or fused constructs. f Current density comparison at saturating photon exposures (**p < 0.01; ***p = 0.0001, Wilcoxon rank sum test). g, h Latency and photocurrent rise upon excitation with blue light at different photon densities. In eh, bPAC and TpPAC were activated for 10 and 100 ms, respectively (split-bPAC-K: n = 9, four cultures; fused-bPAC-K and split-TpPAC-K: n = 10, three cultures; fused-TpPAC-K: n = 8, five cultures). Error bars in all graphs represent SD
Fig. 2
Fig. 2
Split-bPAC-K efficiently silences primary ventricular cardiomyocytes. a Fluorescence of split-bPAC-K-mCherry expressed in cultured ventricular cardiomyocytes from rabbit. Scale bar: 20 µm. b, c Photocurrents and quantification of current amplitudes in isolated cardiomyocytes following blue light stimulation at different light intensities (n = 16 cells, seven cultures). Scale bars: 30 s, 100 pA. d Quantification of split-bPAC-K-mediated photocurrent duration (time from current onset to 50% current decline after maximum) at different intensities (n > 11 cells, 3–10 cultures). e Inhibition of electrically evoked APs (10 ms current ramp) by blue light pulse. Insets display response to electrical stimulation at three indicated time points. Scale bars: 30 s, 20 mV (overview trace); 100 ms, 20 mV (insets). f Duration of AP-free interval after split-bPAC-K activation by 10 ms light pulse as a function of corresponding photocurrent duration (460 nm, 4 mW mm−2) (n = 9, six cultures). g Quantification of AP duration (APD90) of wildtype (wt) and PAC-K expressing cardiomyocytes before and after light application (n = 9–10, four cultures). APD90 before light (time point 1 in d) is not significantly different from APD90 after inhibition (time point 3 in d) (p = 0.3, paired two-tailed t-test) and APD90 of untransduced control cells (p = 0.9, unpaired two-tailed t-test) h Light-induced suppression of field stimulation-evoked cardiomyocyte contractions. Scale bars: 30 s, 0.05 µm. i Illumination protocol for consecutive inhibition of cardiomyocyte contractions. j Contraction-free intervals as a function of duration of activating light pulses (n = 7, three cultures). k The duration of the contraction-free interval induced by a 300-ms light pulse applied three times over the course of the test protocol (I–III in i) is not significantly different (n = 7, three cultures; p(II vs. I) = 1.0, p(III vs. I) = 0.5, one-way repeated measures ANOVA, Dunnett test). Error bars represent SEM
Fig. 3
Fig. 3
Split-bPAC-K-mediated silencing of neurons. a Example traces illustrating light intensity-dependent inhibition of current ramp-driven AP firing in a neuron expressing split-bPAC-K. Scale bars: 5 s, 20 mV. b Changes in the rheobase following split-bPAC-K activation (n = 7–8, three cultures; 600 pA reflects no spike). c The intensity of the bPAC activation light determined the duration of spike-free intervals (n = 7–8, three cultures). d Correlation of the extent of membrane potential changes induced by split-bPAC-K activation with the resting membrane potential before the light pulse (Pearson correlation, two-tailed: p < 0.0001, R2 = 0.83). Data was pooled from experiments with 470 and 385 nm at 10 and 40 mW mm−2. e Light pulse duration-dependent peak currents at light intensities of 0.4 mW mm−2 (filled triangles) or 0.04 mW mm−2 (open triangles; n = 5–7, two cultures). f Example traces of the SthK current recorded at near-physiological temperature (35 °C) or at room temperature (20 °C) from the same cell. The sequence of recordings at high and low temperatures was randomized between cells, and parameters were normalized to room-temperature conditions for each neuron (n = 6, three cultures). One sample t-test: **p < 0.01; ***p < 0.001, ns: not significant. Scale bars in e and f: 5 s, 100 pA. Error bars in all graphs represent SEM
Fig. 4
Fig. 4
Bimodal optogenetic control of neurons expressing split-bPAC-K and red-shifted channelrhodopsins. a Dual-color optogenetic control with AP induction by bReaChES activation using 5 ms of 550 nm light at 5 Hz and split-bPAC-K-mediated hyperpolarization. Insets show currents preceding split-bPAC-K activation and currents at 18 and 95 s post-illumination. Scale bars: 5 s, 10 mV (overview trace); 100 ms, 20 mV (insets). b Intensity-dependent spike suppression of green light-triggered APs by 385 nm light (n = 9–12, five cultures; no error bars shown for clarity). c The duration of the spike-free interval in two-color excitation/inhibition experiments was independent of the wavelength used for split-bPAC-K activation (385 nm: n = 9–12, five cultures; 470 nm: n = 9, three cultures). d Intensity and wavelength-dependent cross activation of bReaChES by blue light. Dashed lines indicate resting membrane potential before the light pulse. Scale bars: 200 ms, 20 mV. e AP firing evoked by activation of bReaChES with 385 or 470 nm light was minimized when using low light intensities for bPAC activation (385 nm: n = 10–13, five cultures; 470 nm: n = 9, three cultures; Bonferroni’s multiple comparison test, *p < 0.05). Error bars represent SEM
Fig. 5
Fig. 5
Silencing of neuronal activity in hippocampal slices. a Split-bPAC-K-mCherry-expressing pyramidal cells in area CA1. Recorded cells were filled with biocytin (green). Scale bar: 100 µm. b Blue light elicited outward current in a split-bPAC-K-positive pyramidal cell. Inset shows test pulse before (1) and after the light pulse (2). Scale bars: 10 s, 100 pA (overview trace); 50 ms, 100 pA (test pulses). c split-bPAC-K-mCherry expression in hippocampal slice of a parvalbumin-Cre transgenic mouse. Note the dense mCherry labeling in stratum pyramidale showing axons from parvalbumin-positive interneurons. Scale bar: 25 µm. d Quantification of the light-induced reduction in input resistance (IR), hyperpolarizing current amplitude, and time to peak after light pulse (pyramidal neurons: n = 16 from two mice; interneurons: n = 10 from three mice). e Suppression of current ramp-elicited APs by illumination. In pyramidal cells and parvalbumin-Cre+ interneurons, first spikes reappeared after 58 ± 5 and 43 ± 7 s, respectively (pyramidal neurons: n = 15 from two mice; interneurons: n = 8 from three mice). Scale bars: 10 s, 20 mV. f Repetitive illumination (every 20 s for 5 ms) caused long-lasting but reversible inhibition of constant current-elicited spiking (n = 4, one mouse). Scale bars: 20 s, 10 mV. g Two-photon activation of fused-bPAC-K in CA1 neurons. The two-photon laser was either positioned over the soma of a fused-bPAC-K-positive neuron, or shifted ~80 µm to an adjacent area. Scale bar: 10 µm. h Inhibition of firing by the two-photon beam pointing at the soma (closed circles) or shifted from the soma (open circles, n = 10, three mice). Data in panel af was obtained with split-bPAC-K, while data in panel g and h was obtained with fused-bPAC-K. Scale bars: 1 s, 25 mV. Error bars in all graphs represent SEM
Fig. 6
Fig. 6
In vivo inhibition by the PAC-K silencer in mice. a Silicon probe track (arrow) in CA1 expressing split-bPAC-K/mCherry (red) in stratum pyramidale. Scale bar: 200 µm. b Multi-unit activity recorded under urethane anesthesia was strongly reduced following blue light application. Each trial represents a single light pulse (10 or 100 ms) and spikes (black lines) before and after this pulse. c Spike count histogram for spikes shown in b, summed over all trials (5 s time bins) from one recording. d Normalized spike counts averaged for three recorded mice. e In vivo two-photon image of CA1 pyramidal cells expressing GCaMP6s (green) and mCherry (red) indicating fused-bPAC-K-positive cells. Scale bar: 20 µm. Close-up views show a cell expressing both GCaMP6s and fused-bPAC-K/mCherry (left), and a cell expressing only GCaMP6s (right). f Representative Ca2+ fluorescence traces for individual pyramidal cells expressing fused-bPAC-K, and bPAC-K-negative cells (Ctrl). Scale bars: 10 s, 100% ΔF/F. g Scatter plot of Ca2+ event onsets for 92 bPAC-K-expressing cells contained in a single field of view, overlaid for five successive trials. h Overall probability of Ca2+ events after light stimulation recorded from 274 fused-bPAC-K-positive cells (n = 4 mice). Error bars represent SEM
Fig. 7
Fig. 7
In vivo inhibition of coiling activity of zebrafish using fused-bPAC-K. a Schematic representation of the construct injected to generate the UAS:bPAC-SthK-tRPFtmpn157 transgenic line. The transgenic zebrafish expresses a fusion protein of bPAC(wt), SthK, and tagRFPt under the control of UAS. b Expression of bPAC-SthK-tRFPt in the spinal cord of a 24 h post-fertilization Gal4s1020t, UAS:bPAC-Sthk-tRFPtmpn157 embryo. Scale bar: 50 µm. c High magnification of the spinal cord in fused-bPAC-K transgenic zebrafish. Scale bar: 10 µm. df Raster plots of coiling events in 25 fused-bPAC-K transgenic embryos (black) and 10 non-expressing embryos from the same clutch (gray) before, during, and after illumination with blue or red light. gi Average number of coils per 5 s over three replicates in fused-bPAC-SthK-positive (black) and non-expressing (gray) embryos. All zebrafish embryos show low-level photoinhibition of motor responses due to endogenous light sensitivity. Error bars represent SEM

Comment in

References

    1. Rajasethupathy P, Ferenczi E, Deisseroth K. Targeting neural circuits. Cell. 2016;165:524–534. doi: 10.1016/j.cell.2016.03.047. - DOI - PMC - PubMed
    1. Arrenberg AB, Stainier DY, Baier H, Huisken J. Optogenetic control of cardiac function. Science. 2010;330:971–974. doi: 10.1126/science.1195929. - DOI - PubMed
    1. Chow BY, et al. High-performance genetically targetable optical neural silencing by light-driven proton pumps. Nature. 2010;463:98–102. doi: 10.1038/nature08652. - DOI - PMC - PubMed
    1. Ihara K, et al. Evolution of the archaeal rhodopsins: evolution rate changes by gene duplication and functional differentiation. J. Mol. Biol. 1999;285:163–174. doi: 10.1006/jmbi.1998.2286. - DOI - PubMed
    1. Zhang F, et al. Multimodal fast optical interrogation of neural circuitry. Nature. 2007;446:633–639. doi: 10.1038/nature05744. - DOI - PubMed

Publication types

MeSH terms

LinkOut - more resources