. 2018 Nov 5;9(1):4621.
doi: 10.1038/s41467-018-07049-5.

Changes in human footprint drive changes in species extinction risk

Affiliations

Changes in human footprint drive changes in species extinction risk

Moreno Di Marco et al. Nat Commun. .

Abstract

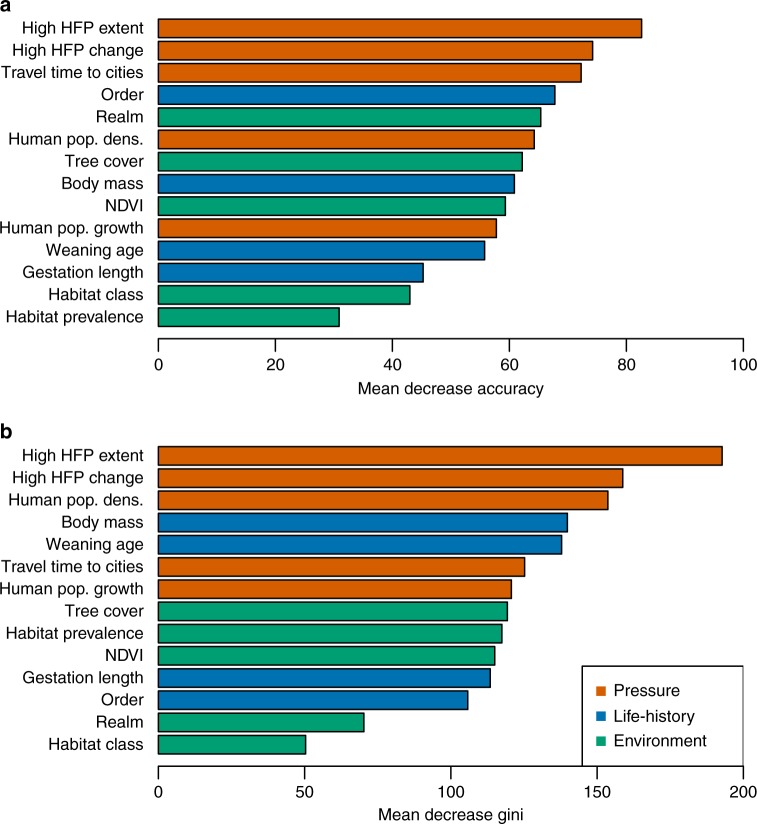
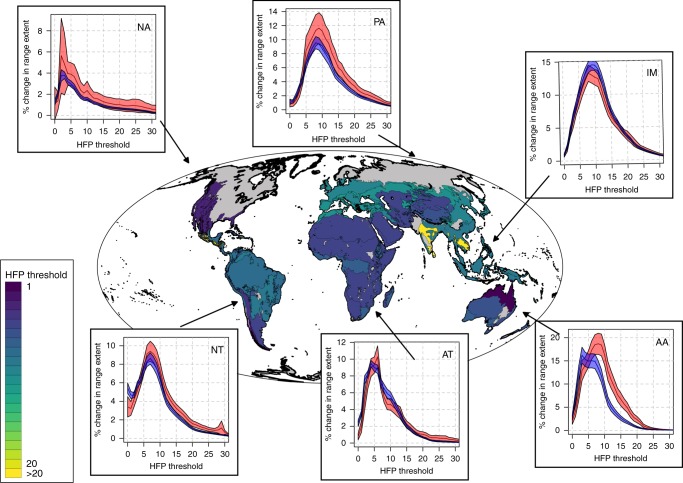
Predicting how species respond to human pressure is essential to anticipate their decline and identify appropriate conservation strategies. Both human pressure and extinction risk change over time, but their inter-relationship is rarely considered in extinction risk modelling. Here we measure the relationship between the change in terrestrial human footprint (HFP)-representing cumulative human pressure on the environment-and the change in extinction risk of the world's terrestrial mammals. We find the values of HFP across space, and its change over time, are significantly correlated to trends in species extinction risk, with higher predictive importance than environmental or life-history variables. The anthropogenic conversion of areas with low pressure values (HFP < 3 out of 50) is the most significant predictor of change in extinction risk, but there are biogeographical variations. Our framework, calibrated on past extinction risk trends, can be used to predict the impact of increasing human pressure on biodiversity.


Conflict of interest statement

The authors declare no competing interests.

Figures

Fig. 1
Fig. 1
Classification of species extinction risk transitions, based on past and present IUCN Red List categories*. Low-risk transitions include those species that were of least concern throughout the study period, together with species that moved from any higher category of threat to a lower one. High-risk transitions include all species that were originally threatened or near threatened and retained their category throughout the study period, together with species that moved from any lower category of threat to a higher category. *Acronyms for the Red List categories: Least Concern (LC); Near Threatened (NT); Vulnerable (VU); Endangered (EN); Critically Endangered (CR)
Fig. 2
Fig. 2
Recent changes in terrestrial human footprint and species extinction risk. a Shows a transition matrix in which any position represents the initial (x axis) and final (y axis) human footprint value (from 0 to 50) of global 1 km terrestrial grid cells; the colour scheme represents the number of individual cells in each particular transition state. b Shows a transition matrix in which any position represents the initial (x axis) and final (y axis) extinction risk category (from Least Concern to Extinct) of terrestrial mammal species; the colour scheme represent the number of individual species in each particular transition state
Fig. 3
Fig. 3
Cumulative extent of human footprint values within mammal species ranges. The lines represent the cumulative percentage of species range that overlaps with increasing values of human footprint, averaged among all species. Different lines refer to species in the low-risk or high-risk categories, for the period 1993 or 2009, as reported in legend
Fig. 4
Fig. 4
Changes in the overlap between species ranges and high human footprint values over time. The lines report the average change in the overlap between species ranges and human footprint values bigger than any given threshold. Different lines refer to species in the low-risk or high-risk categories, as reported in legend. The shaded areas around the lines represent the 95% standard credible interval measured across a total of 4421 species
Fig. 5
Fig. 5
Predictive importance of variables for the prediction of extinction risk transitions in terrestrial mammals. Variables are colour-coded according to their broad class (human pressure, life-history, environmental characteristics). Different plots refer to different measures of variable importance: variable effect on the overall decrease in prediction accuracy, and b contribution of the variable to decrease Gini Index during the classification routine. A description of all the variables can be found in Table 1. In this analysis, “high HFP" included values of 3 or above
Fig. 6
Fig. 6
Changes in the overlap between species ranges and high human footprint (HFP) values for each biogeographic realm*. The underlying map reports, for each biome within each realm, the threshold at which change in HFP values is the highest for high-risk species. The plots report the average change in the overlap between species ranges and HFP values bigger than a given threshold within each realm (with high-risk species in red and low-risk species in blue). The shaded areas around the lines in the plots represent the 95% standard credible interval measured across a total of: 493 AA species, 854 AT species, 604 IM species, 259 NA species, 949 NT species, 442 PA species*. *Realm acronyms: AA Australasia, AT Afrotropical, IM Indomalay, NA Nearctic, NT Neotropical, PA Palearctic

References

    1. De Vos JM, Joppa LN, Gittleman JL, Stephens PR, Pimm SL. Estimating the normal background rate of species extinction. Conserv. Biol. 2015;29:452–462. doi: 10.1111/cobi.12380. - DOI - PubMed
    1. Brook BW, Sodhi NS, Bradshaw CJA. Synergies among extinction drivers under global change. Trends Ecol. Evol. 2008;23:453–460. doi: 10.1016/j.tree.2008.03.011. - DOI - PubMed
    1. Murray KA, Verde Arregoitia LD, Davidson A, Di Marco M, Di Fonzo MMI. Threat to the point: improving the value of comparative extinction risk analysis for conservation action. Glob. Chang. Biol. 2014;20:483–494. doi: 10.1111/gcb.12366. - DOI - PubMed
    1. Purvis A, Gittleman JL, Cowlishaw G, Mace GM. Predicting extinction risk in declining species. Proc. R. Soc. Lond. B. 2000;267:1947–1952. doi: 10.1098/rspb.2000.1234. - DOI - PMC - PubMed
    1. Fisher DO, Blomberg SP, Owens IPF. Extrinsic versus intrinsic factors in the decline and extinction of Australian marsupials. Proc. R. Soc. B. 2003;270:1801–1808. doi: 10.1098/rspb.2003.2447. - DOI - PMC - PubMed

Publication types