. 2018 Nov 5;8(1):16342.
doi: 10.1038/s41598-018-34211-2.

Angiotensin II-induced hypertension in rats is only transiently accompanied by lower renal oxygenation

Affiliations

Angiotensin II-induced hypertension in rats is only transiently accompanied by lower renal oxygenation

Tonja W Emans et al. Sci Rep. .

Abstract

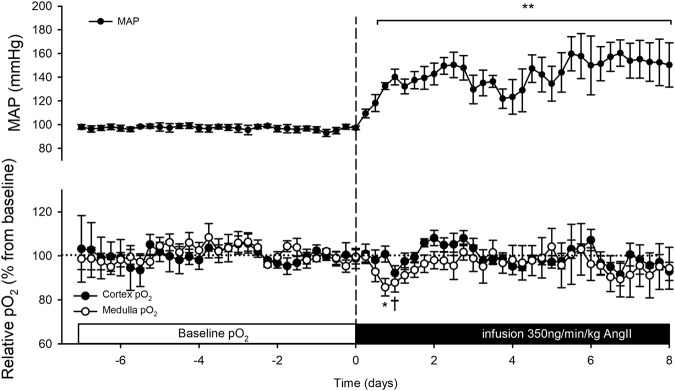
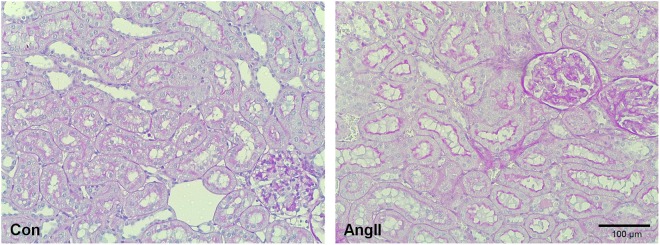
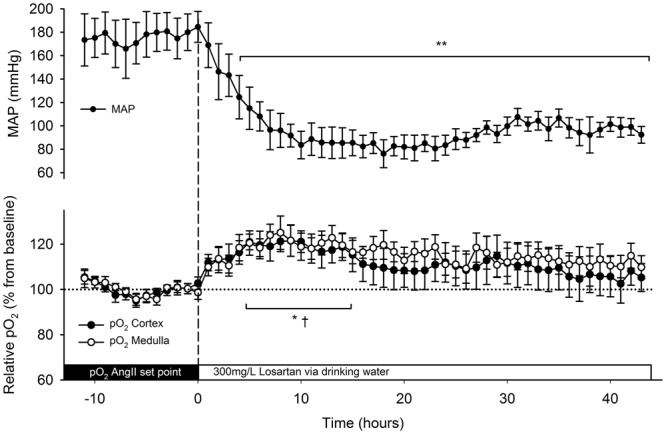
Activation of the renin-angiotensin system may initiate chronic kidney disease. We hypothesised that renal hypoxia is a consequence of hemodynamic changes induced by angiotensin II and occurs prior to development of severe renal damage. Male Sprague-Dawley rats were infused continuously with angiotensin II (350 ng/kg/min) for 8 days. Mean arterial pressure (n = 5), cortical (n = 6) and medullary (n = 7) oxygenation (pO2) were continuously recorded by telemetry and renal tissue injury was scored. Angiotensin II increased arterial pressure gradually to 150 ± 18 mmHg. This was associated with transient reduction of oxygen levels in renal cortex (by 18 ± 2%) and medulla (by 17 ± 6%) at 10 ± 2 and 6 ± 1 hours, respectively after starting infusion. Thereafter oxygen levels normalised to pre-infusion levels and were maintained during the remainder of the infusion period. In rats receiving angiotensin II, adding losartan to drinking water (300 mg/L) only induced transient increase in renal oxygenation, despite normalisation of arterial pressure. In rats, renal hypoxia is only a transient phenomenon during initiation of angiotensin II-induced hypertension.


Conflict of interest statement

The authors declare no competing interests.

Figures

Figure 1
Figure 1
Cortical and medullary oxygenation (pO2) and mean arterial pressure (MAP) during 8 days of angiotensin II (AngII) infusion. Osmotic minipumps were implanted to start 350 ng/kg/min AngII infusion (dashed line). Telemetric recordings of cortical (closed circles, n = 6) and medullary (open circles, n = 7) pO2 were recorded continuously. Values are expressed as a percentage of the baseline period before AngII infusion. MAP was determined by telemetry (dots, n = 5) in another subset of animals. Data is presented as mean of 6 h averages ± SEM. *p ≤ 0.05 in medulla, p ≤ 0.05 in cortex, **p ≤ 0.01, all vs. baseline.
Figure 2
Figure 2
Chronic angiotensin II (AngII) infusion and hydralazine. (A) Cortical (n = 6, closed circles) and medullary (n = 7, open circles) oxygenation (pO2) and mean arterial pressure (MAP) (n = 5, dots) during the early phase of AngII infusion. Osmotic minipumps were implanted to start 350 ng/kg/min AngII infusion (dashed line). Values are expressed as a percentage of the baseline period before AngII infusion. Data is presented as mean of 1 h averages ± SEM. (B) Medullary (n = 3) pO2 during hydralazine administration (5–25 mg/kg/day) only or in combination with AngII infusion (350 ng/kg/min). Data is presented as mean of 1 h averages ± SD. Telemetric recordings were recorded continuously. (A,B) were derived from different subsets of animals.
Figure 3
Figure 3
Renal morphology. Representative photomicrographs of periodic acid Schiff stained renal sections of control (Con, left) and angiotensin II-infused (AngII, right) rats. Mild fibrosis was observed in the cortex of AngII treated rats.
Figure 4
Figure 4
Relation between mean arterial pressure (MAP) and oxygenation (pO2) in cortex and medulla. In matched periods of 15 min. mean pO2 and mean MAP were paired during a baseline period (day -4 to -1, open circles) and during angiotensin II (AngII) infusion (day 3 to 6, closed circles). The characteristic association between MAP and pO2, observed during control conditions, disappeared in both cortex and medulla during AngII infusion. ANCOVA: p < 0.001 vs. baseline.
Figure 5
Figure 5
Cortical and medullary oxygenation (pO2) and mean arterial pressure (MAP) during angiotensin II (AngII) infusion plus oral losartan for 48 hours. Losartan was added to the drinking water (300 mg/L, dashed line). Telemetric measurements of cortical (closed circles) and medullary (open circles) pO2 were recorded continuously. Values are expressed as a percentage of the 12h-period before losartan. MAP was determined telemetrically (dots) in another subset of animals. Data is presented as mean of 1 h averages ± SEM. *p ≤ 0.05 in medulla, p ≤ 0.05 in cortex, **p ≤ 0.01, all vs. the average of the 12 hours prior to losartan (set point).

References

    1. Fine LG, Orphanides C, Norman JT. Progressive renal disease: the chronic hypoxia hypothesis. Kidney Int Suppl. 1998;65:S74–78. - PubMed
    1. Nangaku M. Chronic hypoxia and tubulointerstitial injury: a final common pathway to end-stage renal failure. J Am Soc Nephrol. 2006;17:17–25. doi: 10.1681/ASN.2005070757. - DOI - PubMed
    1. Fine LG, Bandyopadhay D, Norman JT. Is there a common mechanism for the progression of different types of renal diseases other than proteinuria? Towards the unifying theme of chronic hypoxia. Kidney Int Suppl. 2000;75:S22–26. doi: 10.1046/j.1523-1755.2000.07512.x. - DOI - PubMed
    1. Welch WJ, Baumgartl H, Lubbers D, Wilcox CS. Nephron pO2 and renal oxygen usage in the hypertensive rat kidney. Kidney Int. 2001;59:230–237. doi: 10.1046/j.1523-1755.2001.00483.x. - DOI - PubMed
    1. Manotham K, et al. Evidence of tubular hypoxia in the early phase in the remnant kidney model. J Am Soc Nephrol. 2004;15:1277–1288. doi: 10.1097/01.ASN.0000125614.35046.10. - DOI - PubMed

Publication types

Substances