. 2018 Nov 5;8(1):16338.
doi: 10.1038/s41598-018-34612-3.

Aberrant DNA methylation of Tgfb1 in diabetic kidney mesangial cells

Affiliations

Aberrant DNA methylation of Tgfb1 in diabetic kidney mesangial cells

Shigeyoshi Oba et al. Sci Rep. .

Abstract

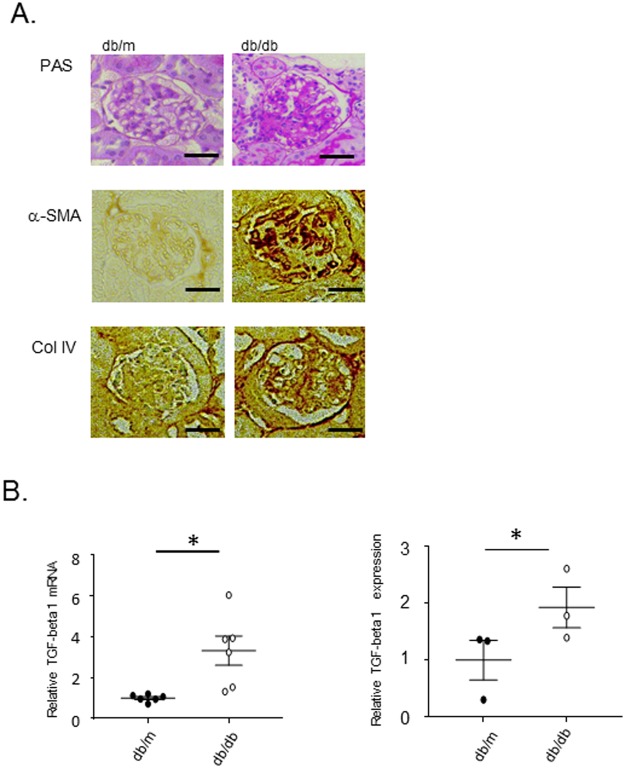
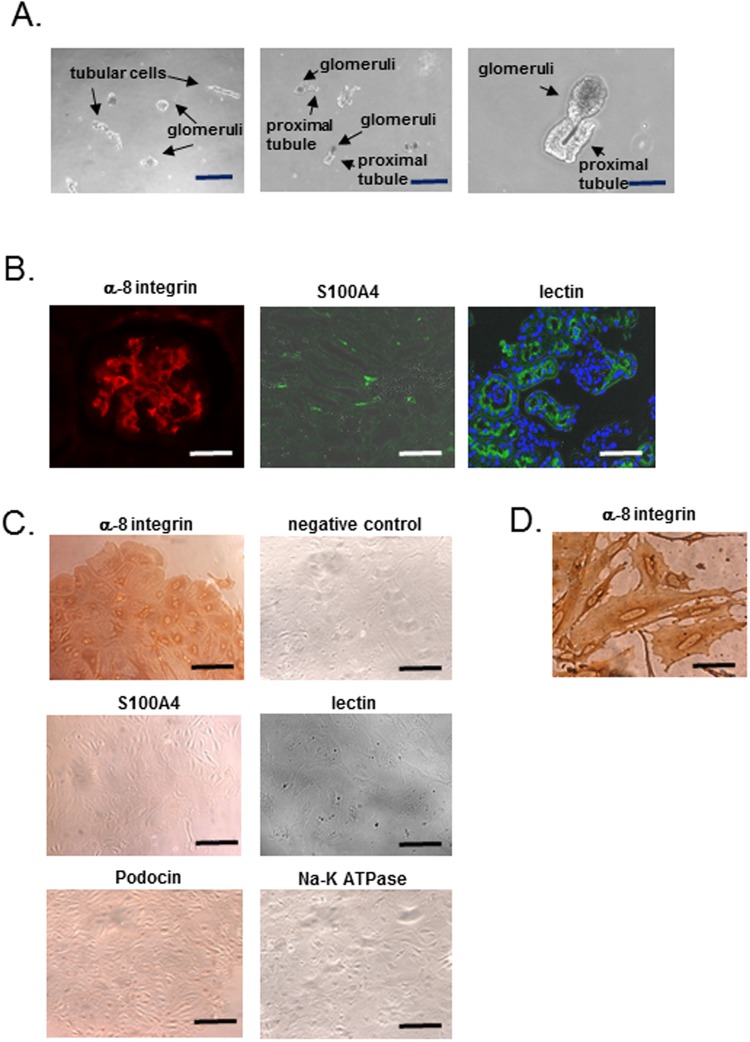
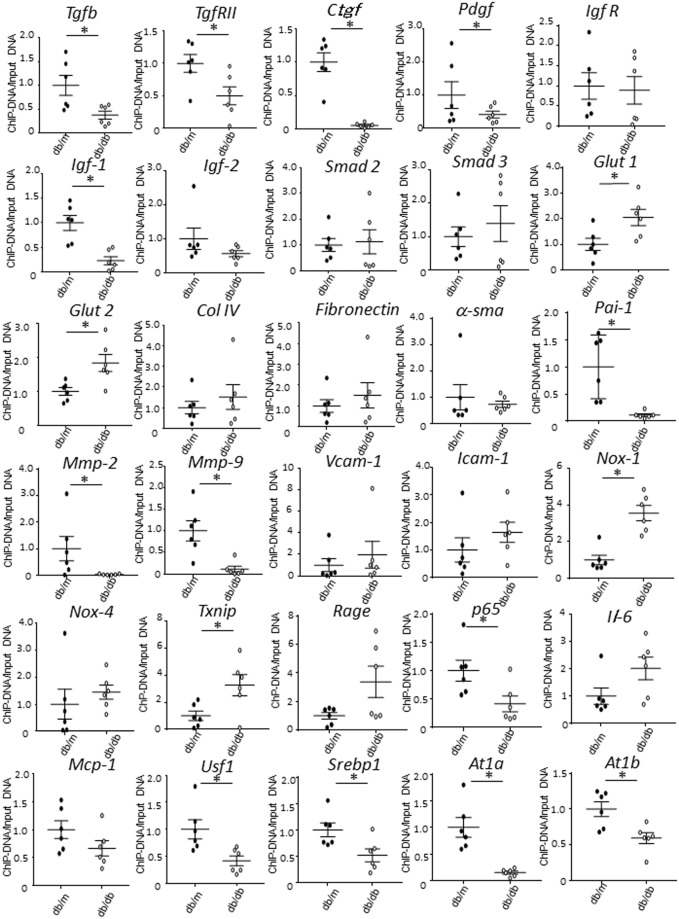
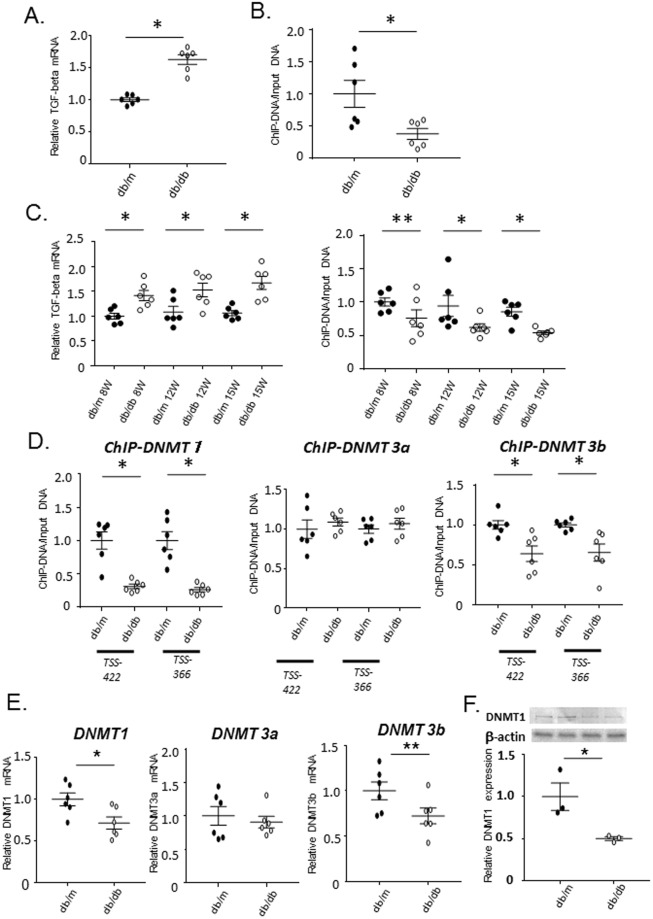
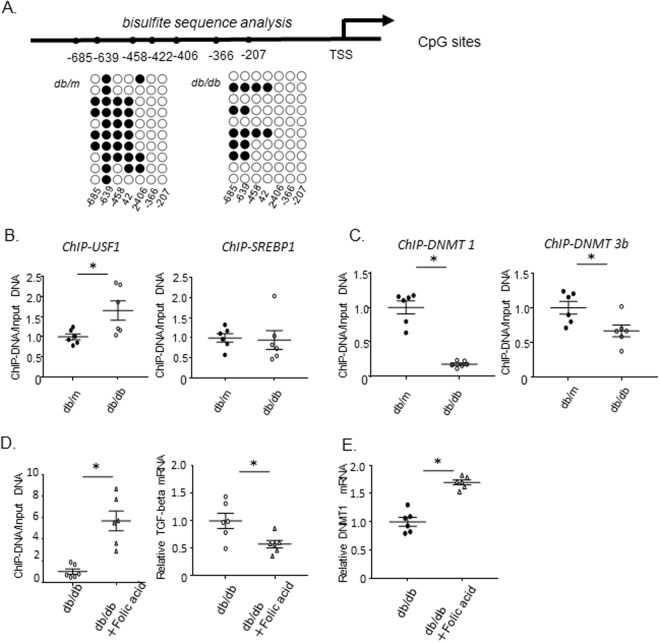
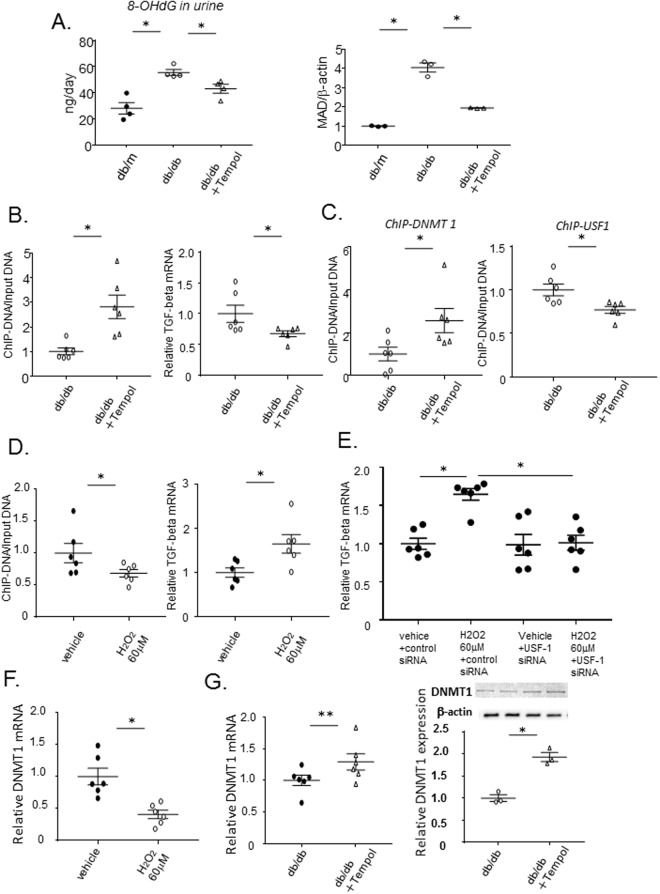
Epigenetic modulation may underlie the progression of diabetic nephropathy (DN). Involvement of TGFB1 in mesangial fibrosis of DN led us to hypothesize that Tgfb1 DNA demethylation contributes to progression of DN. In primary mesangial cells from diabetic (db/db) mouse kidneys, demethylation of Tgfb1 DNA and upregulation of Tgfb1 mRNA progressed simultaneously. USF1 binding site in Tgfb1 promoter region were demethylated, and binding of USF1 increased, with decreased binding of DNMT1 in db/db compared with control. Given downregulation of Tgfb1 expression by folic acid, antioxidant Tempol reversed DNA demethylation, with increased and decreased recruitment of DNMT1 and USF1 to the promoter, resulting in decreased Tgfb1 expression in db/db mice. Addition of H2O2 to mesangial cells induced DNA demethylation and upregulated Tgfb1 expression. Finally, Tempol attenuated mesangial fibrosis in db/db mice. We conclude that aberrant DNA methylation of Tgfb1 due to ROS overproduction play a key to mesangial fibrosis during DN progression.


Conflict of interest statement

The authors declare no competing interests.

Figures

Figure 1
Figure 1
Mesangial cell fibrosis and upregulation of TGFB1 expression in db/db mice. (A) PAS staining and representative images of immunostaining of α−smooth muscle actin (α-SMA) and type IV collagen (Col IV) in glomeruli from 15-week-old db/m, db/db, Mesangial cell fibrosis and the expression of α-SMA and Col IV are significantly increased in db/db mice compared to db/m mice. (B) Real-time PCR of Tgfb1 mRNA (normalized to Gapdh) and the results of immunoblotting of TGFB1 (normalized to beta-actin) in whole kidneys of 15-week-old db/m, db/db mice. The expression of Tgfb1 mRNA and TGFB1 protein in db/db mice significantly higher than that in db/m mice. Data represent the mean ± SEM. n = 6. Filled circles: db/m mice; open circles: db/db mice. Original gel image of western blot analysis are presented in Supplemental Fig. 4.
Figure 2
Figure 2
Characterization of primary culture cells. (A) The observation of sieving sample under phase-contrast microscope. The sieving sample contains glomeruli and other cells such as tubular cells. Right panel shows sieving sample containing glomeruli connected to proximal tubules. Scale bar, 20 µm (left and middle panel), 8 µm (right panel). (B) Immunofluorescent staining of α-8 integrin (mesangial cell marker) and S100A4 (fibroblast marker) in kidneys of C57BL/6 J mice. A glomerulus contains cells with positive staining for α-8 integrin, and some cells with positive staining for S100A are observed in glomeruli and tubulo-interstitial cells. Right panel shows proximal tubular cells and their cells invaginated into parietal layer of Bowman’s capsule with the positive staining for lotus tetragonolobus lectin. Scale bar, 20 µm (left panel), 7 µm (middle and right panel). (C) Immunohistochemistry of α-8 integrin, S100A4 with the negative control, podocin (podocyte marker), Na-K ATPase (tubular cell marker) and fluorescence of lotus tetragonolobus lectin (proximal tubular cell marker) in mesangial primary culture cells. All most of the primary cultured cells exhibit positive staining for α-8 integrin but negative staining for the other markers. Scale bar, 20 µm. (D) High magnification of α-8 integrin staining. The cells after primary culture included an irregular shape and flattened-cylinder-like cell bodies, typical of mesangial cells. Scale bar, 4 µm.
Figure 3
Figure 3
Change of DNA methylation status of fibrosis related genes in mesangial cells of db/m and db/db mice. Data represent the mean ± SEM. n = 6. Filled circles: db/m mice; open circles: db/db mice.
Figure 4
Figure 4
DNA demethylation and upregulation of Tgfb1 in mesangial cells of db/db mice. (A) Real-time PCR of Tgfb1 mRNA (normalized to Gapdh) in primary cultured mesangial cells from db/m and db/db mice. Open circle: The expression of Tgfb1 mRNA in db/db mice significantly higher than that in db/m mice. Data represent the mean ± SEM. n = 6. Filled circles: db/m mice; open circles: db/db mice. (B) Quantitation of DNA methylation (using a MethylCollector Ultra kit) in mesangial cells from 15-week-old db/m controls and db/db mice. Results of amplification from the −422 bp relative to the transcription start site (TSS) regions are shown. DNA methylation of db/db mice is significantly lower than that of db/m mice. n = 6. (C) Time course real-time PCR experiments demonstrating Tgfb1 mRNA (normalized to Gapdh) expression and quantitation of DNA methylation using a MethylCollector Ultra kit in 8-, 12-, and 15-week-old (8 W, 12 W, and 15 W, respectively) db/m and db/db mice. Following the significant difference in Tgfb1 mRNA at 8 week and the slight, but insignificant, decrease in DNA methylation in mesangial cells of db/db mice at 8 weeks, both parameters at 12 and 15 weeks significantly differed between db/m and db/db mice. n = 6. (D) ChIP analysis of DNMTs in mesangial cells of db/db mice. The results of ChIP assays for DNMT1, DNMT3A, and DNMT3B in mesangial cells from 12-week-old db/m and db/db mice at the positions 422 and 366 bp upstream of the TSS. The binding of DNMT1 and DNMT3B to the Tgfb1 promoter region is significantly decreased in db/db mice as compared to db/m mice, despite no difference of DNMT3A between both mouse strains. n = 6. (E) Real-time PCR of DNMTs mRNA (normalized to Gapdh) of DNMT1 in primary cultured mesangial cells from db/m and db/db mice. The expression of DNMT1 mRNA significantly and DNMT3b mRNA tends to decreased in db/db mice as compared to db/m mice. Data represent the mean ± SEM. real-time PCR; n = 6, Filled circles: db/m mice; open circles: db/db mice. (F) Western blot analysis of DNMT1 in primary cultured mesangial cells from db/m and db/db mice. Open circle: The expression of DNMT1 protein significantly decreased in db/db mice as compared to db/m mice. Data represent the mean ± SEM. n = 3. Filled circles: db/m mice; open circles: db/db mice. Original gel image of western blot analysis is presented in Supplemental Fig. 3.
Figure 5
Figure 5
Bisulfite sequence analysis of the Tgfb1 promoter region, and ChIP assays of USF1 and SREBP1. (A) Bisulfite sequence analysis of the Tgfb1 promoter region in mesangial cells from 15-week-old db/m and db/db mice. Top, schema of the Tgfb1 promoter. The dashes and numbers indicate the positions of the cytosine residues of CpG dinucleotides relative to the transcription start site (TSS, +1). Bottom, DNA methylation status of the CpG sites between −207 and −685 bp relative to the TSS. CpGs at positions 639, 458, 422, and 406 bp upstream of the TSS are demethylated in db/db mice, while CpGs at positions −366 and −207 were comparably demethylated in both mouse strains. Filled circles represent methylated and open circles demethylated CpG sites. (B) The results of ChIP assays of USF1 binding to the site, TSS −641 to −636, and SREBP1 binding to the site, TSS −200 to −32, in mesangial cells from 12-week-old db/m and db/db mice. The binding of USF1 to its recognition site in Tgfb1 promoter region (−641 to −636 bp) is significantly increased in db/db mice compared with db/m mice, but the binding of SREBP1 to its recognition site (−232 to −220 bp) is comparable between db/m and db/db mice. Data represent the mean ± SEM. n = 6. Filled circles: db/m mice; open circles: db/db mice. (C) The results of ChIP assays of DNMT1 and DNMT3B binding to the USF1 recognition site (TSS −641 to −636) in mesangial cells from 12-week-old db/m and db/db mice. The binding of DNMT1 and DNMT3B to the corresponding promoter region are significantly decreased in db/db mice; the greater binding of DNMT1 than that of DNMT3B. Data represent the mean ± SEM. n = 6. (D) Effect of folic acid on DNA methylation and Tgfb1 mRNA in mesangial cells. Quantitation of DNA methylation in mesangial cells from 15-week-old db/db and db/db mice treated with Folic acid for 8 weeks revealed tha DNA methylation of db/db mice with Folic acid is significantly higher than that of db/m mice. Results of amplification from the −639 bp relative to the transcription start site (TSS) regions are shown. Real-time PCR of Tgfb1 mRNA (normalized to Gapdh) in primary cultured mesangial cells from db/db and db/db mice treated with Folic acid. The expression of Tgfb1 mRNA in db/db mice with Folic acid was significantly lower than that in db/db mice. Data represent the mean ± SEM. n = 6. Open circles: db/db mice; open triangles: db/db mice treated with Folic acid. (G) Effect of folic acid on DNMT1 mRNA in mesangial cells. Real-time PCR of DNMT1 mRNA (normalized to Gapdh) in primary cultured mesangial cells from db/db and db/db mice treated with Folic acid. The expression of Tgfb1 mRNA in db/db mice with Folic acid was significantly higher than that in db/db mice. Data represent the mean ± SEM. n = 6. Open circles: db/db mice; open triangles: db/db mice treated with Folic acid.
Figure 6
Figure 6
The effect of treatment with the anti-oxidant, Tempol to demethylauin of Tgfb1 in db/db mice and reactive oxygen species to methylation of Tgfb1 in mesangial cells. (A) Twenty-four hour urine samples were collected from db/m, db/db, and db/db mice treated with Tempol for 8 weeks in metabolic cages, and 8-OHdG was measured using a New 8-OHdG Check ELISA kit. Immunoblotting of MAD in whole kidneys of db/m, db/db, and db/db mice treated with Tempol for 8 weeks. Urinary 8-OHdG and renal MAD content were significantly increased in db/db mice compared with db/m mice, but treatment with Tempol significantly decreased these parameters. Beta-actin was used for normalization. Data represent the mean ± SEM. 8-OHdG, n = 4; MAD, n = 3. Filled circle: db/m mice; open circle: db/db mice; open triangle: db/db+ Tempol. (B) DNA methylation and down-regulation of Tgfb1 in mesangial cells from db/db mice treated with Tempol. Quantitation of DNA methylation, using a MethylCollector Ultra kit, in mesangial cells from 15-week-old db/db mice, treated or not treated with Tempol for 8 weeks. Quantitative real-time PCR of Tgfb1 and Gapdh mRNA from 15-week-old db/db mice treated or not treated with Tempol for 8 weeks. Tempol significantly increase DNA methylation and decreased Tgfb1 mRNA. Data represent the mean ± SEM. n = 6. (C) The results of ChIP assays to determine binding of DNMT1 and USF1 to the Tgfb1 promoter (TSS −641 to −636) in mesangial cells from 15-week-old db/db mice treated or not treated with Tempol for 8 weeks. Tempol significantly increase and decrease the binding of DNMT1 and USF1 to their respective binding sites. Data represent the mean ± SEM. n = 6. (D) Quantitation of DNA methylation, using a MethylCollector Ultra kit, in mesangial cells from 8-week-old m/m mice treated with 0 (Vehicle) or 60 µM H2O2. Quantitative real-time PCR of Tgfb1 and Gapdh mRNA in mesangial cells from 8-week-old m/m mice treated with 0 or 60 µM H2O2. Treatment with H2O2 significantly decrease DNA methylation and increase Tgfb1 mRNA expression. Data represent ± SEM. n = 6. (E) The effect of siRNA targeting Usf1 on upregulation of Tgfb1 mRNA by reactive oxygen species. Quantitative real-time PCR of Tgfb1 (normalized to Gapdh) mRNA in mesangial cells, from 8-week-old m/m mice, treated with 0 or 60 µM H2O2, and with control or Usf1-targeting siRNA. Transfection of Usf1 siRNA abolish the upregulation of Tgfb1 mRNA induced by H2O2, whereas control siRNA did not affect H2O2-induced increase in Tgfb1 mRNA. Dunnett -corrected t-tests. Data represent the mean ± SEM. n = 6. (F) Quantitative real-time PCR of DNMT1 mRNA (normalized to Gapdh) in mesangial cells, from 8-week-old m/m mice, treated with 0 or 60 µM H2O2. H2O2.induced significant decrease in DNMT1 mRNA. Data represent the mean ± SEM. n = 6. (G) Quantitative real-time PCR of DNMT1 mRNA (normalized to Gapdh) and western blot analysis of DNMT1 (normalized to β-actin) from 15-week old db/db mice treated or not treated with Tempol for 8 weeks. Tempol tended to increase DNMT1mRNA and protein. Data represent the mean ± SEM. real-time PCR; n = 6, western blot analysis; n = 3. Original gel image of western blot analysis are presented in Supplemental Fig. 9.
Figure 7
Figure 7
The effect of anti-oxidants on glomerulosclerosis in db/db mice. (A) PAS staining of glomeruli from 15-week-old db/m, db/db, and db/db mice treated with Tempol for 8 weeks. Scale bar, 20 µm. Mesangial sclerosis is significantly increased in db/db mice compared to db/m mice, but Tempol significantly decrease in db/db mice. Semi-quantitative glomerulosclerosis scores of 20 glomeruli each from three mice per group. Data represent the mean ± SEM. n = 3. Filled circle: db/m mice; open circle: db/db mice; open triangle open triangle: db/db+ Tempol. (B) Representative images of immunostaining of TGFB1, α−smooth muscle actin (α-SMA), and type IV collagen (Col IV) in glomeruli from 15-week-old db/m, db/db, and db/db mice treated with Tempol for 8 weeks. Treatment with Tempol attenuated increased immunostaining of TGFB1, α-SMA and Col IV in the glomeruli of db/db mice. Scale bar, 20 µm. (C) 24-hr urinary albumin excretion at 15-week old db/m, db/db and db/db treated with Tempol for 8 weeks. Urinary albumin excretion is significantly increased in db/db mice compared with db/m mice, but treatment with Tempol significantly reduce the increased urinary albumin in db/db mice. Data represent the mean ± SEM. n = 4.

Similar articles

Cited by

References

    1. Ritz E, Rychlik I, Locatelli F, Halimi S. 1999. End-stage renal failure in type 2 diabetes: A medical catastrophe of worldwide dimensions. Am J Kidney Dis. 1999;34:795–808. doi: 10.1016/S0272-6386(99)70035-1. - DOI - PubMed
    1. Gregg EW, et al. Changes in diabetes-related complications in the United States, 1990–2010. N Engl J Med. 2014;370:1514–1523. doi: 10.1056/NEJMoa1310799. - DOI - PubMed
    1. Kowluru RA, Abbas SN, Odenbach S. Reversal of hyperglycemia and diabetic nephropathy: effect of reinstitution of good metabolic control on oxidative stress in the kidney of diabetic rats. J Diabetes Complications. 2004;18:282–288. doi: 10.1016/j.jdiacomp.2004.03.002. - DOI - PubMed
    1. Thomas MC, et al. Diabetic kidney disease. Nat Rev Dis Primers. 2015;1:15018. doi: 10.1038/nrdp.2015.18. - DOI - PMC - PubMed
    1. Kirchner H, Osler ME, Krook A, Zierath JR. Epigenetic flexibility in metabolic regulation: disease cause and prevention? Trends Cell Biol. 2013;23:203–209. doi: 10.1016/j.tcb.2012.11.008. - DOI - PubMed

Publication types

LinkOut - more resources