

Machine Learning Reveals Protein Signatures in CSF and Plasma Fluids of Clinical Value for ALS
- PMID: 30397248
- PMCID: PMC6218542
- DOI: 10.1038/s41598-018-34642-x
Machine Learning Reveals Protein Signatures in CSF and Plasma Fluids of Clinical Value for ALS
Abstract
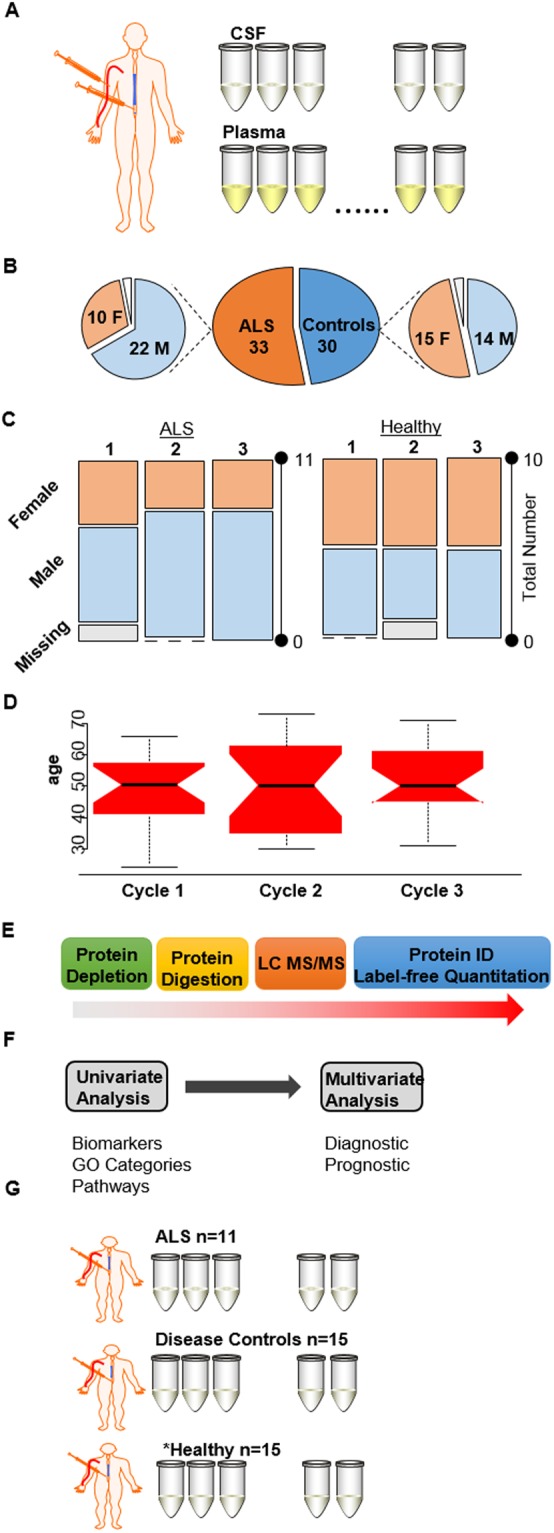
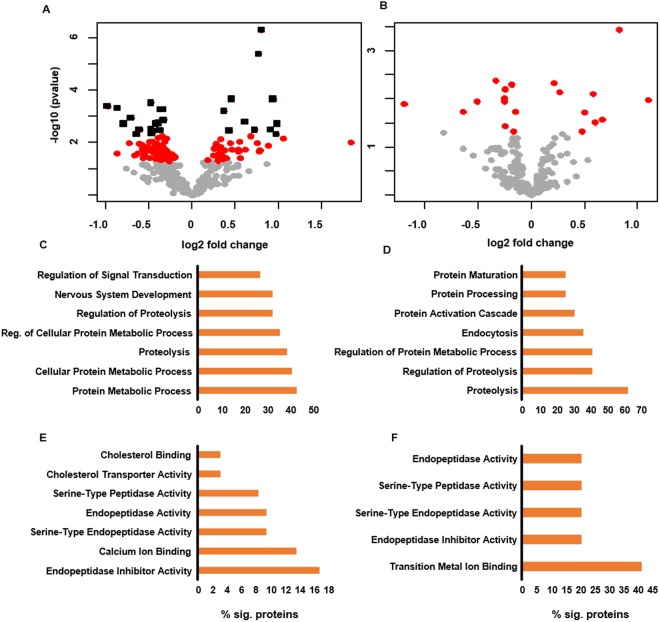
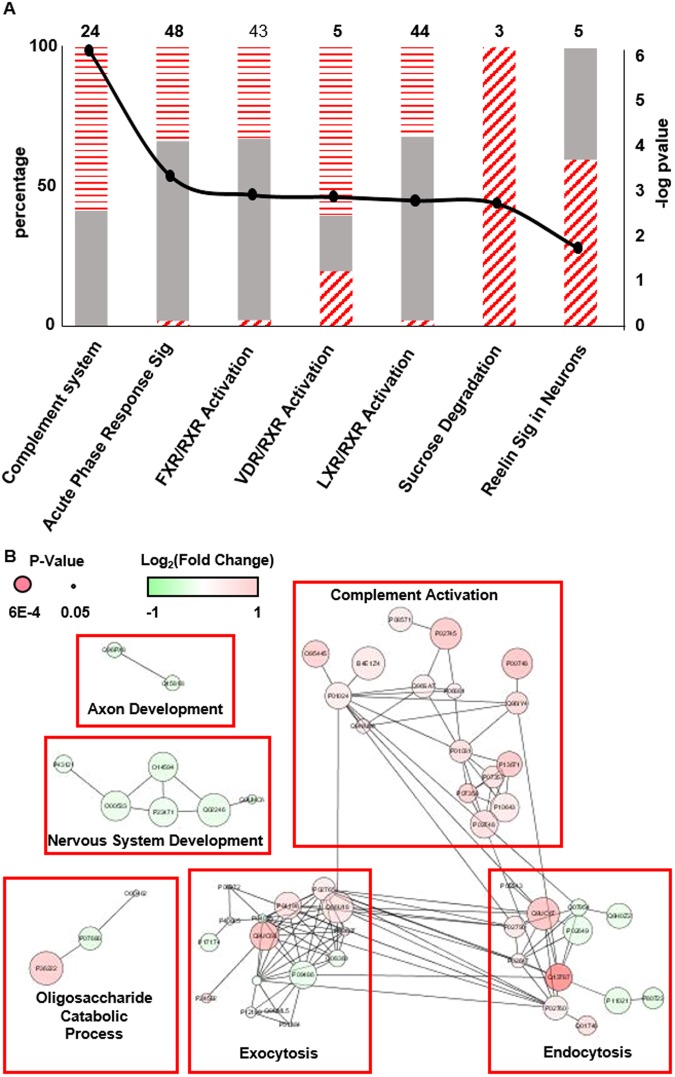
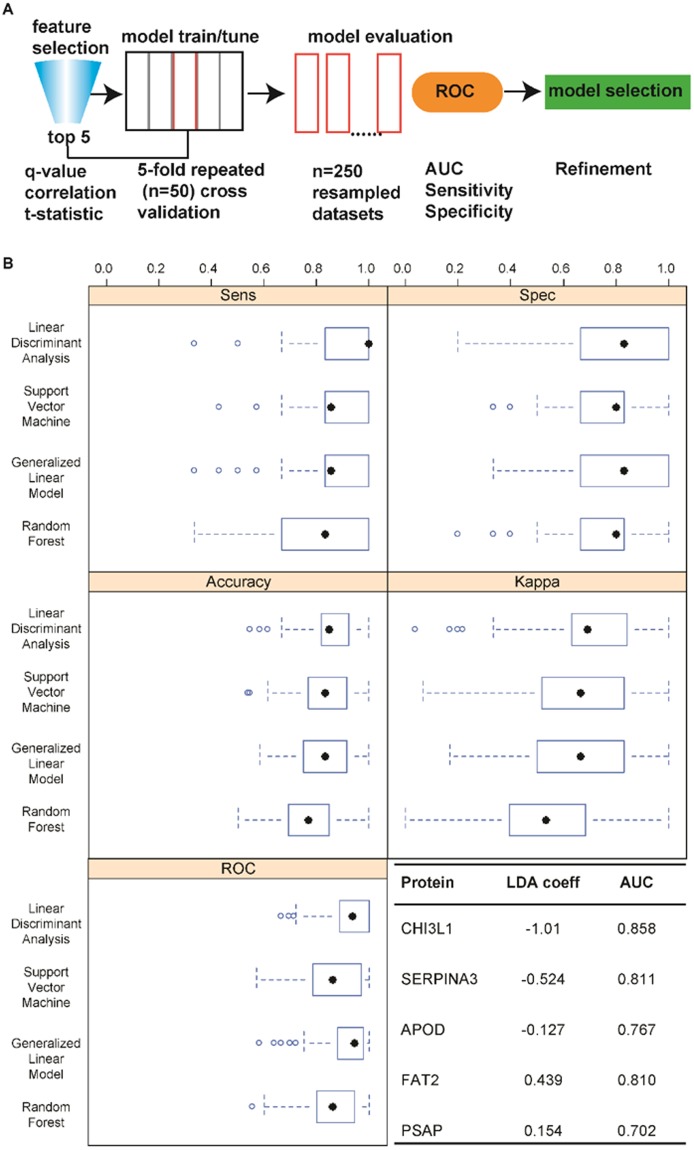
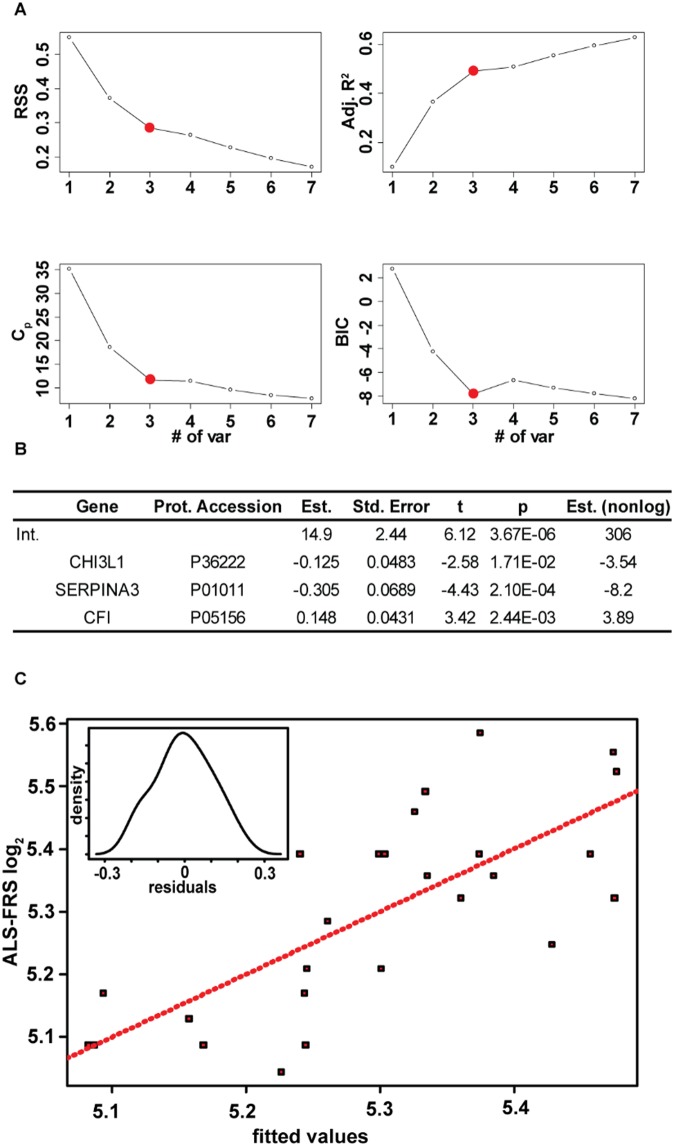
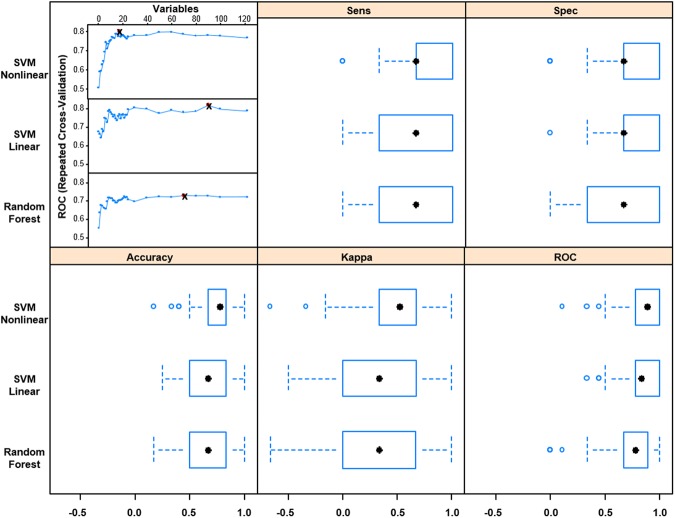
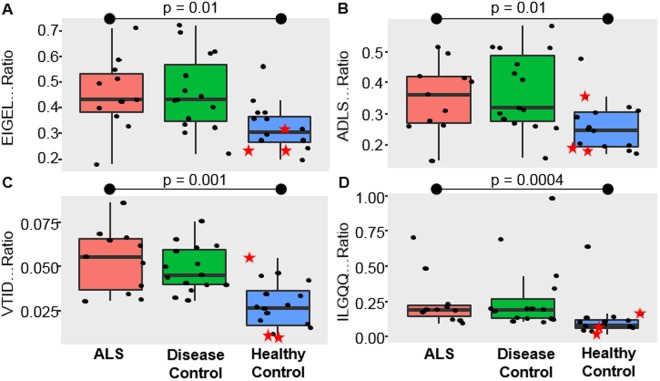
We use shotgun proteomics to identify biomarkers of diagnostic and prognostic value in individuals diagnosed with amyotrophic lateral sclerosis. Matched cerebrospinal and plasma fluids were subjected to abundant protein depletion and analyzed by nano-flow liquid chromatography high resolution tandem mass spectrometry. Label free quantitation was used to identify differential proteins between individuals with ALS (n = 33) and healthy controls (n = 30) in both fluids. In CSF, 118 (p-value < 0.05) and 27 proteins (q-value < 0.05) were identified as significantly altered between ALS and controls. In plasma, 20 (p-value < 0.05) and 0 (q-value < 0.05) proteins were identified as significantly altered between ALS and controls. Proteins involved in complement activation, acute phase response and retinoid signaling pathways were significantly enriched in the CSF from ALS patients. Subsequently various machine learning methods were evaluated for disease classification using a repeated Monte Carlo cross-validation approach. A linear discriminant analysis model achieved a median area under the receiver operating characteristic curve of 0.94 with an interquartile range of 0.88-1.0. Three proteins composed a prognostic model (p = 5e-4) that explained 49% of the variation in the ALS-FRS scores. Finally we investigated the specificity of two promising proteins from our discovery data set, chitinase-3 like 1 protein and alpha-1-antichymotrypsin, using targeted proteomics in a separate set of CSF samples derived from individuals diagnosed with ALS (n = 11) and other neurological diseases (n = 15). These results demonstrate the potential of a panel of targeted proteins for objective measurements of clinical value in ALS.
Conflict of interest statement
The authors declare no competing interests.
Figures
Similar articles
-
Label-Free LC-MS/MS Proteomic Analysis of Cerebrospinal Fluid Identifies Protein/Pathway Alterations and Candidate Biomarkers for Amyotrophic Lateral Sclerosis.J Proteome Res. 2015 Nov 6;14(11):4486-501. doi: 10.1021/acs.jproteome.5b00804. Epub 2015 Oct 8. J Proteome Res. 2015. PMID: 26401960 Free PMC article.
-
Identification of potential CSF biomarkers in ALS.Neurology. 2006 Apr 25;66(8):1218-22. doi: 10.1212/01.wnl.0000203129.82104.07. Epub 2006 Feb 15. Neurology. 2006. PMID: 16481598
-
Monitoring CSF proteome alterations in amyotrophic lateral sclerosis: obstacles and perspectives in translating a novel marker panel to the clinic.PLoS One. 2012;7(9):e44401. doi: 10.1371/journal.pone.0044401. Epub 2012 Sep 6. PLoS One. 2012. PMID: 22970211 Free PMC article.
-
Aberrant Levels of Cystatin C in Amyotrophic Lateral Sclerosis: a Systematic Review and Meta Analysis.Int J Biol Sci. 2018 Jun 3;14(9):1041-1053. doi: 10.7150/ijbs.25711. eCollection 2018. Int J Biol Sci. 2018. PMID: 29989057 Free PMC article.
-
Proteomic studies in the discovery of cerebrospinal fluid biomarkers for amyotrophic lateral sclerosis.Expert Rev Proteomics. 2017 Sep;14(9):769-777. doi: 10.1080/14789450.2017.1365602. Epub 2017 Aug 14. Expert Rev Proteomics. 2017. PMID: 28799854 Review.
Cited by
-
Using blood data for the differential diagnosis and prognosis of motor neuron diseases: a new dataset for machine learning applications.Sci Rep. 2021 Feb 9;11(1):3371. doi: 10.1038/s41598-021-82940-8. Sci Rep. 2021. PMID: 33564045 Free PMC article. Clinical Trial.
-
Skeletal muscle biomarkers of amyotrophic lateral sclerosis: a large-scale, multi-cohort proteomic study.medRxiv [Preprint]. 2025 Apr 25:2025.04.23.25326161. doi: 10.1101/2025.04.23.25326161. medRxiv. 2025. PMID: 40313273 Free PMC article. Preprint.
-
PERCEPT: Replacing binary p-value thresholding with scaling for more nuanced identification of sample differences.iScience. 2024 May 3;27(6):109891. doi: 10.1016/j.isci.2024.109891. eCollection 2024 Jun 21. iScience. 2024. PMID: 38832020 Free PMC article.
-
Shotgun Proteomics Links Proteoglycan-4+ Extracellular Vesicles to Cognitive Protection in Amyotrophic Lateral Sclerosis.Biomolecules. 2024 Jun 19;14(6):727. doi: 10.3390/biom14060727. Biomolecules. 2024. PMID: 38927130 Free PMC article.
-
Filtered Cerebrospinal Fluid From Patients With Amyotrophic Lateral Sclerosis Displays an Altered Proteome and Affects Motor Phenotype in a Mouse Model.Cureus. 2022 Dec 26;14(12):e32980. doi: 10.7759/cureus.32980. eCollection 2022 Dec. Cureus. 2022. PMID: 36712738 Free PMC article.
References
Publication types
MeSH terms
Grants and funding
LinkOut - more resources
Full Text Sources
Medical
Miscellaneous
