. 2018 Nov 5;8(1):16333.
doi: 10.1038/s41598-018-34549-7.

Step Sizes and Rate Constants of Single-headed Cytoplasmic Dynein Measured with Optical Tweezers

Affiliations

Step Sizes and Rate Constants of Single-headed Cytoplasmic Dynein Measured with Optical Tweezers

Yoshimi Kinoshita et al. Sci Rep. .

Abstract

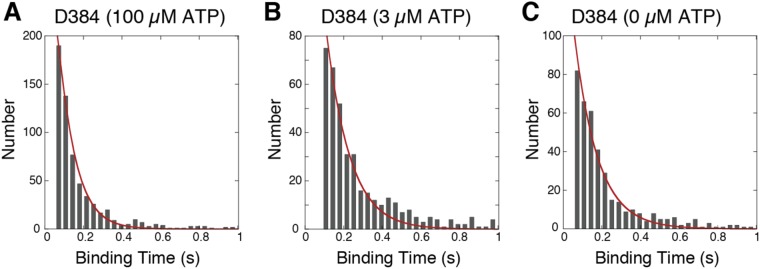
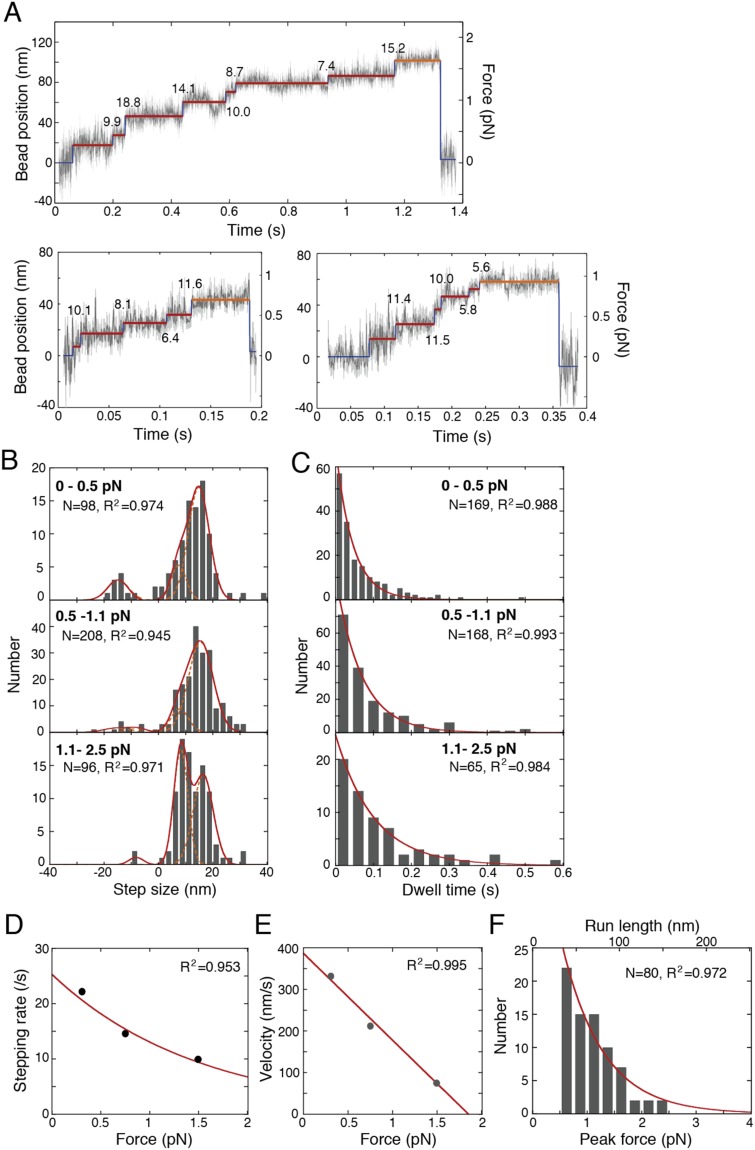
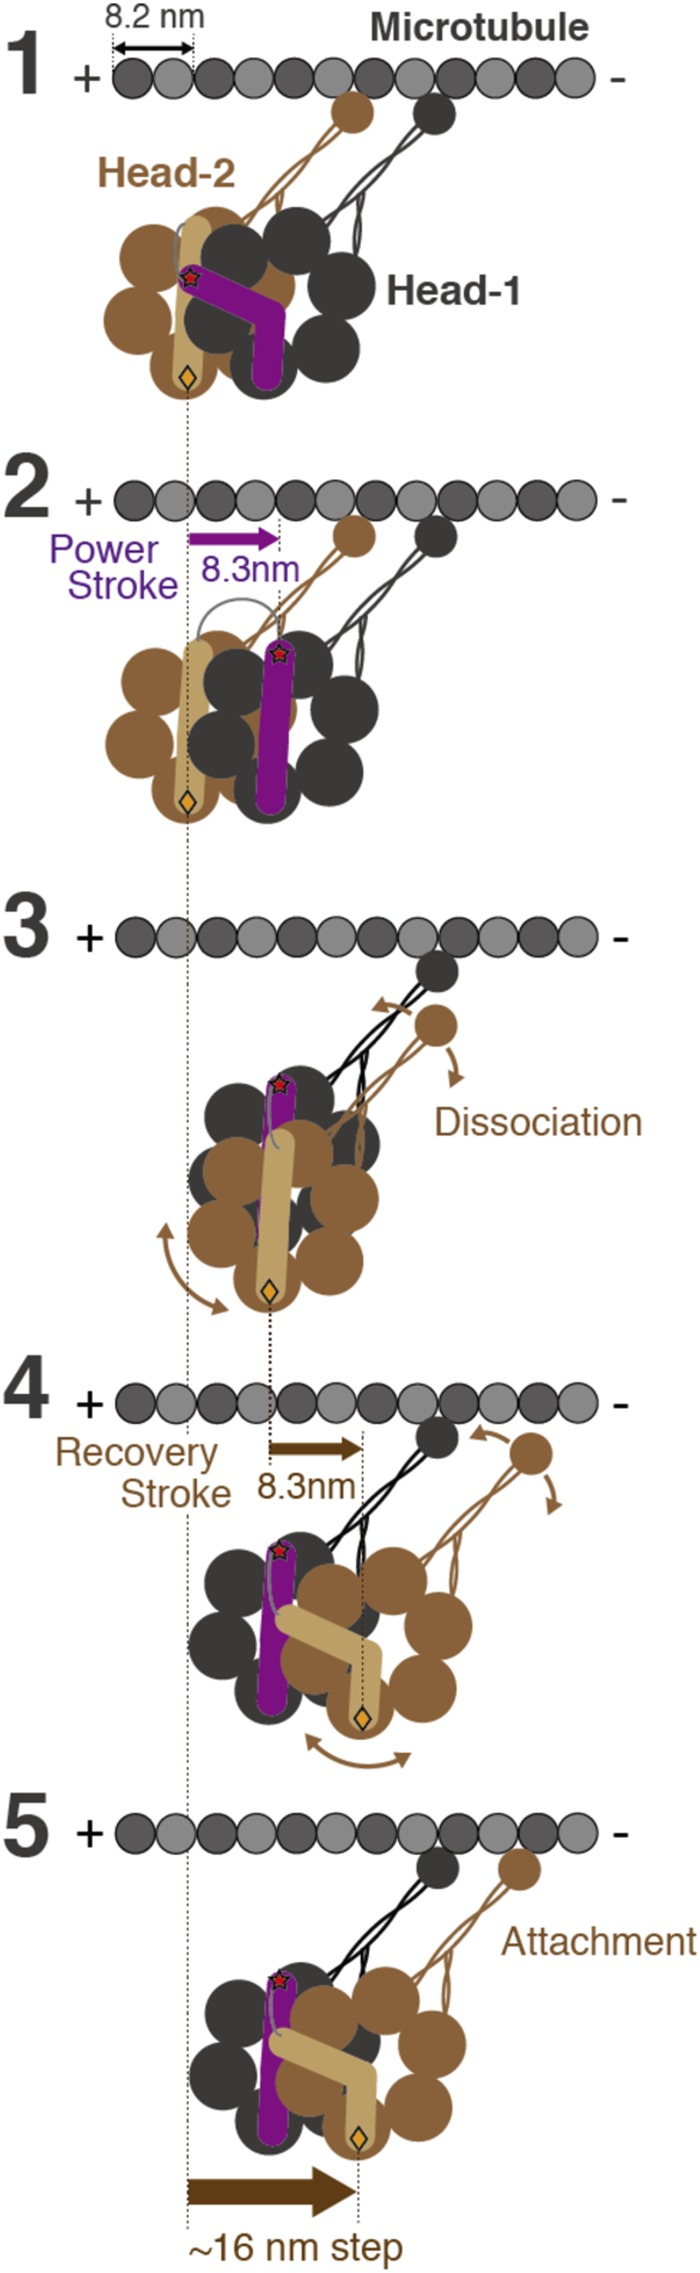
A power stroke of dynein is thought to be responsible for the stepping of dimeric dynein. However, the actual size of the displacement driven by a power stroke has not been directly measured. Here, the displacements of single-headed cytoplasmic dynein were measured by optical tweezers. The mean displacement of dynein interacting with microtubule was ~8 nm at 100 µM ATP, and decreased sigmoidally with a decrease in the ATP concentration. The ATP dependence of the mean displacement was explained by a model that some dynein molecules bind to microtubule in pre-stroke conformation and generate 8-nm displacement, while others bind in the post-stroke one and detach without producing a power stroke. Biochemical assays showed that the binding affinity of the post-stroke dynein to a microtubule was ~5 times higher than that of pre-stroke dynein, and the dissociation rate was ~4 times lower. Taking account of these rates, we conclude that the displacement driven by a power stroke is 8.3 nm. A working model of dimeric dynein driven by the 8-nm power stroke was proposed.


Conflict of interest statement

The authors declare no competing interests.

Figures

Figure 1
Figure 1
FRET measurements of dynein. (A) Schematics of the dynein constructs. (B) Electron microscope image of dynein molecule D384, marked with orange arrows. The MTBD in the magnified image of dynein is marked with a yellow arrow in the inset. Scale bars, 60 nm and 10 nm (inset). (C) Structures of the dynein motor domain (D384GB, PDB 4RH7 and 3VKH) before and after the power stroke. BFP and GFP are bound to the ring and linker, respectively. (D) FRET efficiencies of D384GB, D384GB-ΔPSI and D384GB-ΔPSIΔH2 in various chemical states. (E) ATP dependence of the FRET efficiencies of D384GB. The efficiencies of D384GB were fit to a sigmoidal curve (red line, curve equation 5, described in the Supplemental Information). At 3.3 μM ATP, the relative percentage of population taking the highest FRET efficiency was half. The R2 was 0.97. Error bars in (D) and (E) represent the standard error.
Figure 2
Figure 2
Biochemical reaction model of dynein with (upper row) and without (lower row) microtubules. The main route of the ATPase cycle in the presence of a microtubule at high ATP concentration is shown by bold arrows. MD-pre and D-pre, prepower stroke states (chemical state of pre states has not identified whether ADPPi or ADP* state); MD-apo and D-apo, no-nucleotide binding states; MD-ATP and D-ATP, ATP binding states. The superscripts of the reaction rates were partly defined by their association (on) or dissociation (off) from microtubules. The subscripts were defined as the chemical or structural states or binding of microtubules. For more details, see the text.
Figure 3
Figure 3
Measurements of displacement of single-headed dynein. (A) Schematic diagram of the dumbbell assay. (B) Time traces of position along the microtubule of the trapped bead. The red zones and lines indicate the period of dynein binding to the microtubule at higher stiffness (or lower variance) and the displacement during the period. Right panel, fluorescence microscope image of polarity-marked microtubule and beads. Scale bar, 5 µm. (C,D) Distributions of displacements of D384 at 3 µM ATP (blue in C, 494 events, 5 dynein-beads) or 100 µM ATP (red in C, 727 events, 7 dynein-beads) and those of D384GB-ΔPSIΔH2 at 1 mM ATP (773 events, 10 dynein-beads) were measured by the dumbbell assay. Left panels show the Gaussian distributions of the displacements. Right panels show the mean displacements determined by fitting experimental displacements to the integrated Gaussian function, shown by blue and red lines. Arrows show the mean displacements. (E) Mean displacements measured by the single-trap of D384 (open squares), dumbbell assays of D384 (closed squares), D384GB (open circle), and the mutants (closed diamond and triangle). Most of the standard error bars are within the symbols. The mean displacements of D384 were fit to the equation (red line, curve equation 6, described in the Supplemental Information). The R2 was 0.977.
Figure 4
Figure 4
Distributions of microtubule binding time of D384 at 100 μM (A, 727 events, 7 dynein-beads), 3 μM (B, 494 events, 5 dynein-beads) and 0 μM ATP (C, 436 events, 6 dynein-beads). Distributions were globally fit to the equation (red lines, curve equation 10, described in the Supplemental Information). The R2 of the fittings were 0.97, 0.96 and 0.97 at ATP concentration of 100, 3, and 0 μM, respectively.
Figure 5
Figure 5
Movement and force generation of single molecules of dimeric dynein (GST-D384). (A) Typical displacement of the trap bead toward the minus end of the microtubule at 1 mM ATP. Red lines: dwell time analyzed by the step-finding algorithm in figure 5D. Orange lines: peak force immediately before dynein dissociates from the microtubule. Numbers in figures: the step size was analyzed in figure 5B. (B) The histograms of the step size were fit to multiple Gaussian distributions. Over a 1.1 pN force, the step size was calculated to be 8.23 ± 0.09 nm, 16.26 nm and −8.23 nm. (C) The histograms of the dwell time were fit to a single-exponential curve with a constant of 45 ± 1 ms (<0.5 pN), 69 ± 1 ms (0.5–1.1 pN) or 101 ± 1 ms (>1.1 pN). (D) The stepping rate depending on the force was fitted to a single-exponential curve. The maximum stepping rate under no load was 25.3 ± 0.2 s−1. (E) Relationship between force and velocity. The velocity was calculated as the stepping rate multiplied by the mean step size. The stall force and maximum velocity were calculated to be 1.85 ± 0.01 pN and 387 ± 5 nm/s, respectively, by fitting the data with a linear approximation. The error bars in D and E are almost within the symbols. (F) The histogram of the peak force was fit to a single-exponential curve with a constant of 0.75 ± 0.03 pN. N and R2 in panels B-F indicate the number of measurements and the square of the regression error, respectively.
Figure 6
Figure 6
Walking model of dimeric dynein with ~8-nm step during single ATP hydrolysis at the AAA1 catalytic site. After stage 3, head-2 is shown in front of head-1 to trace its motion easily.

Similar articles

Cited by

References

    1. Roberts AJ, Kon T, Knight PJ, Sutoh K, Burgess SA. Functions and mechanics of dynein motor proteins. Nat. Rev. Mol. Cell Biol. 2013;14:713–726. doi: 10.1038/nrm3667. - DOI - PMC - PubMed
    1. Mallik R, Cater BC, Lex SA, King SJ, Gross SP. Cytoplasmic dynein functions as a gear in response to load. Nature. 2004;42(7):649–652. doi: 10.1038/nature02293. - DOI - PubMed
    1. Toba S, Watanabe TM, Yamaguchi-Okimoto L, Toyoshima YY, Higuchi H. Overlapping hand-over-hand mechanism of single molecular motility of cytoplasmic dynein. Proc. Natl. Acad. Sci. USA. 2006;103:5741–5745. doi: 10.1073/pnas.0508511103. - DOI - PMC - PubMed
    1. Reck-Peterson SL, et al. Single-molecule analysis of dynein processivity and stepping behavior. Cell. 2006;126:335–348. doi: 10.1016/j.cell.2006.05.046. - DOI - PMC - PubMed
    1. Dewitt MA, Chang AY, Combs PA, Yildiz A. Cytoplasmic dynein moves through uncoordinated stepping of the AAA+ ring domains. Science. 2012;335:221–225. doi: 10.1126/science.1215804. - DOI - PMC - PubMed

Publication types