

China's tuberculosis epidemic stems from historical expansion of four strains of Mycobacterium tuberculosis
- PMID: 30397300
- PMCID: PMC6295914
- DOI: 10.1038/s41559-018-0680-6
China's tuberculosis epidemic stems from historical expansion of four strains of Mycobacterium tuberculosis
Abstract
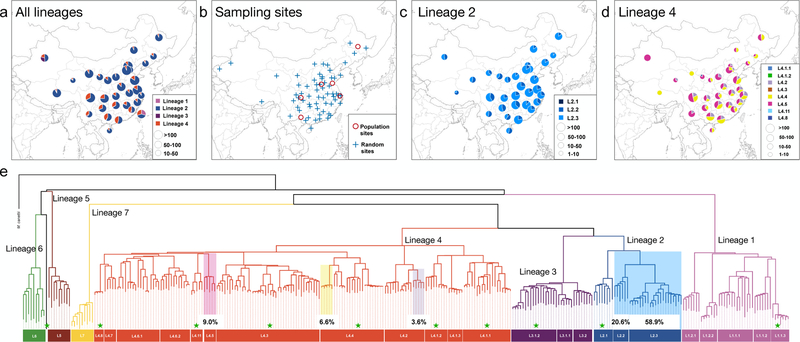
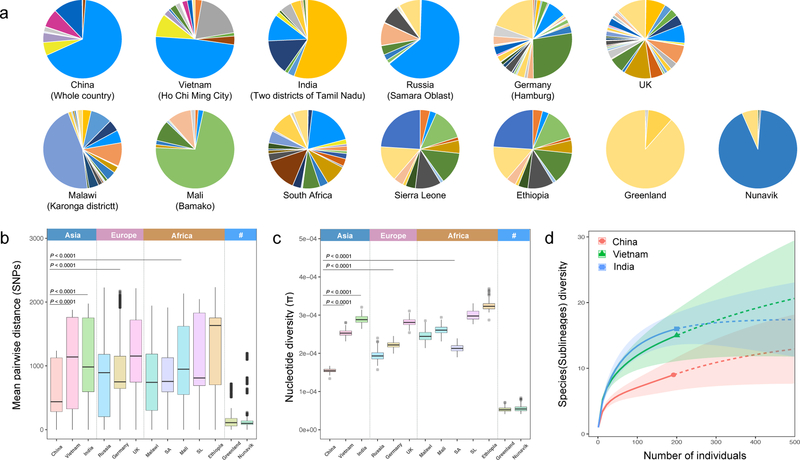
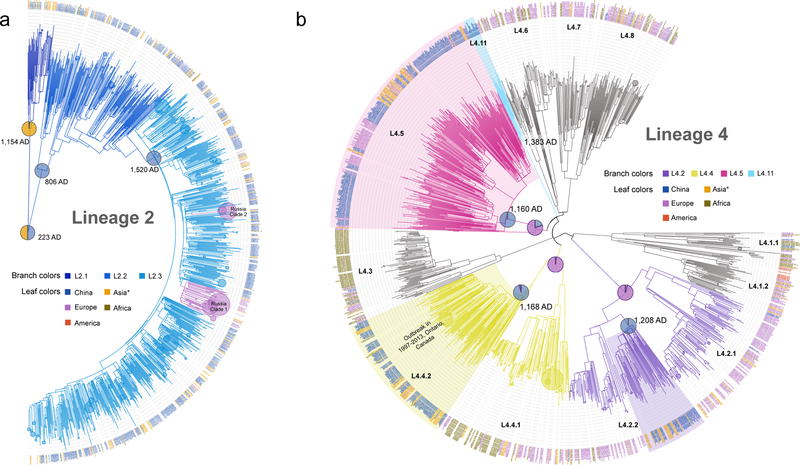
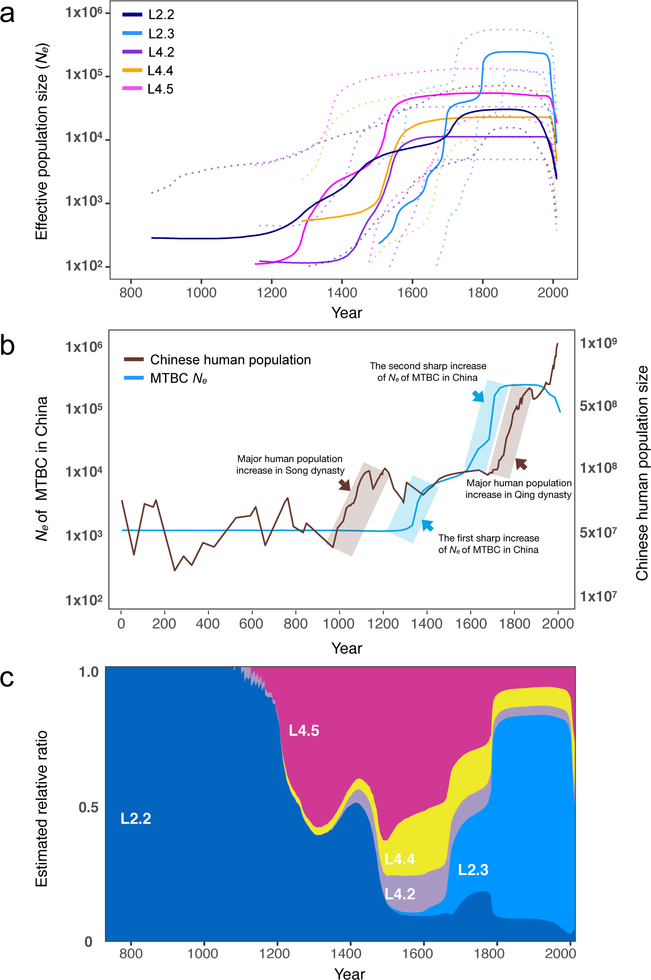
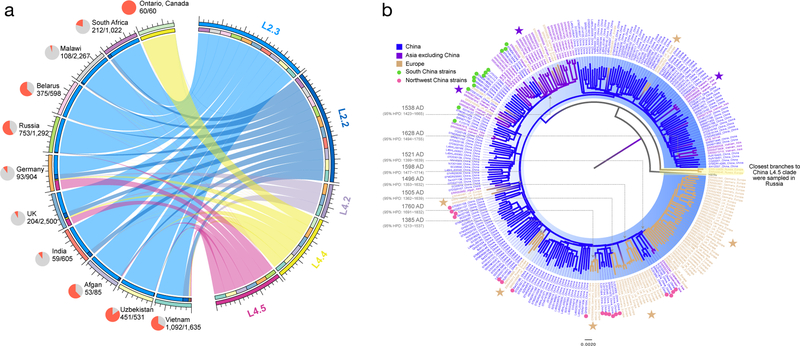
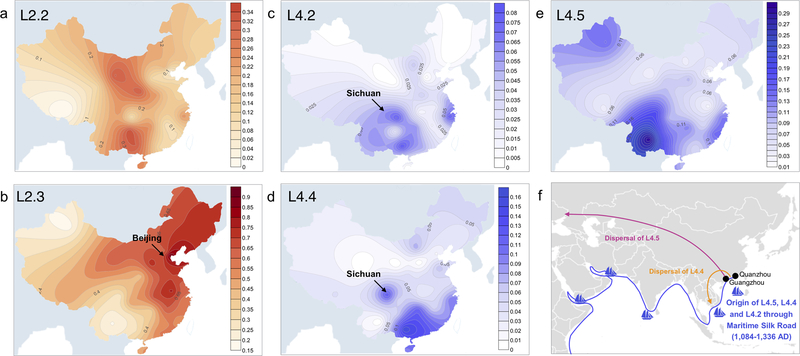
A small number of high-burden countries account for the majority of tuberculosis cases worldwide. Detailed data are lacking from these regions. To explore the evolutionary history of Mycobacterium tuberculosis in China-the country with the third highest tuberculosis burden-we analysed a countrywide collection of 4,578 isolates. Little genetic diversity was detected, with 99.4% of the bacterial population belonging to lineage 2 and three sublineages of lineage 4. The deeply rooted phylogenetic positions and geographic restriction of these four genotypes indicate that their populations expanded in situ following a small number of introductions to China. Coalescent analyses suggest that these bacterial subpopulations emerged in China around 1,000 years ago, and expanded in parallel from the twelfth century onwards, and that the whole population peaked in the late eighteenth century. More recently, sublineage L2.3, which is indigenous to China and exhibited relatively high transmissibility and extensive global dissemination, came to dominate the population dynamics of M. tuberculosis in China. Our results indicate that historical expansion of four M. tuberculosis strains shaped the current tuberculosis epidemic in China, and highlight the long-term genetic continuity of the indigenous M. tuberculosis population.
Conflict of interest statement
COMPETING FINANCIAL INTERESTS
The authors declare no competing financial interests.
Figures
Comment in
-
TB's Chinese travels.Nat Ecol Evol. 2018 Dec;2(12):1842-1843. doi: 10.1038/s41559-018-0732-y. Nat Ecol Evol. 2018. PMID: 30467415 No abstract available.
Similar articles
-
[Population structure analysis of Mycobacterium tuberculosis Beijing family in Japan].Kekkaku. 2009 Dec;84(12):755-9. Kekkaku. 2009. PMID: 20077859 Japanese.
-
Transmission dynamics and phylogeography of Mycobacterium tuberculosis in China based on whole-genome phylogenetic analysis.Int J Infect Dis. 2024 Mar;140:124-131. doi: 10.1016/j.ijid.2023.10.015. Epub 2023 Oct 19. Int J Infect Dis. 2024. PMID: 37863309
-
Molecular structure of Mycobacterium tuberculosis population in Russia and its interaction with neighboring countries.Int J Mycobacteriol. 2015 Mar;4 Suppl 1:56-7. doi: 10.1016/j.ijmyco.2014.08.002. Epub 2014 Sep 3. Int J Mycobacteriol. 2015. PMID: 27128618
-
Mycobacterium tuberculosis phylogeography in the context of human migration and pathogen's pathobiology: Insights from Beijing and Ural families.Tuberculosis (Edinb). 2015 Jun;95 Suppl 1:S167-76. doi: 10.1016/j.tube.2015.02.031. Epub 2015 Feb 24. Tuberculosis (Edinb). 2015. PMID: 25754342 Review.
-
[Findings and ongoing research in the molecular epidemiology of tuberculosis].Kekkaku. 2009 Feb;84(2):83-9. Kekkaku. 2009. PMID: 19280913 Review. Japanese.
Cited by
-
Genomic and Spatial Analysis on the Recent Transmission of Mycobacterium tuberculosis in Eastern China: A 10-Year Retrospective Population-Based Study.Infect Drug Resist. 2024 Sep 30;17:4257-4269. doi: 10.2147/IDR.S480621. eCollection 2024. Infect Drug Resist. 2024. PMID: 39371579 Free PMC article.
-
Global phylogenomic diversity of Brucella abortus: spread of a dominant lineage.Front Microbiol. 2023 Nov 29;14:1287046. doi: 10.3389/fmicb.2023.1287046. eCollection 2023. Front Microbiol. 2023. PMID: 38094632 Free PMC article.
-
Genomic analysis of lineage-specific transmission of multidrug resistance tuberculosis in China.Emerg Microbes Infect. 2024 Dec;13(1):2294858. doi: 10.1080/22221751.2023.2294858. Epub 2024 Feb 13. Emerg Microbes Infect. 2024. PMID: 38126135 Free PMC article.
-
Parallel signatures of Mycobacterium tuberculosis and human Y-chromosome phylogeography support the Two Layer model of East Asian population history.Commun Biol. 2023 Oct 13;6(1):1037. doi: 10.1038/s42003-023-05388-8. Commun Biol. 2023. PMID: 37833496 Free PMC article.
-
A genome epidemiological study of mycobacterium tuberculosis in subpopulations with high and low incidence rate in Guangxi, South China.BMC Infect Dis. 2021 Aug 19;21(1):840. doi: 10.1186/s12879-021-06385-0. BMC Infect Dis. 2021. PMID: 34412585 Free PMC article.
References
-
- World Health Organization. Global Tuberculosis Report 2017. (Geneva: World Health Organization, 2017).
-
- Narain JP, Raviglione MC & Kochi A HIV-associated tuberculosis in developing countries: epidemiology and strategies for prevention. Tuber Lung Dis 73, 311–21 (1992). - PubMed
-
- Steffen R, Rickenbach M, Wilhelm U, Helminger A & Schar M Health problems after travel to developing countries. J Infect Dis 156, 84–91 (1987). - PubMed
-
- Fusegawa H et al. Outbreak of tuberculosis in a 2000-year-old Chinese population. Kansenshogaku Zasshi 77, 146–9 (2003). - PubMed
Publication types
MeSH terms
Grants and funding
LinkOut - more resources
Full Text Sources
Medical
