. 2018 Nov 5;9(1):4620.
doi: 10.1038/s41467-018-06497-3.

Differential lateral and basal tension drive folding of Drosophila wing discs through two distinct mechanisms

Affiliations

Differential lateral and basal tension drive folding of Drosophila wing discs through two distinct mechanisms

Liyuan Sui et al. Nat Commun. .

Abstract

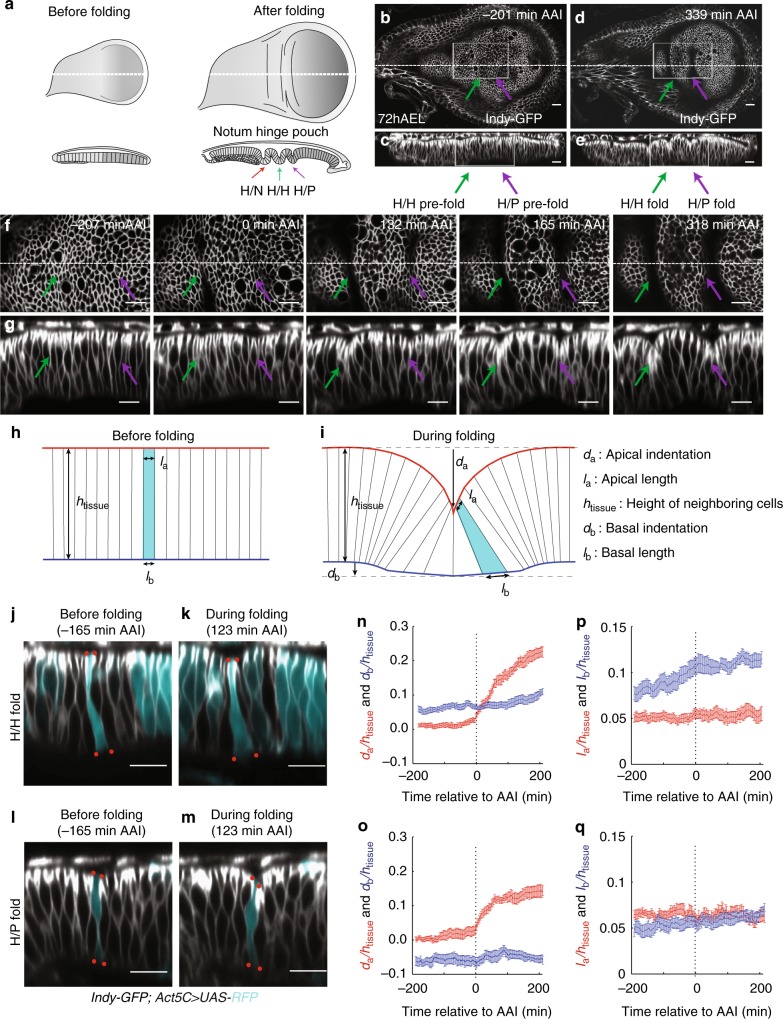
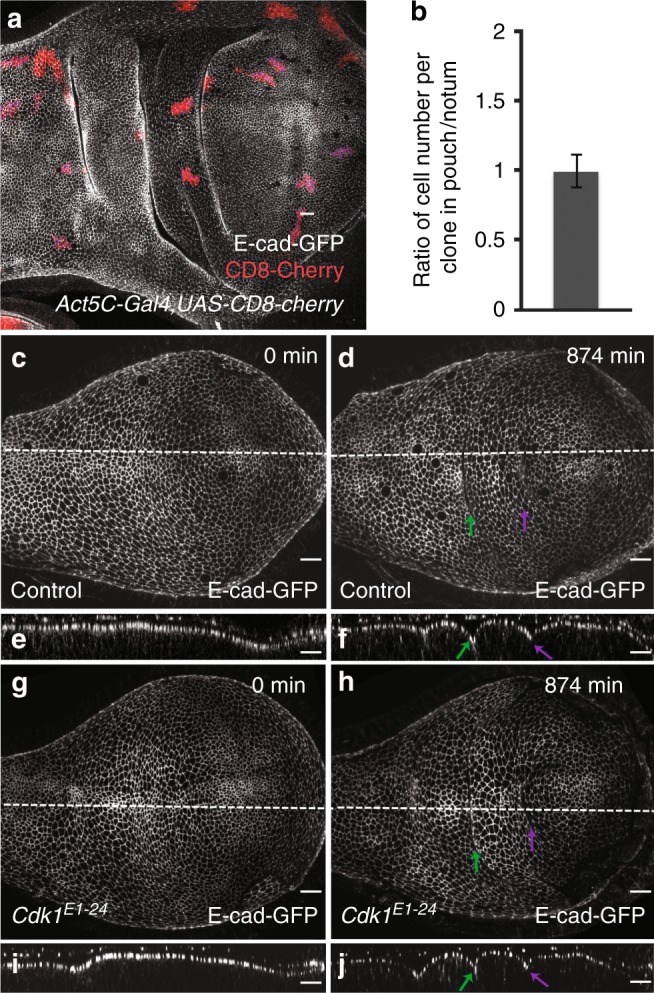
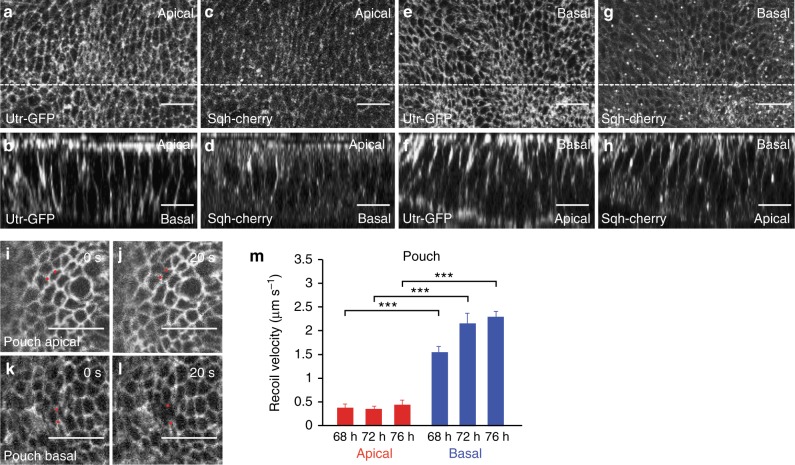
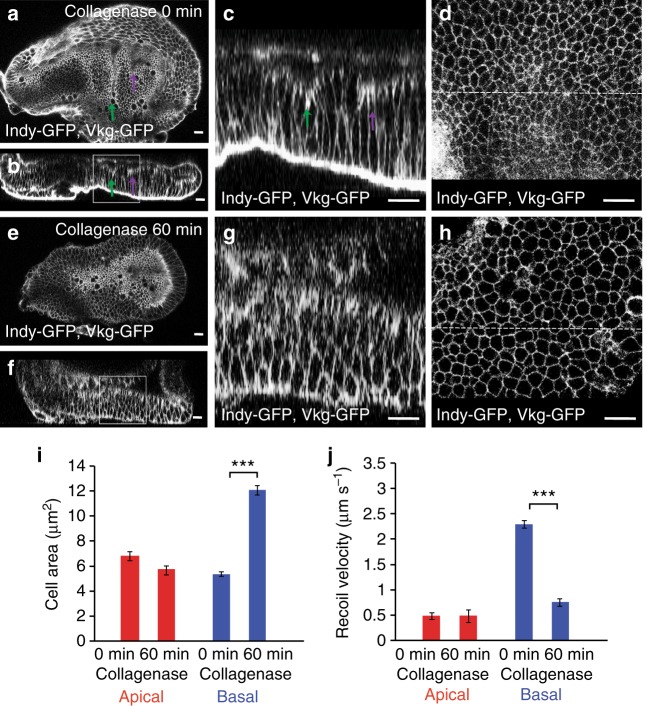
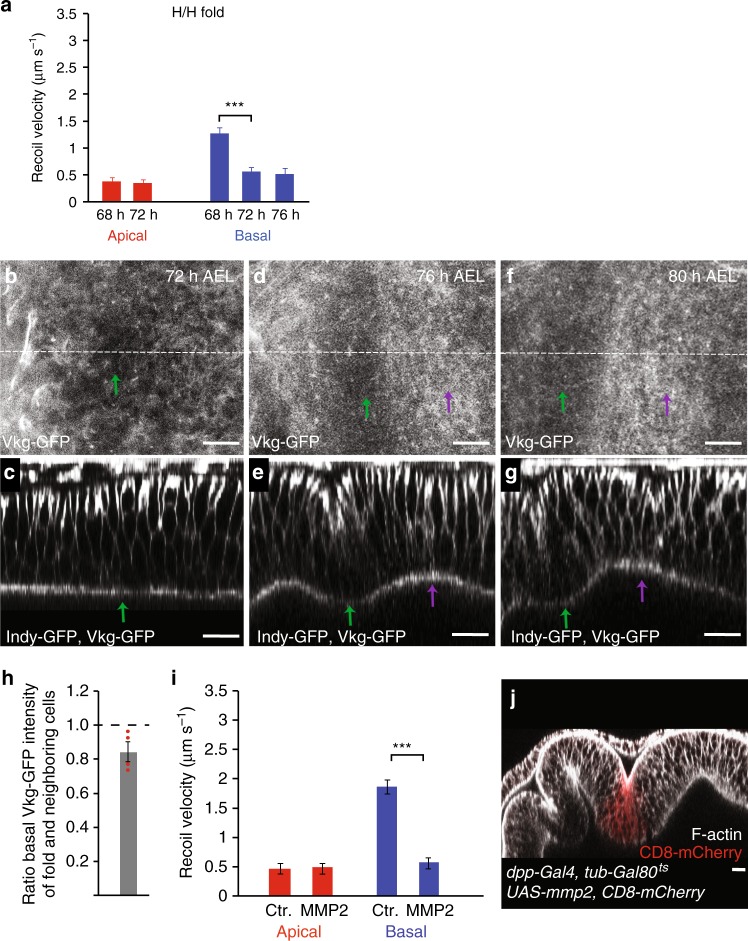
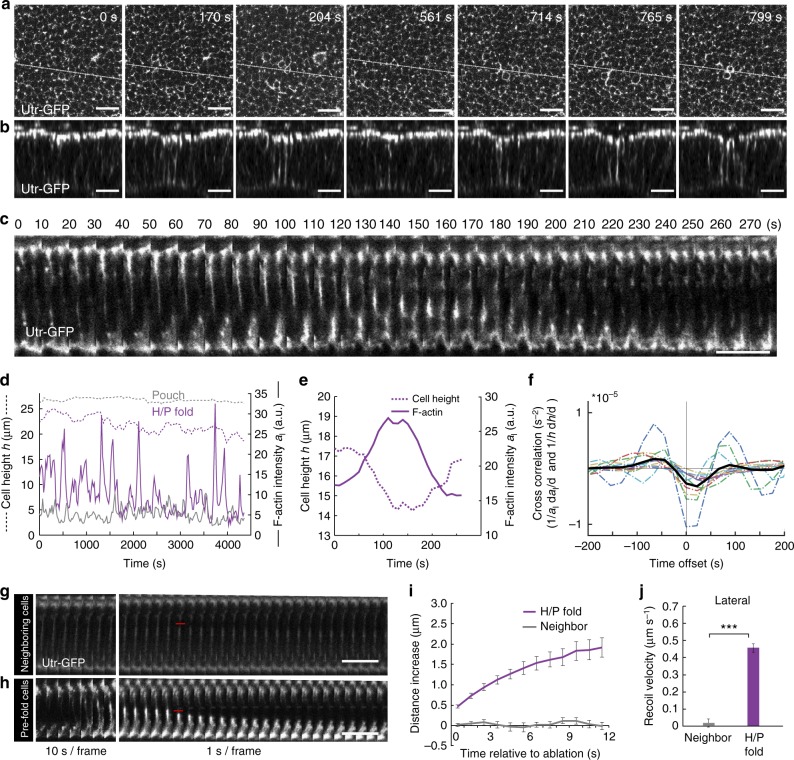
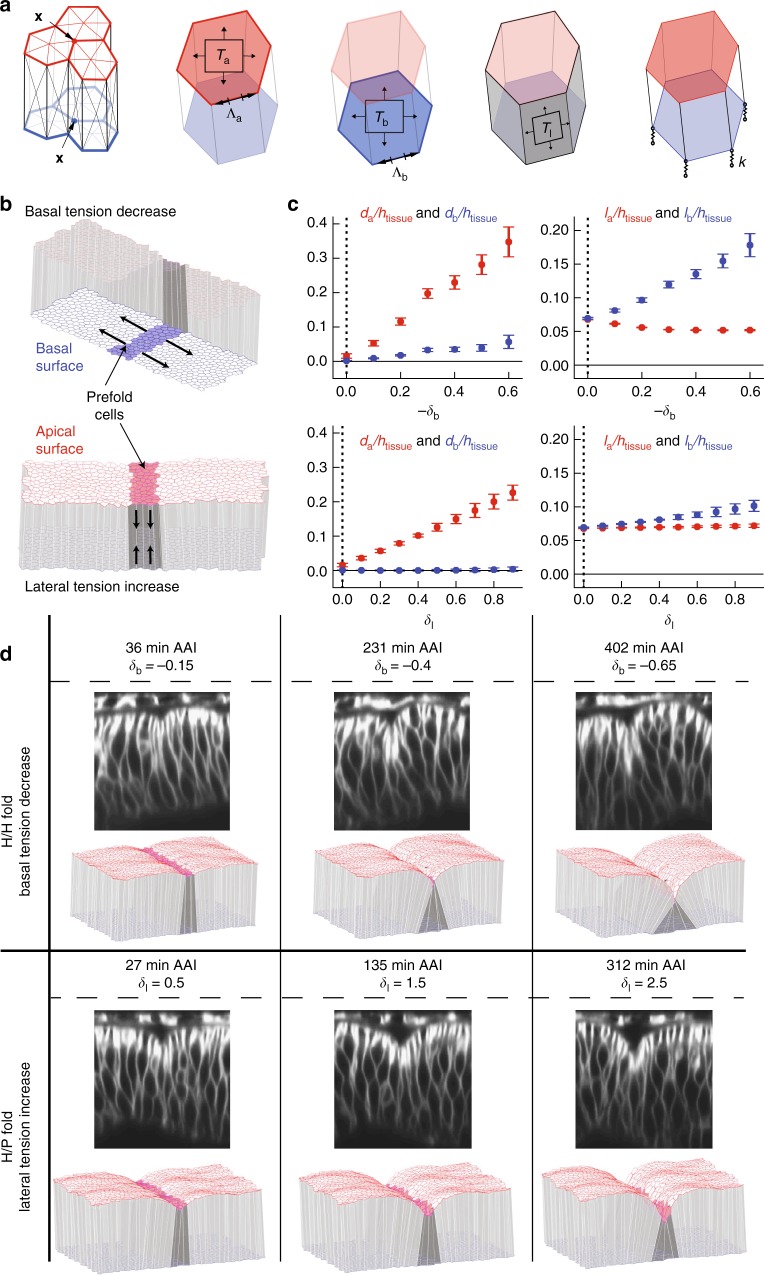
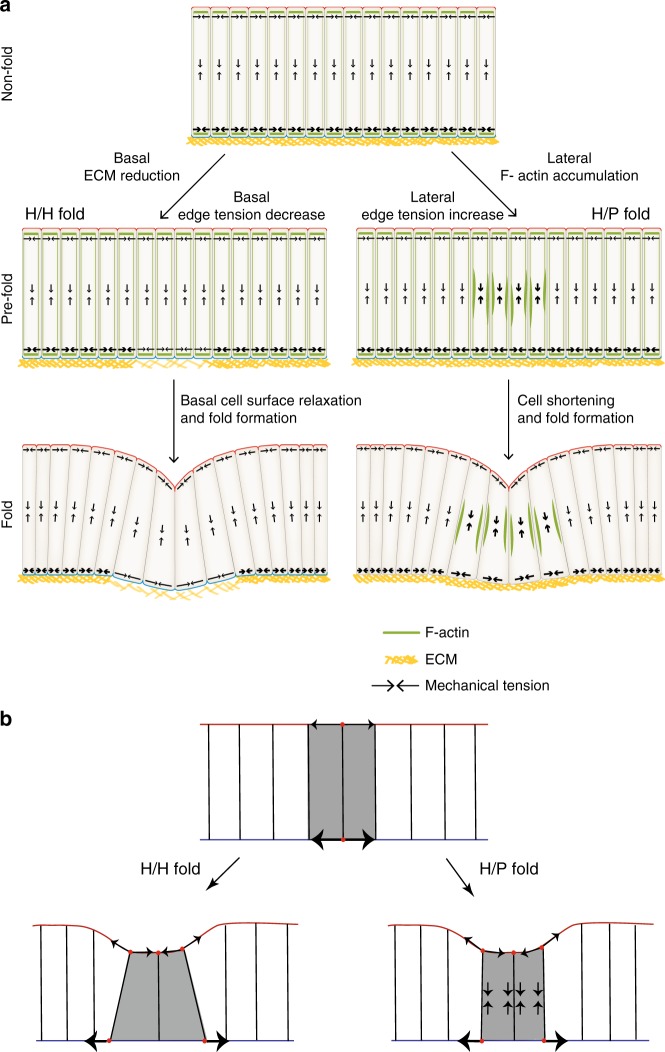
Epithelial folding transforms simple sheets of cells into complex three-dimensional tissues and organs during animal development. Epithelial folding has mainly been attributed to mechanical forces generated by an apically localized actomyosin network, however, contributions of forces generated at basal and lateral cell surfaces remain largely unknown. Here we show that a local decrease of basal tension and an increased lateral tension, but not apical constriction, drive the formation of two neighboring folds in developing Drosophila wing imaginal discs. Spatially defined reduction of extracellular matrix density results in local decrease of basal tension in the first fold; fluctuations in F-actin lead to increased lateral tension in the second fold. Simulations using a 3D vertex model show that the two distinct mechanisms can drive epithelial folding. Our combination of lateral and basal tension measurements with a mechanical tissue model reveals how simple modulations of surface and edge tension drive complex three-dimensional morphological changes.


Conflict of interest statement

The authors declare no competing interests.

Figures

Fig. 1
Fig. 1
Quantitative analysis of cell shape changes during fold formation. a Schemes representing top views (above) and cross-sectional views (below) of wing imaginal discs before and after folding. The type of fold is indicated. be Top view (b, d) and cross-sectional (c, e) images of a time-lapse movie of a cultured 72 h AEL wing imaginal disc expressing Indy-GFP, showing formation of hinge-hinge (H/H) and hinge-pouch (H/P) folds. Time relative to first appearance of apical indentation (AAI) (i.e. the first time when the apical surface of fold cells is below the apical plane of neighboring cells) of H/H fold is shown. In this and the following figures, top views are shown with dorsal to the left and posterior up; in cross sections, the apical surface of columnar cells is to the top, unless otherwise indicated. Dotted lines in top views indicate position of the corresponding cross sections. Scale bars are 10 μm. f, g Top view (f) and cross-sectional (g) images of the boxed areas of the time-lapse movie shown in b and d at indicated time points. Scale bars are 10 μm. h, i Schemes showing simplified cell shapes before and during folding and the set of geometric parameters used. da and db denote the apical and basal deformations, la and lb denote the apical and basal cross-sectional lengths of cells located at the center of the fold, and htissue denotes the apico-basal height of cells neighboring the fold. jm Cross-sectional images of a time-lapse movie of a cultured wing imaginal disc expressing Indy-GFP (gray) in all cells and RFP (turquoise) in clones of cells of H/H fold (j, k) or of H/P fold (l, m). Red dots mark apical and basal vertices of RFP-labeled cells. Scale bars are 10 μm. nq Changes of the geometric parameters indicated in i during H/H (n, p) and H/P (o, q) fold formation as a function of time relative to AAI. All geometrical quantities are normalized by the cell height htissue of the surrounding tissue. Mean and s.e.m. are shown. n = 17 cross sections of 7 wing imaginal discs for n and p and n = 12 cross sections of 6 wing imaginal discs for o and q
Fig. 2
Fig. 2
Cell proliferation and the role of cell division for epithelial folding. a A wing imaginal disc of a 96 h after egg lay (AEL) larva carrying 48 h-old clones of cells marked by the expression of CD8-mCherry (Act5C>Gal4, UAS-CD8-mCherry, red). Adherens junctions are labeled by E-cad-GFP (gray). Scale bar is 10 μm. b Ratio of the average cell number per clone in the pouch and the average cell number per clone in the notum. Mean and s.e.m. are shown. n = 19 wing imaginal discs, 82 clones in the pouch region, and 59 clones in the notum region. cj Top view (c, d, g, h) and cross-sectional (e, f, i, j) images of time-lapse movies of control (cf) and Cdk1E1-24 mutant (gj) cultured wing imaginal discs expressing E-cad-GFP are shown for the indicated time points after shift to the restrictive temperature. Scale bars are 10 μm
Fig. 3
Fig. 3
Basal tension is higher than apical tension outside folds. ah Apical (a, c) and basal (e, g) views and cross-sectional images (b, d, f, h) of wing imaginal discs of 72 h AEL larvae co-expressing Utr-GFP and Sqh-cherry to visualize F-actin and Myosin regulatory light chain, respectively. The apical and basal sides of the columnar cells are indicated in the cross sections. In ad the apical side of the columnar cells was mounted closer to the coverslip, whereas in eh the basal side was mounted closer to the coverslip. Scale bars are 10 μm. il Wing imaginal disc pouch cells of 72 h AEL larvae expressing Indy-GFP before and 20 s after ablation of a single cell edge at the apical (i, j) or basal (k, l) side of the pouch epithelium. Scale bars are 10 μm. Red dots mark vertices of ablated cell edges. m Average recoil velocity of the two vertices at the end of an ablated cell edge within 0.25 s after ablation in the pouch region for wing imaginal discs of the indicated times AEL. Recoil velocities are shown for ablations of apical and basal cell edges, as indicated. Mean and s.e.m. are shown (n = 15 cuts) (***p < 0.001, Student’s t-test)
Fig. 4
Fig. 4
Basal tension depends on ECM. ah Apical (a, e) and cross-sectional (b, c, f, g) views of a wing imaginal disc before (ad) and 60 min after (eh) addition of collagenase to the culture medium are shown. Magnifications of the boxed areas are shown in c and g. d, h Corresponding basal views. Dotted lines indicate position of cross section. Scale bars are 10 μm. i Apical and basal cross-sectional cell area before (0 min) and 60 min after addition of collagenase to the culture medium are shown. Mean and s.e.m. are shown (n = 365 (apical, 0 min), 357 (apical, 60 min), 445 (basal, 0 min), and 354 (basal, 60 min) cells of 4 wing imaginal discs) (***p < 0.001, Student’s t-test). j Average recoil velocity of the two vertices at the end of an ablated cell edge in the pouch region of 72 h AEL wing imaginal discs before and 60 min after addition of collagenase within 0.25 s after ablation. Recoil velocities are shown for ablations of apical and basal cell edges, as indicated. Mean and s.e.m. are shown (n = 15 cuts) (***p < 0.001, Student’s t-test)
Fig. 5
Fig. 5
Local reduction of ECM and basal tension in H/H fold. a Average recoil velocity of the two vertices at the end of an ablated cell edge in the H/H pre-fold region within 0.25 s after ablation for wing imaginal discs of the indicated times AEL. Recoil velocities are shown for ablations of apical and basal cell edges, as indicated. Mean and s.e.m. are shown (n = 15 cuts) (***p < 0.001, Student’s t-test). bg Basal (b, d, f) and cross-sectional (c, e, g) views of wing imaginal discs at the indicated stages expressing Vkg-GFP and Indy-GFP are shown. Green and magenta arrows point to the H/H and H/P fold, respectively. Scale bars are 10 μm. h Ratio of basal Vkg-GFP pixel intensity for H/H fold cells and neighboring cells of 72 h AEL wing imaginal discs are shown. Mean and s.e.m. are shown (n = 4 wing imaginal discs). i Average recoil velocity of the two vertices at the end of an ablated cell edge of control cells and cells expressing MMP2 within 0.25 s after ablation. Recoil velocities are shown for ablations of apical and basal cell edges, as indicated. Mean and s.e.m. are shown (n = 15 cuts) (***p < 0.001, Student’s t-test). j Cross-sectional view of a wing imaginal disc expressing MMP2 in a stripe of cells under control of dpp-Gal4 labeled by expression of CD8-mCherry (red). F-actin staining is shown in gray. Larvae were incubated for 24 h at 29 °C before dissection to induce MMP2 expression. Scale bar is 10 μm
Fig. 6
Fig. 6
Increased F-actin and tension at lateral cell interfaces in H/P fold. a, b Middle (13 μm below apical surface) XY layer (a) and cross-sectional images (b) of a time-lapse movie of a cultured wing imaginal disc expressing Utr-GFP to label F-actin. The region of the H/P fold is shown. Scale bars are 10 μm. c Kymogram of cross sections of Utr-GFP-expressing cells in cultured wing imaginal discs showing the dynamics of F-actin in H/P fold cells. Scale bar is 10 μm. d Lateral F-actin intensity al (full line) and cell height h (dashed line) for a H/P fold cell (magenta) and a neighboring cell (gray) as a function of time. e Close-up view of lateral F-actin intensity al (full line) and cell height h (dashed line) for a H/P fold cell as a function of time. f Cross correlation function between the relative rate of change of lateral F-actin intensity (1/al) dal/dt and rate of relative height change (1/h)dh/dt as a function of time offset (1alda1dtt1hdhdtt+τ as a function of τ). Dotted lines: correlation for twelve individual fold cross sections; black line: average correlation (n = 12). The cross correlation is negative for positive time lags and reaches a minimum for a time lag around 22 s. g, h Kymograms of cross sections of Utr-GFP-expressing neighboring cells (g) or H/P fold cells (h) before and after ablation of a lateral cell interface. Red lines indicate the time and position of the ablation. Scale bar is 10 μm. i Increase of the width of the ablated region along the apical-basal axis upon laser cutting of lateral cell interfaces of H/P fold cells and neighboring cells as a function of time after ablation. Mean and s.e.m. are shown (n = 15 cuts). j Average recoil velocity within 1 s of ablation of lateral cell interfaces of H/P fold cells and neighboring cells. Mean and s.e.m. are shown (n = 15 cuts) (***p < 0.001, Student’s t-test)
Fig. 7
Fig. 7
3D vertex model simulations of fold formation. a In the 3D vertex model, tissue geometry is represented by a set of apical and basal vertices with positions xia,xib. Cell volume is conserved. In addition, forces acting on vertices arise from apical, basal, and lateral surface tensions (Ta,Tb,Tl) and apical and basal edge tensions at cell–cell contacts (Λa,Λb). Attachment of the basal vertices to the extracellular matrix is represented by elastic springs with spring constant k. b 3D vertex model representation of the wing imaginal disc epithelium. A packing of identical cells is prepared at mechanical equilibrium, with periodic boundary conditions and mechanical parameters chosen to reproduce the cell aspect ratio in wing imaginal discs. Basal edge and surface tensions are taken four times larger than apical edge and surface tensions. A stripe of pre-fold cells is introduced, with either decreased basal surface and edge tensions Tb and Λb (“basal tension decrease”, upper schematic), or increased lateral surface tension Tl (“lateral tension increase”, lower schematic). The tissue configuration is then relaxed to a new state of mechanical equilibrium. c Quantification of tissue shape changes in 3D vertex model simulations of fold formation. Geometric parameters (Fig. 1i) as function of the relative decrease of basal edge and surface tension −δb and relative increase in lateral surface tensions δl within pre-fold cells. Mean and s.e.m. are shown (n = 4 simulations). Vertical dashed line: initial conditions of simulations prior to fold formation. Basal tension decrease and lateral tension increase lead to folds with a pronounced apical indentation and small basal outward deformations, as observed in H/H and H/P folds (Fig. 1n, o). A more pronounced expansion of basal cell cross-sectional length lb is observed for the basal tension decrease, similar to the largest basal expansion observed in the H/H fold compared to the H/P fold (Fig. 1p, q). d Representative experimental images of H/H (top) and H/P (bottom) folds at successive times, and equilibrium shape of 3D vertex model simulations at increasing magnitude of basal edge and surface tension decrease (top) and lateral tension increase (bottom)
Fig. 8
Fig. 8
Two distinct mechanisms drive H/H and H/P fold formation. a Top: scheme of a cross-sectional view of an unfolded epithelium. Note that basal tension is greater than apical tension. Basal tension depends on ECM. The H/H fold and the H/P fold form through two distinct mechanisms. Left: prior to H/H fold formation (pre-fold) a local reduction of ECM leads to a relaxation of basal tension. The decrease of basal tension results in the widening of the basal side of the pre-fold cells; cells adopt a wedge-like shape that drives fold formation. Right: prior and during H/P fold formation, fluctuations of F-actin accumulation at lateral cell interfaces leads to increased lateral tension driving pulsatile cell height contractions. Since apical tension is lower than basal tension, cell shortening leads to apical invagination and fold formation. b Simplified picture of mechanism of fold formation. Top: basal tension is greater than apical tension in the unfolded epithelium. Left: in the H/H fold, high basal tension of the neighboring cells stretches the basal surface of the fold cells, in which basal tension is reduced. Cells widen basally and reduce cell height to maintain their volume. Right: in the H/P fold, high lateral tension leads to a reduction in cell height. Since basal tension is high, the shortened cells deform the apical surface inwards, while the basal surface resists deformation

Similar articles

Cited by

References

    1. Martin AC, Goldstein B. Apical constriction: themes and variations on a cellular mechanism driving morphogenesis. Development. 2014;141:1987–1998. doi: 10.1242/dev.102228. - DOI - PMC - PubMed
    1. Sawyer JM, et al. Apical constriction: a cell shape change that can drive morphogenesis. Dev. Biol. 2010;341:5–19. doi: 10.1016/j.ydbio.2009.09.009. - DOI - PMC - PubMed
    1. Zartman JJ, Shvartsman SY. Unit operations of tissue development: epithelial folding. Annu. Rev. Chem. Biomol. Eng. 2010;1:231–246. doi: 10.1146/annurev-chembioeng-073009-100919. - DOI - PMC - PubMed
    1. Gilmour D, Rembold M, Leptin M. From morphogen to morphogenesis and back. Nature. 2017;541:311–320. doi: 10.1038/nature21348. - DOI - PubMed
    1. Nikolopoulou E, Galea GL, Rolo A, Greene ND, Copp AJ. Neural tube closure: cellular, molecular and biomechanical mechanisms. Development. 2017;144:552–566. doi: 10.1242/dev.145904. - DOI - PMC - PubMed

Publication types

MeSH terms

LinkOut - more resources