. 2019 Jan;51(1):163-174.
doi: 10.1038/s41588-018-0262-1. Epub 2018 Nov 5.

Comparative genomics of the major parasitic worms

Collaborators

Comparative genomics of the major parasitic worms

International Helminth Genomes Consortium. Nat Genet. 2019 Jan.

Abstract

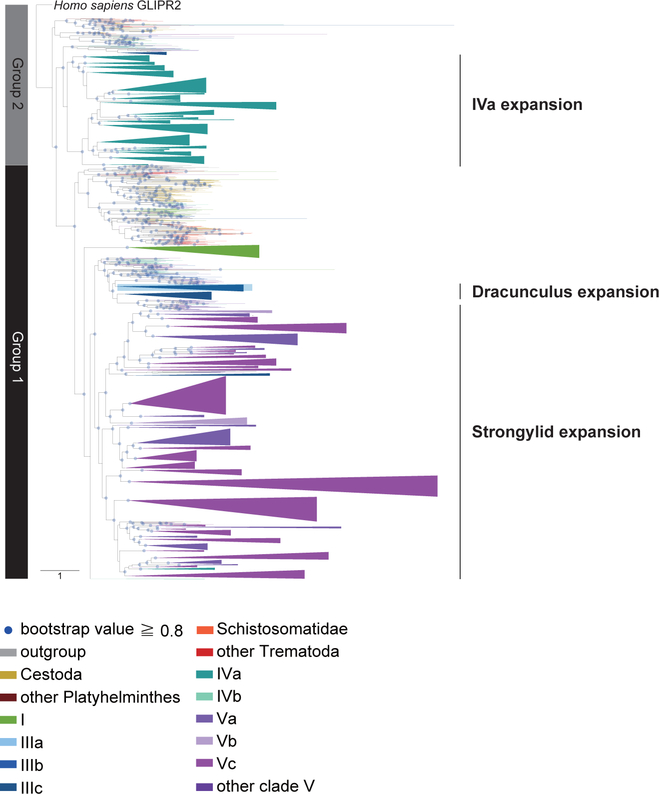
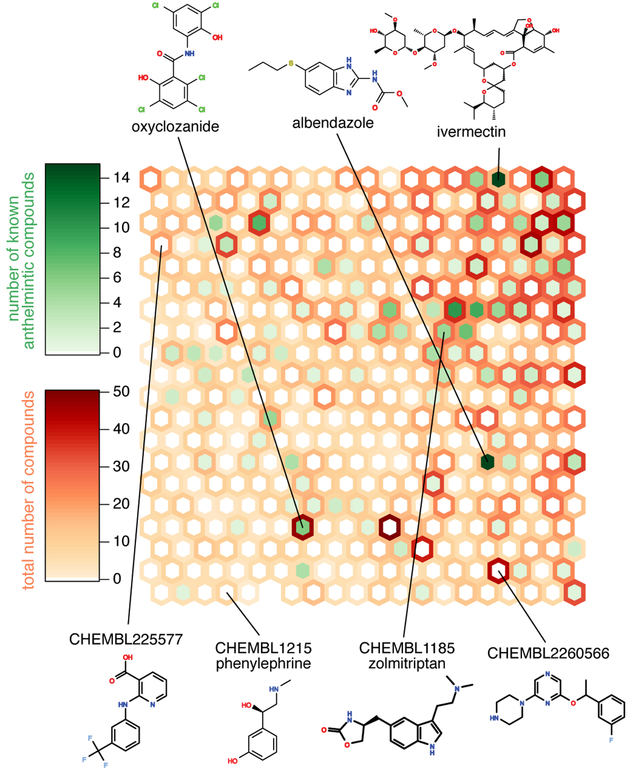
Parasitic nematodes (roundworms) and platyhelminths (flatworms) cause debilitating chronic infections of humans and animals, decimate crop production and are a major impediment to socioeconomic development. Here we report a broad comparative study of 81 genomes of parasitic and non-parasitic worms. We have identified gene family births and hundreds of expanded gene families at key nodes in the phylogeny that are relevant to parasitism. Examples include gene families that modulate host immune responses, enable parasite migration though host tissues or allow the parasite to feed. We reveal extensive lineage-specific differences in core metabolism and protein families historically targeted for drug development. From an in silico screen, we have identified and prioritized new potential drug targets and compounds for testing. This comparative genomics resource provides a much-needed boost for the research community to understand and combat parasitic worms.


Conflict of interest statement

Competing interests

The authors declare no competing interests.

Figures

Fig. 1:
Fig. 1:. Genome-wide phylogeny of 56 nematode, 25 platyhelminth species and 10 outgroup species.
(a) Maximum-likelihood phylogeny based on a partitioned analysis of a concatenated data matrix of 21,649 amino acid sites from 202 single-copy orthologous proteins present in at least 23 of the species. Values on marked nodes are bootstrap support values; all unmarked nodes were supported by 100 bootstrap replicates; nodes with solid marks were constrained in the analysis. Bar plots show genome sizes and total lengths of different genome features, and normalised gene count (Supplementary Note 1.2) for proteins with inferred functions based on sequence similarity (having an assigned protein name; Methods), or those without (named ‘hypothetical protein’). Species for which we have sequenced genomes are marked with asterisks; 33 ‘tier 1’ genomes are in black. (b) Assembly statistics. Blue rows indicate the 33 ‘tier 1’ genomes. Asterisks indicate the species for which we have sequenced genomes.
Fig. 2:
Fig. 2:. Functional annotation of synapomorphic and expanded gene families.
(a) Rectangular matrices indicate counts of synapomorphic families grouped by 18 functional categories, detailed in the major panel. Representative functional annotation of a family was inferred if more than 90% of the species present contained at least one gene with a particular domain. The node in the tree to which a panel refers is indicated in each matrix. ‘Other’ indicates families with functional annotation that could not be grouped into one of the 18 categories. ‘None’ indicates families that had no representative functional annotation. (b) Expansions of apyrase and PUMA gene families. Families were defined using Compara. For colour key and species labels, see Fig. 1. The plot for a family shows the gene count in each species, superimposed upon the species tree. A scale bar beside the plot for a family shows the minimum, median, and maximum gene count across the species, for that family.
Fig. 3:
Fig. 3:. Distribution and phylogeny of SCP/TAPS genes.
A maximum-likelihood tree of SCP/TAPS genes. Colours represent different species groups. H. sapiens GLIPR2 was used to root the tree. Blue dots show high bootstrap values (≥0.8). A clade was collapsed into a triangle if more than half its leaves were genes from the same species group. Nematode clade I had fewer counts, but was collapsed to show its relationship to other clades’ expansions. ‘Strongylid’ refers to clades Va, Vb and Vc.
Fig. 4:
Fig. 4:. Abundances of superfamilies historically targeted for drug development.
Relative abundance profiles for 84 protease and 31 protease inhibitor families represented in at least 3 of the 81 nematode and platyhelminth species. 33 protease families and 6 protease inhibitor families present in fewer than 3 species were omitted from the visualisation. For each species, the gene count in a class was normalised by dividing by the total gene count for that species. Families mentioned in the Results or Supplementary Note text are labelled; complete annotations of all protease families are in Supplementary Table 11.
Fig. 5:
Fig. 5:. Metabolic modules and biochemical pathways in platyhelminths and nematodes.
(a) Topology based detection of KEGG metabolic modules among tier 1 species (dark green = present; light green = largely present (only one enzyme not found)). Only modules detected to be complete in at least one species are shown. The EC annotations used for this figure included those from pathway hole-filling and those based on Compara families (Supplementary Table 18a, b). (b) Biochemical pathways that appear to have been completely or partially lost from certain platyhelminth and nematode clades.
Fig. 6:
Fig. 6:. Self-organising map of known anthelmintic compounds and the proposed screening set of 5046 drug-like compounds.
A self-organising map (SOM) clustering known anthelmintic compounds (Supplementary Table 21a) and our proposed screening set of 5046 compounds. The density of red and green shows the number of screening set and known anthelmintic compounds clustered in each cell, respectively. Structures for representative known anthelmintic compounds are shown at the top, and examples from the proposed screening set along the bottom.

Comment in

  • Opening up a large can of worms.
    Sternberg PW. Sternberg PW. Nat Genet. 2019 Jan;51(1):10-11. doi: 10.1038/s41588-018-0317-3. Nat Genet. 2019. PMID: 30514910 No abstract available.

References

    1. G.B.D. 2015 Disease and Injury Incidence and Prevalence Collaborators. Global, regional, and national incidence, prevalence, and years lived with disability for 310 diseases and injuries, 1990–2015: a systematic analysis for the Global Burden of Disease Study 2015. Lancet 388, 1545–1602 (2016). - PMC - PubMed
    1. Charlier J, van der Voort M, Kenyon F, Skuce P & Vercruysse J Chasing helminths and their economic impact on farmed ruminants. Trends Parasitol 30, 361–7 (2014). - PubMed
    1. Jones JT et al. Top 10 plant-parasitic nematodes in molecular plant pathology. Mol Plant Pathol 14, 946–61 (2013). - PMC - PubMed
    1. Furtado LF, de Paiva Bello AC & Rabelo EM Benzimidazole resistance in helminths: From problem to diagnosis. Acta Trop 162, 95–102 (2016). - PubMed
    1. Kaplan RM & Vidyashankar AN An inconvenient truth: global worming and anthelmintic resistance. Vet Parasitol 186, 70–8 (2012). - PubMed

Methods-only References

    1. Simpson JT & Durbin R Efficient de novo assembly of large genomes using compressed data structures. Genome Res 22, 549–56 (2012). - PMC - PubMed
    1. Gremme G, Steinbiss S & Kurtz S GenomeTools: a comprehensive software library for efficient processing of structured genome annotations. IEEE/ACM Trans Comput Biol Bioinform 10, 645–56 (2013). - PubMed
    1. Zerbino DR & Birney E Velvet: algorithms for de novo short read assembly using de Bruijn graphs. Genome Res 18, 821–9 (2008). - PMC - PubMed
    1. Boetzer M, Henkel CV, Jansen HJ, Butler D & Pirovano W Scaffolding pre-assembled contigs using SSPACE. Bioinformatics 27, 578–9 (2011). - PubMed
    1. Boetzer M & Pirovano W Toward almost closed genomes with GapFiller. Genome Biol 13, R56 (2012). - PMC - PubMed

Publication types