Clinical Trial
. 2018 Dec;24(12):1845-1851.
doi: 10.1038/s41591-018-0232-2. Epub 2018 Nov 5.

Radiotherapy induces responses of lung cancer to CTLA-4 blockade

Affiliations
Clinical Trial

Radiotherapy induces responses of lung cancer to CTLA-4 blockade

Silvia C Formenti et al. Nat Med. 2018 Dec.

Abstract

Focal radiation therapy enhances systemic responses to anti-CTLA-4 antibodies in preclinical studies and in some patients with melanoma1-3, but its efficacy in inducing systemic responses (abscopal responses) against tumors unresponsive to CTLA-4 blockade remained uncertain. Radiation therapy promotes the activation of anti-tumor T cells, an effect dependent on type I interferon induction in the irradiated tumor4-6. The latter is essential for achieving abscopal responses in murine cancers6. The mechanisms underlying abscopal responses in patients treated with radiation therapy and CTLA-4 blockade remain unclear. Here we report that radiation therapy and CTLA-4 blockade induced systemic anti-tumor T cells in chemo-refractory metastatic non-small-cell lung cancer (NSCLC), where anti-CTLA-4 antibodies had failed to demonstrate significant efficacy alone or in combination with chemotherapy7,8. Objective responses were observed in 18% of enrolled patients, and 31% had disease control. Increased serum interferon-β after radiation and early dynamic changes of blood T cell clones were the strongest response predictors, confirming preclinical mechanistic data. Functional analysis in one responding patient showed the rapid in vivo expansion of CD8 T cells recognizing a neoantigen encoded in a gene upregulated by radiation, supporting the hypothesis that one explanation for the abscopal response is radiation-induced exposure of immunogenic mutations to the immune system.


Conflict of interest statement

Competing interests: Bristol Meyer Squibb did not have any role in the design, data collection and analysis, interpretation of results and preparation of the manuscript. Potential conflict of interest: Full-time employment and equity ownership at Adaptive Biotechnologies Corporation (R.O.E.). Prior honorarium for consulting from Neon Therapeutics and research funding from Agenus (S.G.). Prior honorarium for consulting from AstraZeneca, AbbVie, Lytix Biopharma, Cytune. Research grants from Nanobiotix, and Lytix Biophrama (S.D.). Prior honorarium for consulting/speaker from AstraZeneca, Merck, Regeneron, Bayer, Serono, and research funding from Varian, Merck, Bristol Meyer Squibb (S.C.F.).

Figures

Figure 1.
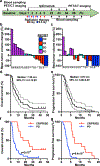
Figure 1.. Patients survival and clinical response to radiotherapy and ipilimumab.
(a) Treatment, imaging, and blood sampling schema (FU: follow up). (b) Waterfall plot of aggregate tumor volume change in all non-irradiated lesions. Numbers at the bottom indicate patient ID#. Patient 43 was classified as PD due to a new lesion. One patient had lesions that could not be accurately measured radiographically and is not included in the graph, but was considered as PD due to new lesions. (c) Best tumor volume change indicates the tumor volume change in the non-irradiated metastasis with the biggest change from baseline in each patient. Kaplan-Meier estimates of (d) overall survival and (e) progression-free survival for all patients (n=39). Comparison of (f) overall and (g) progression free survival between patients with disease control (CR+PR+SD; n=12) and with PD (n=27). Overall survival was 20.4 (95% CI: 12.9-not reached) and 3.5 (95% CI: 3.1–7.4) months for CR/PR/SD and PD, respectively. Progression free survival was 7.1 (95% CI: 5.9-not reached) and 3.0 (95% CI: 2.4–3.8) months for CR/PR/SD and PD, respectively. Statistical significance was determined using a two-sided log-rank test.
Figure 2.
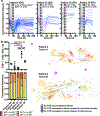
Figure 2.. Increase in interferon-β levels and TCR clonal dynamics predict response to treatment.
(a) IFNβ serum levels at baseline (filled circles) and 22 days after treatment start (empty circle). The values for patient#4 are indicated in red. NE indicates non evaluable patients. T cell receptor (TCR) sequencing was performed on peripheral blood at baseline and day 22. Number of (b) expanded and (c) contracted TCR clones at day 22 compared to baseline. For panels a, and b and c, statistical significance was determined using the two-sided Student’s t-test and one-way ANOVA, respectively (p-values: * < 0.05, ** < 0.01, *** < 0.001, and **** < 0.0001). Circles, horizontal lines, and error bars represent data-points for individual patients, means, and standard deviations, respectively. (d) Random Forest (RF) classification of patients using variables with statistically significant difference between day 22 and baseline for any RECIST response group (Supplementary Dataset 2). For IFNβ, expanded and contracted clones, and anti-sMICA and sMICB antibodies (AB) measurements, n = 7, 5, and 8 patients for CR/PR, SD, and PD response groups, respectively. For all other measurements, n = 4, 5, and 8 patients for CR/PR, SD, and PD response groups, respectively. Performance of the RF classifications is shown under the heat-map. ‘Correct RECIST’ indicates the actual treatment response of each patient whereas ‘Classified as’ indicates how patients were classified using RF modeling. Additionally, mean and standard deviations of variable importance scores were determined (top predictive variables: red bars with filled pattern) from 1000 executions.
Figure 3.
Figure 3.. Expansion of tumor-derived TCR clones in peripheral blood after treatment with radiotherapy and Ipilimumab.
(a) TCR-seq was performed on tumor (T) and blood of patient #4 with CR, patient #32 with SD, and patients #36 and 38 with PD. TCR clones shown were present in tumor and significantly expanded in blood from baseline at any of the time points (day 22, day 43, day 64) during treatment. Each line represents a single TCR clone. n.d.: not detected. (b) Top graph: number of intra-tumoral CD8+ T cells per 200X field as determined by immunohistochemistry. Circles, horizontal lines, and error bars represent data-points, means, and standard deviations, respectively. N=3 fields for patients 4 (tumor A), 36, and 38. N=5 fields for patients 4 (tumor B) and 32. One-way ANOVA with Tukey’s multiple comparisons test was used to determine statistical significance (p-values: * < 0.05, ** < 0.01, *** < 0.001, and **** < 0.0001). Bottom graph: Frequency space occupied by TCR clones of different sizes. Colors indicate size of TCR clones. (c) Sequence similarity of TCRs with frequency >0.1% in the two pre-treatment brain metastases of patient #4. A distance matrix based on Needleman-Wunch (NW) similarity score was calculated for TCRs not increased in blood (yellow) and TCRs increased in blood during treatment and present in one (blue) or both (purple) tumors. The Neighbor Joining method was used to construct TCRβ CDR3 sequence similarity dendrograms, visualized as unrooted dendrograms. Area of circles represents frequency of the TCR clone.
Figure 4.
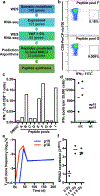
Figure 4.. Expansion of neoantigen-reactive CD8 T cells in a NSCLC patient with complete response to radiotherapy and ipilimumab.
(a) Pipeline for neoantigen prediction. The somatic mutations identified by whole exome sequencing (WES) were filtered for expression of the mutated gene by RNAseq, variant allele frequency (VAF; variant reads/total reads) > 0%, and binding to MHC-I alleles expressed by the tumor. Selected peptides containing these neoepitopes were synthesized for functional testing. (b-c) Flow cytometry analysis of IFNγ+ CD8 T cells after overnight stimulation of the post-treatment patient PBMC with different peptides pools (33 peptides in 9 pools, each peptide was present in 3 separate pools) or DMSO as control. (d) Reactivity to two peptides (p15 and p16) with the mutated (mt) or the germline (wt) KPNA2 amino acid sequence was tested in IFNγ ELISPOT assay. Measurements (circles) including means (lines) are shown (n=2 independent samples). The dotted line indicates 50 spots per well (cut-off for positive signal). (e) KPNA2 mutation-reactive CD8 T cells were identified by intracellular IFNγ expression and sorted for TCR-seq analysis. Frequency of the TCR clones from the sorted p15- and p16-reactive CD8 T cells in the patient blood at baseline (BL) and after treatment start. (f) KPNA2 gene expression measured by RT-qPCR (n=2 for 0 and 1 X 8 Gy, and n=4 for 3 X 8 Gy) in a NSCLC PDX tumor 24 hours after in vivo irradiation. Expression levels were normalized 0 Gy group average. Measurements (circles) including means (lines) are shown.

Comment in

References

    1. Formenti SC & Demaria S Systemic effects of local radiotherapy. Lancet Oncol 10, 718–726 (2009). - PMC - PubMed
    1. Demaria S, Coleman CN & Formenti SC Radiotherapy: Changing the Game in Immunotherapy. Trends Cancer 2, 286–294 (2016). - PMC - PubMed
    1. Postow MA, et al. Immunologic correlates of the abscopal effect in a patient with melanoma. N Engl J Med 366, 925–931 (2012). - PMC - PubMed
    1. Burnette BC, et al. The efficacy of radiotherapy relies upon induction of type i interferon-dependent innate and adaptive immunity. Cancer Res 71, 2488–2496 (2011). - PMC - PubMed
    1. Deng L, et al. STING-Dependent Cytosolic DNA Sensing Promotes Radiation-Induced Type I Interferon-Dependent Antitumor Immunity in Immunogenic Tumors. Immunity 41, 843–852 (2014). - PMC - PubMed

Publication types

MeSH terms