. 2018 Dec;24(12):1930-1939.
doi: 10.1038/s41591-018-0237-x. Epub 2018 Nov 5.

Longitudinal personal DNA methylome dynamics in a human with a chronic condition

Affiliations

Longitudinal personal DNA methylome dynamics in a human with a chronic condition

Rui Chen et al. Nat Med. 2018 Dec.

Abstract

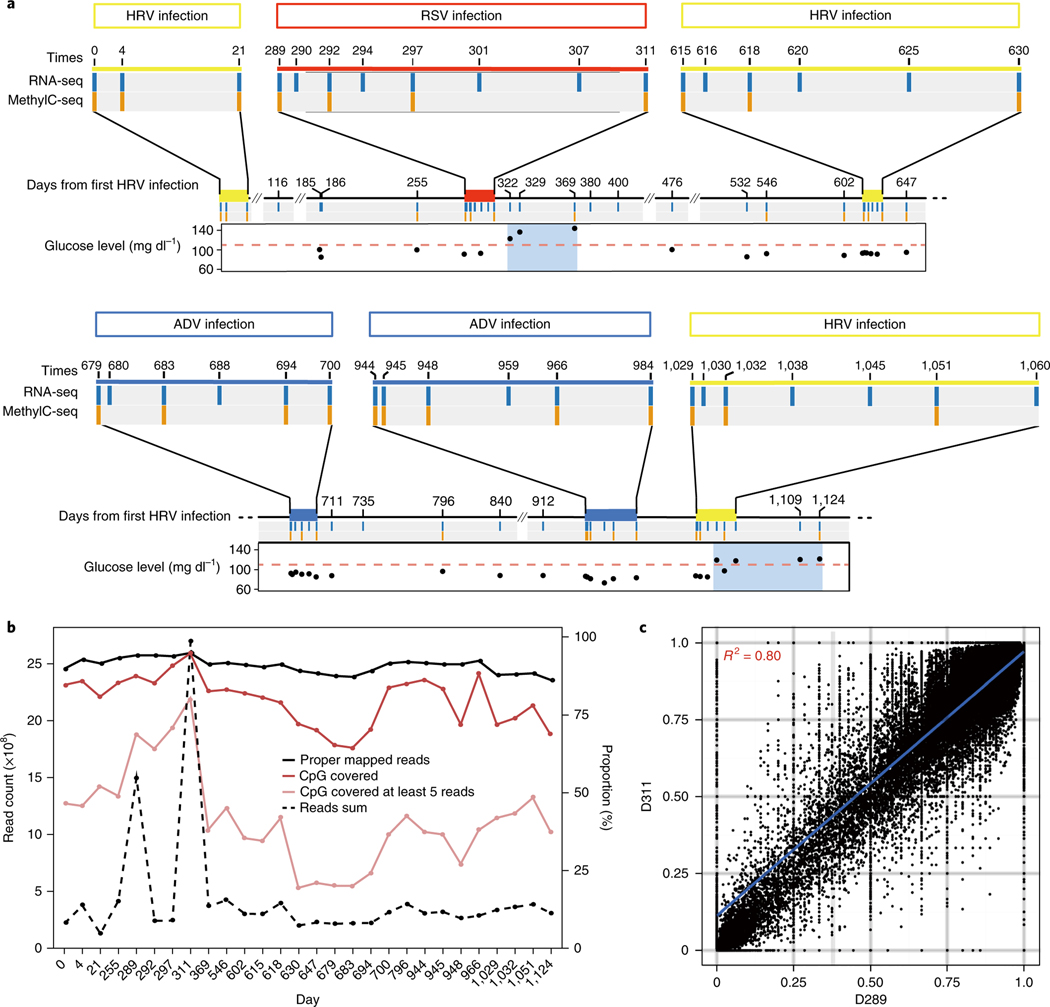
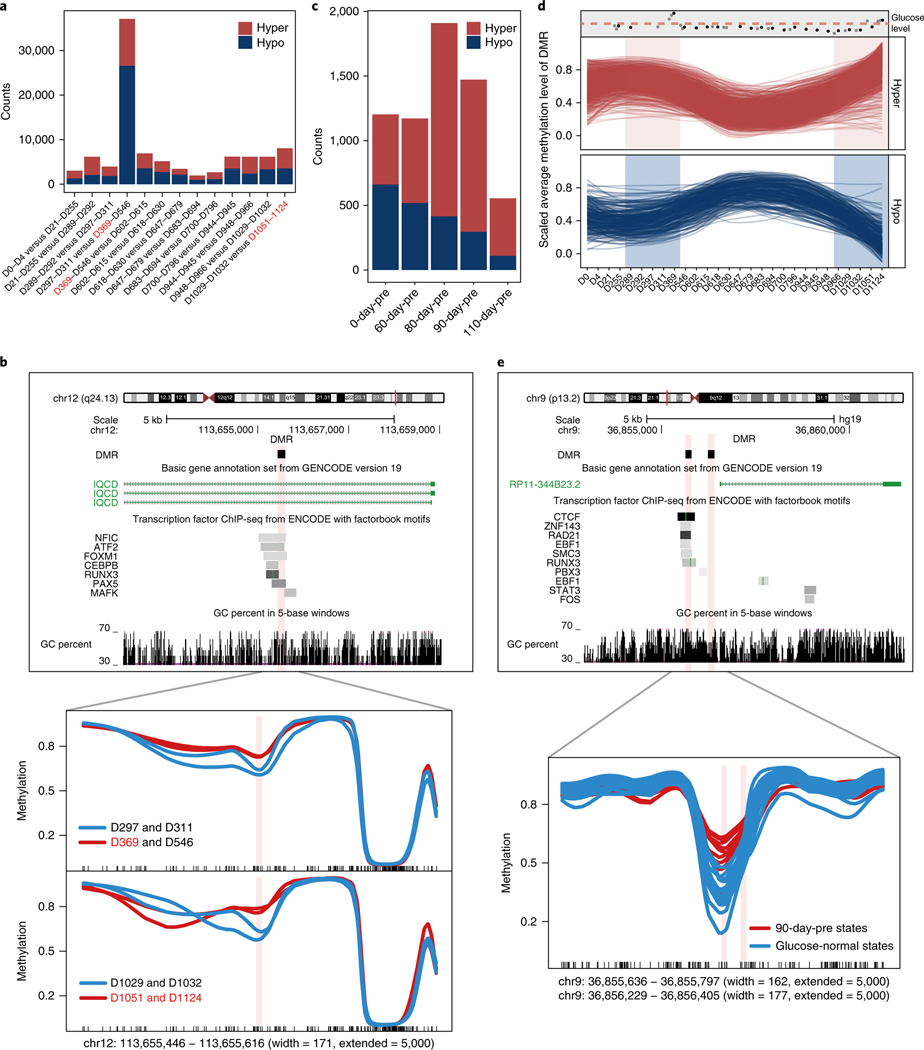
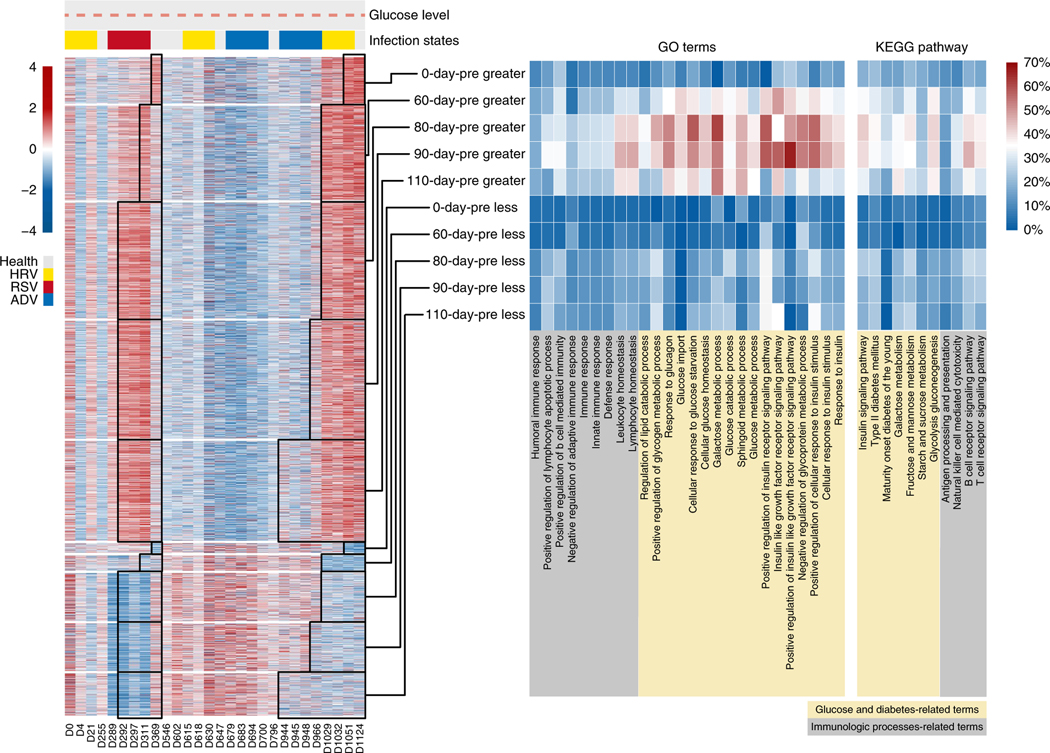
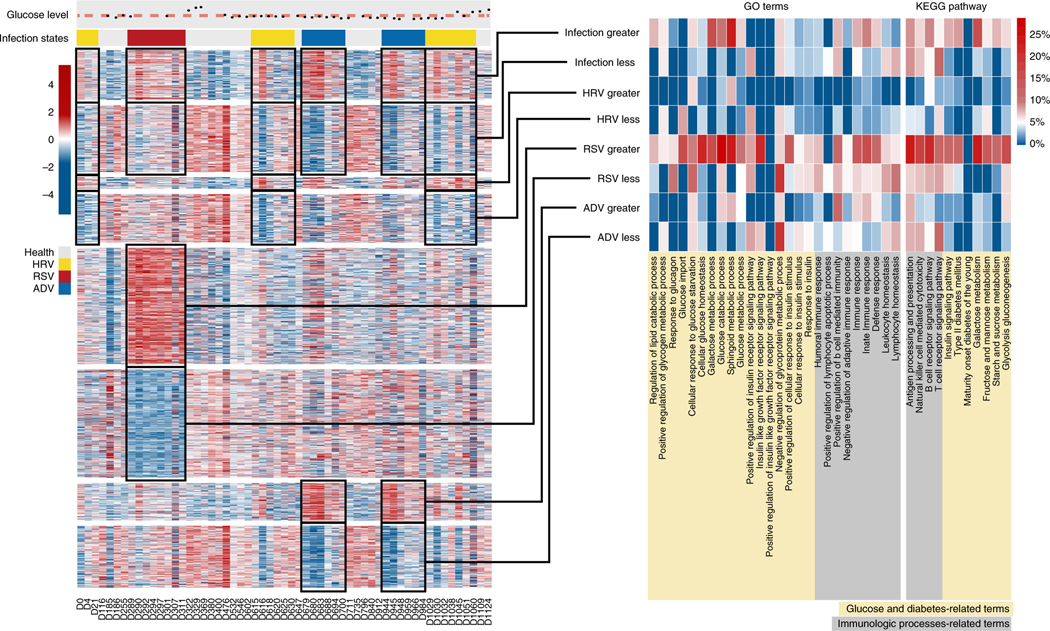
Epigenomics regulates gene expression and is as important as genomics in precision personal health, as it is heavily influenced by environment and lifestyle. We profiled whole-genome DNA methylation and the corresponding transcriptome of peripheral blood mononuclear cells collected from a human volunteer over a period of 36 months, generating 28 methylome and 57 transcriptome datasets. We found that DNA methylomic changes are associated with infrequent glucose level alteration, whereas the transcriptome underwent dynamic changes during events such as viral infections. Most DNA meta-methylome changes occurred 80-90 days before clinically detectable glucose elevation. Analysis of the deep personal methylome dataset revealed an unprecedented number of allelic differentially methylated regions that remain stable longitudinally and are preferentially associated with allele-specific gene regulation. Our results revealed that changes in different types of 'omics' data associate with different physiological aspects of this individual: DNA methylation with chronic conditions and transcriptome with acute events.


Conflict of interest statement

Competing interests

The authors declare no competing interests.

Figures

Fig. 1 |
Fig. 1 |. Overview of methylome and transcriptome data during time series.
a, Summary of time course study. The subject was monitored for 1,124 d, during which there were 6 infections (yellow bar, HRV infection; red bar, RSV infection; blue bar, ADV infection). Fifty-seven RNA-seq (blue column, n =  57 independent samples) and 28 MethylC-seq (orange column, n =  28 independent samples) samples were generated. Point plot shows the changes in glucose level; the pink dashed line represents the upper limit of the healthy glucose level. Glycated hemoglobin A1c levels generally followed the same trend as the glucose levels (not shown). b, Statistics for MethylC-seq data. The left y axis is for the dashed line. The right y axis is for solid lines. c, Scatter plot shows high correlation of methylation levels between day 289 (D289) and D311 samples (n =  2 independent samples, Spearman correlation).
Fig. 2 |
Fig. 2 |. The dynamic pattern of the whole-genome methylome.
a, Bar plot shows the counts of DMRs between adjacent time points. The glucose-elevated time points are marked in red. b, Genome browser view of an example DMR (upper panel) shared between two glucose-elevated events. The methylation levels in the DMR were significantly higher at glucose-elevated time points compared with previous time points (lower panel). The glucose-elevated time points are marked in red. ChIP-seq, chromatin immunoprecipitation sequencing; IQCD, IQ motif containing D. c, Bar plot shows the counts of DMRs between extended glucose-elevated and glucose-normal states. d, Time-course dynamics of methylation levels of DMRs shared by 80-day-pre states and 90-day-pre states. 90-day-pre states are shaded in red or blue. The methylation levels were scaled between 0 and 1. The changes in glucose levels during all measured time points are indicated at the top of the panel (gray points, glucose levels of time points without MethylC-seq data; black points, glucose levels of time points with MethylC-seq data; the pink dashed line represents the upper limit of the healthy glucose level). e, Genome browser view of two DMRs (upper panel) shared between 80-pre-day states and 90-pre-day states. The methylation levels in the DMRs were significantly higher at 90-daypre states compared with glucose-normal states (lower panel).
Fig. 3 |
Fig. 3 |. Methylomic changes were associated with glucose alterations.
Left panel: scaled methylation levels of differentially methylated promoters between glucose-elevated and glucose-normal states (crimson, highest methylation level; marine, lowest methylation level); the changes in glucose levels and infection states during all measured time points are indicated at the top of the heatmap (gray points, glucose levels of time points without MethylCseq data; black points, glucose levels of time points with MethylC-seq data; the pink dashed line represents the upper limit of the healthy glucose level; yellow bar, HRV infection; red bar, RSV infection; blue bar, ADV infection). No clustering was performed. Middle panel: percentages of glucose-related differentially methylated genes in glucose- and immune-related gene ontology (GO) terms. Right panel: percentages of glucose-related differentially methylated genes in glucose- and immune-related KEGG pathways.
Fig. 4 |
Fig. 4 |. Changes in gene expression during infection.
Left panel: scaled gene expression levels of DEGs between viral infection and normal states (crimson, highest methylation level; marine, lowest methylation level); the changes in glucose levels and infection states during all measured time points are indicated at the top of the heatmap (black points, glucose levels of time points; the pink dashed line represents the upper limit of the healthy glucose level; yellow bar, HRV infection; red bar, RSV infection; blue bar, ADV infection). No clustering was performed. Middle panel: percentages of infection-related DEGs in glucose- and immune-related gene ontology terms. Right panel: percentages of infection-related DEGs in glucose- and immune-related KEGG pathways.
Fig. 5 |
Fig. 5 |. Annotation of the differentially methylated sites related to glucose elevation and DeGs during viral infection.
a, Bar plot shows the proportion of various types of regulatory regions (defined by chromHMM, Epigenome identity: E029) in gDMSs that were significantly higher than in the whole genome. b, Heatmap of gene expression profile of 116 DEGs shared by 2 ADV infection events (gray bar, health condition; yellow bar, HRV infection; red bar, RSV infection; blue bar, ADV infection). c, Enriched gene ontology terms for the 46 DEGs (n =  33 biologically independent samples, Wilcoxon rank sum test, false discovery rate (FDR)-adjusted P value < 0.05) that showed downregulation at the beginning of ADV infection and were gradually upregulated until the end of the infection period.
Fig. 6 |
Fig. 6 |. Allele-specific methylation regions profile.
a, Histogram shows the distribution of the number of allele-specific methylation sites with the largest changes among samples. The x axis denotes the absolute value of the largest changes of methylation percentage; the y axis denotes the numbers of sites. The pie chart shows the ratio of sites with methylation-level changes. Almost all of the allele-specific identities of the allele-specific methylation loci were consistent over time. b, Pie chart shows the fraction of different lengths of allele-specific DMRs. c, Upper panel shows the distribution of numbers of SNPs and length of chromosomes; lower panel shows the distribution of the numbers of aDMRs (right y axis) and the total numbers of genes in each chromosome (left y axis) (n =  28 independent samples). The numbers of aDMRs are highly correlated with number of genes (R2 =  0. 85, Spearman correlation).

Comment in

  • Personalized DNA methylomics.
    Wrighton KH. Wrighton KH. Nat Rev Genet. 2019 Jan;20(1):4-5. doi: 10.1038/s41576-018-0076-0. Nat Rev Genet. 2019. PMID: 30443004 No abstract available.

References

    1. Ball MP et al. Harvard Personal Genome Project: lessons from participatory public research. Genome Med. 6, 10 (2014). - PMC - PubMed
    1. Chen R et al. Personal omics profiling reveals dynamic molecular and medical phenotypes. Cell 148, 1293–1307 (2012). - PMC - PubMed
    1. Hood L & Friend SH Predictive, personalized, preventive, participatory (P4) cancer medicine. Nat. Rev. Clin. Oncol 8, 184–187 (2011). - PubMed
    1. Li-Pook-Than J & Snyder M iPOP goes the world: integrated personalized omics profiling and the road toward improved health care. Chem. Biol 20, 660–666 (2013). - PMC - PubMed
    1. Snyder M, Du J & Gerstein M Personal genome sequencing: current approaches and challenges. Genes Dev. 24, 423–431 (2010). - PMC - PubMed

Publication types