. 2018 Mar;5(1):011302.
doi: 10.1063/1.4998144. Epub 2018 Mar 7.

Stochasticity in materials structure, properties, and processing-A review

Affiliations

Stochasticity in materials structure, properties, and processing-A review

Robert Hull et al. Appl Phys Rev. 2018 Mar.

Abstract

We review the concept of stochasticity-i.e., unpredictable or uncontrolled fluctuations in structure, chemistry, or kinetic processes-in materials. We first define six broad classes of stochasticity: equilibrium (thermodynamic) fluctuations; structural/compositional fluctuations; kinetic fluctuations; frustration and degeneracy; imprecision in measurements; and stochasticity in modeling and simulation. In this review, we focus on the first four classes that are inherent to materials phenomena. We next develop a mathematical framework for describing materials stochasticity and then show how it can be broadly applied to these four materials-related stochastic classes. In subsequent sections, we describe structural and compositional fluctuations at small length scales that modify material properties and behavior at larger length scales; systems with engineered fluctuations, concentrating primarily on composite materials; systems in which stochasticity is developed through nucleation and kinetic phenomena; and configurations in which constraints in a given system prevent it from attaining its ground state and cause it to attain several, equally likely (degenerate) states. We next describe how stochasticity in these processes results in variations in physical properties and how these variations are then accentuated by-or amplify-stochasticity in processing and manufacturing procedures. In summary, the origins of materials stochasticity, the degree to which it can be predicted and/or controlled, and the possibility of using stochastic descriptions of materials structure, properties, and processing as a new degree of freedom in materials design are described.


Figures

FIG. 1.
FIG. 1.
Schematic representation of ways to account for stochasticity in the mathematical description of material behavior. Multiple realizations of a random microstructure subjected to potentially stochastic initial and boundary conditions and to forcing functions are evaluated by forward propagation with a physically relevant operator. The output is used to evaluate quantities of interest. The framework developed in this article is suggested by the control loop shown which indicates an optimization of the output based on controlling the stochastic parameters of the initial problem. An example is provided related to composite materials with stochastic microstructure. The control parameter selected is the correlation length of the spatial distribution of inclusions, λ, defined by the autocorrelation function ACF(r). The volume fraction of inclusions is identical in the two realizations, as suggested by the probability distribution function of elastic constants, p(C1111). The stress-strain curve is taken here as the quantity of interest and is obtained by solving a boundary value problem defined by the forward operator specific to mechanics. The quantity of interest is sensitive to the control parameter λ.
FIG. 2.
FIG. 2.
Specific volume of a glass-forming system as a function of temperature.
FIG. 3.
FIG. 3.
(a, left) Zero angle SAXS intensity of SiO2 glass samples with different fictive temperatures plotted as a function of temperature of measurement. The S numbers indicate the fictive temperature (°C) of silica glass. (b, right) Zero angle SAXS intensity of soda-lime silicate glass samples with different fictive temperatures plotted as a function of temperature of measurement. Tf values are fictive temperature of the samples. Reproduced with permission from Levelut et al., J. Non-Crystalline Solids 307–310, 426 (2002). Copyright 2003 Elsevier.
FIG. 4.
FIG. 4.
Zero angle SAXS intensity at room temperature of silica glass as a function of fictive temperature. The value for α-quartz was calculated and plotted at Tf = 0. From J. Appl. Phys. 94, 4824 (2003). Copyright 2003 AIP publishing LLC.
FIG. 5.
FIG. 5.
(a) Zero angle SAXS intensity at room temperature of SiO2 glasses with different F contents as a function of fictive temperature. The inset shows the values of the slopes of lines and indicates the lines have same slopes. From J. Appl. Phys. 95, 2432 (2004). Copyright 2004 AIP publishing LLC. (b) Rayleigh scattering intensity at 90° measured at room temperature for SiO2 glasses with various Cl contents as a function of fictive temperature. Reproduced with permission from Kakiuchida et al., Jpn. J. Appl. Phys., Part 2 42, L1526 (2003). Copyright 2003 The Japan Society of Applied Physics.
FIG. 6.
FIG. 6.
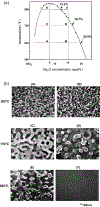
(a) Metastable immiscibility boundary of Na2O-SiO2 glass system. SEM images of glass-in-glass phase separated microstructures of Na2O-SiO2 glass system developed by heat-treatment at selected temperatures of selected glass compositions. These selected points are indicated in (a). Heat-treatment conditions were 800° C, 4 h; 700° C, 16 h; and 600° C, 30 h. Reproduced with permission from Fujita et al., J. Non-Cryst. Solids 328, 64 (2003). Copyright 2003 Elsevier.
FIG. 7.
FIG. 7.
Schematic diagram of Rayleigh scattering (center) and Brillouin scattering (L: longitudinal; T: transverse). Reproduced with permission from J. Zarzycki, Glasses and the vitreous state, translated by W. D. Scott and C. Massart (Cambridge University Press, 1982). Copyright 1982 Cambridge University Press.
FIG. 8.
FIG. 8.
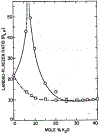
Landau-Placzek Ratio of SiO2-K2O glass. Square: density fluctuation; circle above square: composition fluctuation. Reproduced with permission from J. Schroeder, “Light scattering of glass,” in Treatise on Materials Science and Technology (Academic Press, 1977), Vol. 12. Copyright 1977 Academic Press.
FIG. 9.
FIG. 9.
V(k), the standard fluctuation electron microscopy signal, calculated at Q = 0.056 Å−1 for of CRN and structures with ~ 1nm ordered domains. Reproduced with permission from Dash et al., J. Phys. Condens. Matter 15, S2425 (2003). Copyright 2003 Institute of Physics.
FIG. 10.
FIG. 10.
The intensity autocorrelation functions, c(r) calculated for the simulated images of the four model structures. Q = 0.056 Å−1 and k = 0.56 Å−1. Reproduced with permission from Dash et al., J. Phys. Condens. Matter 15, S2425 (2003). Copyright 2003 Institute of Physics.
FIG. 11.
FIG. 11.
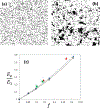
Realizations of a 2D particulate composite with (a) random and (b) exponentially correlated distribution of inclusions, and (c) the variation of the effective elastic modulus of the composite with the filler volume fraction for random filler spatial distributions (open circles and continuous line), filler distributions with exponential (filled circles and dashed line), and power function correlations (other filled symbols).
FIG. 12.
FIG. 12.
Probability distribution functions of the maximum principal stress in a composite with random filler distributions (open circles) and power function correlation of the filler spatial distribution (filled circles). The variable is normalized by its mean in both cases.
FIG. 13.
FIG. 13.
Normalized composite modulus versus the coefficient of variance of the distribution function of inclusion moduli, at constant mean of the same distribution function, for two filler volume fractions, f. Increasing the variability of filler moduli leads to overall composite softening.
FIG. 14.
FIG. 14.
Schematic representation of the hierarchical microstructure of bone. Reproduced with permission from Poundarik et al., Proc. Nat. Acad. Sci. U. S. A. 109, 19178 (2012). Copyright 2012 National Academy of Sciences.
FIG. 15.
FIG. 15.
Stochasticity of nucleation.
FIG. 16.
FIG. 16.
A cluster phase space indicating connections between clusters of various sizes. Horizontal axis is the Bi content, whereas vertical axis is the Se content. In this space, each cluster has its own coordinates. A cluster can grow by taking a smaller or equal sized cluster(s) at its lower/left part in the figure to become a larger one located on its upper/right part. Through such a process, some of the clusters in the lower/right quadrant will eventually grow large enough to enter one of the nucleation regimes shown in the other three quadrants.
FIG. 17.
FIG. 17.
Examples of frustrated systems: (a) and (b) Show spin configurations in antiferromagnetically interacting systems. (a) An optimal interaction is achievable on a square lattice but (b) is impossible in the frustrated system made up from a triangular system. It follows that the triangular arrangement displays a net magnetic moment. (c) and (d) Kekule representations of the smallest carbon sp2-based triangulate system. The geometry of the structure makes it impossible to associate each carbon atom with exactly one double bond. The unmatched atom corresponds to an unbounded π orbital electron, or free radical, represented by a dot. It follows that the structure is non-Kekulean and its ground state is a doublet spin state. This frustration is similar to the one observed on the spins located at the vertices of a equilateral triangle and results from the incompatibility between the molecule geometry and the requirements of 3 σ and one π bond per carbon atom.
FIG. 18.
FIG. 18.
Example of two polyhedral cells used to represent grains in an idealized material. The mean curvature of the cell faces is positive (left) and negative (right) under the constraint of a fixed external dihedral angle. Under normal grain growth conditions, these grains will shrink and grow respectively. For the assumed external dihedral angle, there is no constructible polyhedral cell having flat faces. The absence of constructible polyhedral cells with flat faces is an example of geometric frustration.
FIG. 19.
FIG. 19.
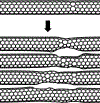
Example of structural evolution of a carbon nanotube subjected to electron irradiation. The system is initially stretched by 8% to facilitate the creation of structural modifications. The figure at the top shows the initial system where a single Stone-Thrower-Wales (STW) or “5775” defect was created to partially release elongation strain energy. The system was then evolved at high temperature in four different computational runs using different seeds for the pseudo-random number generator used to choose the dynamical defect nucleation sites. Shown here are four resulting final structures, where stochasticity clearly leads to significantly different structures.
FIG. 20.
FIG. 20.
Manufacturing process cycle for fabricating laminated hierarchical fiber-reinforced soft composite structures. (a) Outline of process cycle. (b) Cross section showing higher density of nanofiber mats. (c) Cross section showing lower density of nanofiber mats. Reproduced with permission from Spackman et al., ASME J. Micro Nano Manuf. 3, 011008 (2015). Copyright 2015 American Society of Mechanical Engineers.
FIG. 21.
FIG. 21.
3D printed laminated composite (a) after 2 h, (b) after 9 h, and (c) final part after 17.5 h. (d) Cross-section. Reproduced with permission from Spackman et al., ASME J. Micro Nano Manuf. 3, 011008 (2015). Copyright 2015 American Society of Mechanical Engineers.
FIG. 22.
FIG. 22.
Stochastic effects seen in droplet spreading. (a) Effect of fiber bundles in low-density mats seen in front-view. Here, the ratios (D/Do) and (H/Do) are indicated as a function of logarithmic timescale, where Do is the diameter of the droplet ejected by the inkjet nozzle, D is the diameter of the deposited droplet measured perpendicular to the direction of the alignment of the fibers, and H is the height of the droplet. The location of the droplet landing with respect to the fiber bundles is also shown. (b) Effect of voids in high-density mats seen in top-view. Here, the ratios (D///Do) and (D/Do) are indicated as a function of logarithmic timescale, where D// is the diameter of the deposited droplet measured along the direction parallel to the alignment of the fibers. Reproduced with permission from Addit. Manuf. 12A, 121 (2016). Copyright 2016 Elsevier.
FIG. 23.
FIG. 23.
Illustration of stochasticity space in alloy materials, demonstrating the ability to explore combinations of atomic-level compositional disorder and periodic modulations to tailor material properties.

References

    1. See, for example, Bentley JP, “The accuracy of measurement systems in the steady state,” in Principles of Measurement Systems (Longman Scientific, Singapore, 1995), Chap. 3.
    1. See, for example, Hoffman D and Ernst F, Ultramicroscopy 53, 205(1994).
    1. See, for example, Kalinin SV, Strelcov E, Belianinov A, Somnath S, Vasudevan RK, Lingerfelt EJ, Archibald RK, Chen C, Proksch R, Laanait N, and Jesse S, ACS Nano 10, 9068 (2016). - PubMed
    1. Murphy JM, Sexton DM, Barnett DN, Jones GS, Webb MJ, Collins M, and Stainforth DA, Nature 430, 768 (2004). - PubMed
    1. Anisworth M and Oden JT, A Posteriori Error Estimation in Finite Element Analysis (John Wiley, 2000).

LinkOut - more resources