. 2018 Oct;5(4):045002.
doi: 10.1117/1.NPh.5.4.045002. Epub 2018 Oct 23.

Multichannel optrodes for photonic stimulation

Affiliations

Multichannel optrodes for photonic stimulation

Yingyue Xu et al. Neurophotonics. 2018 Oct.

Abstract

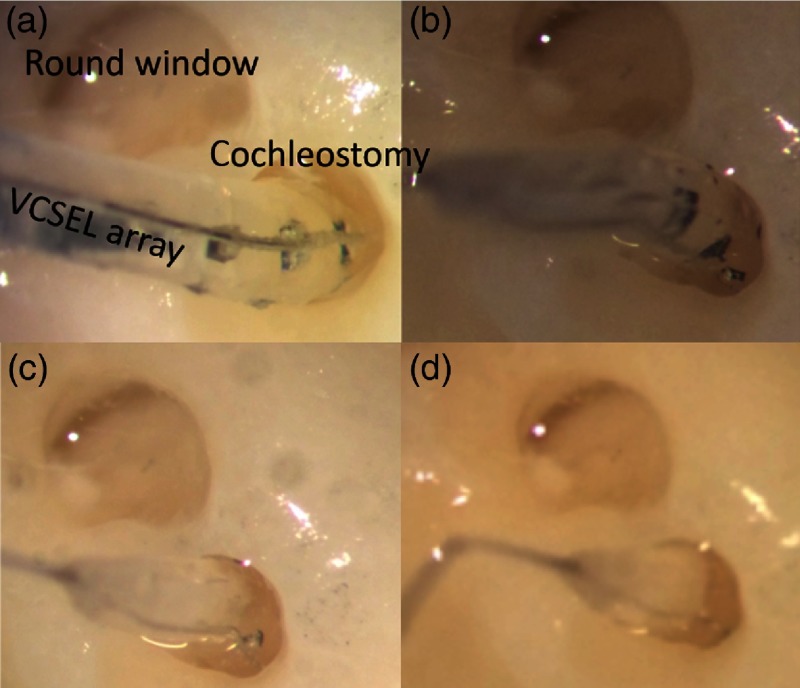
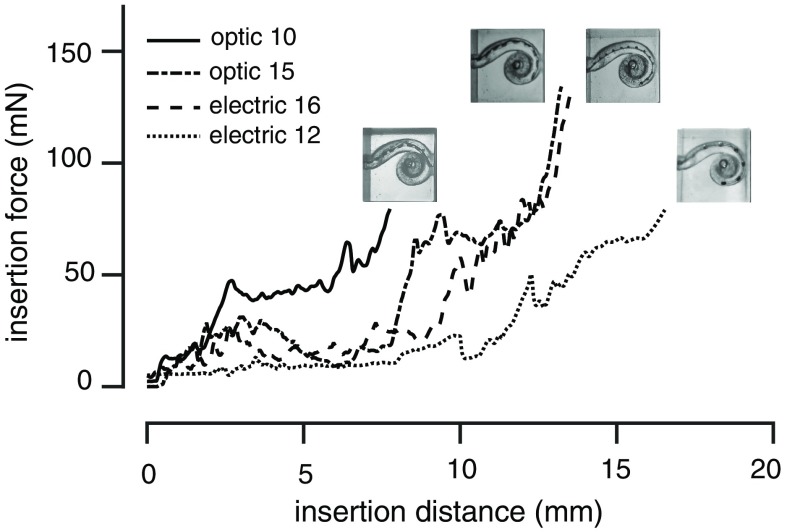
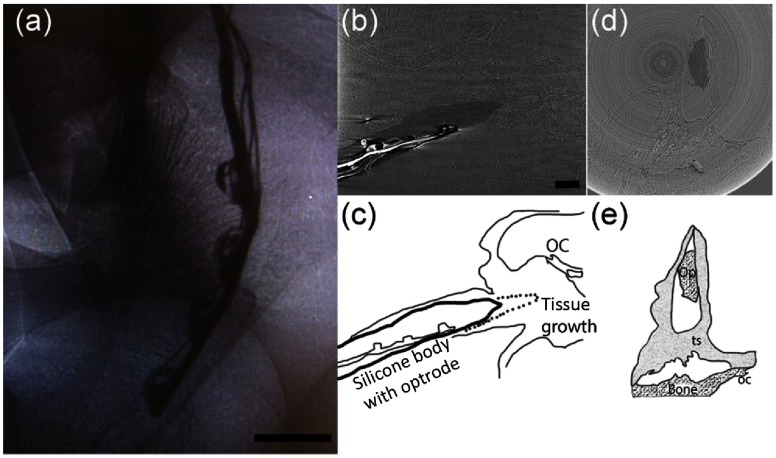
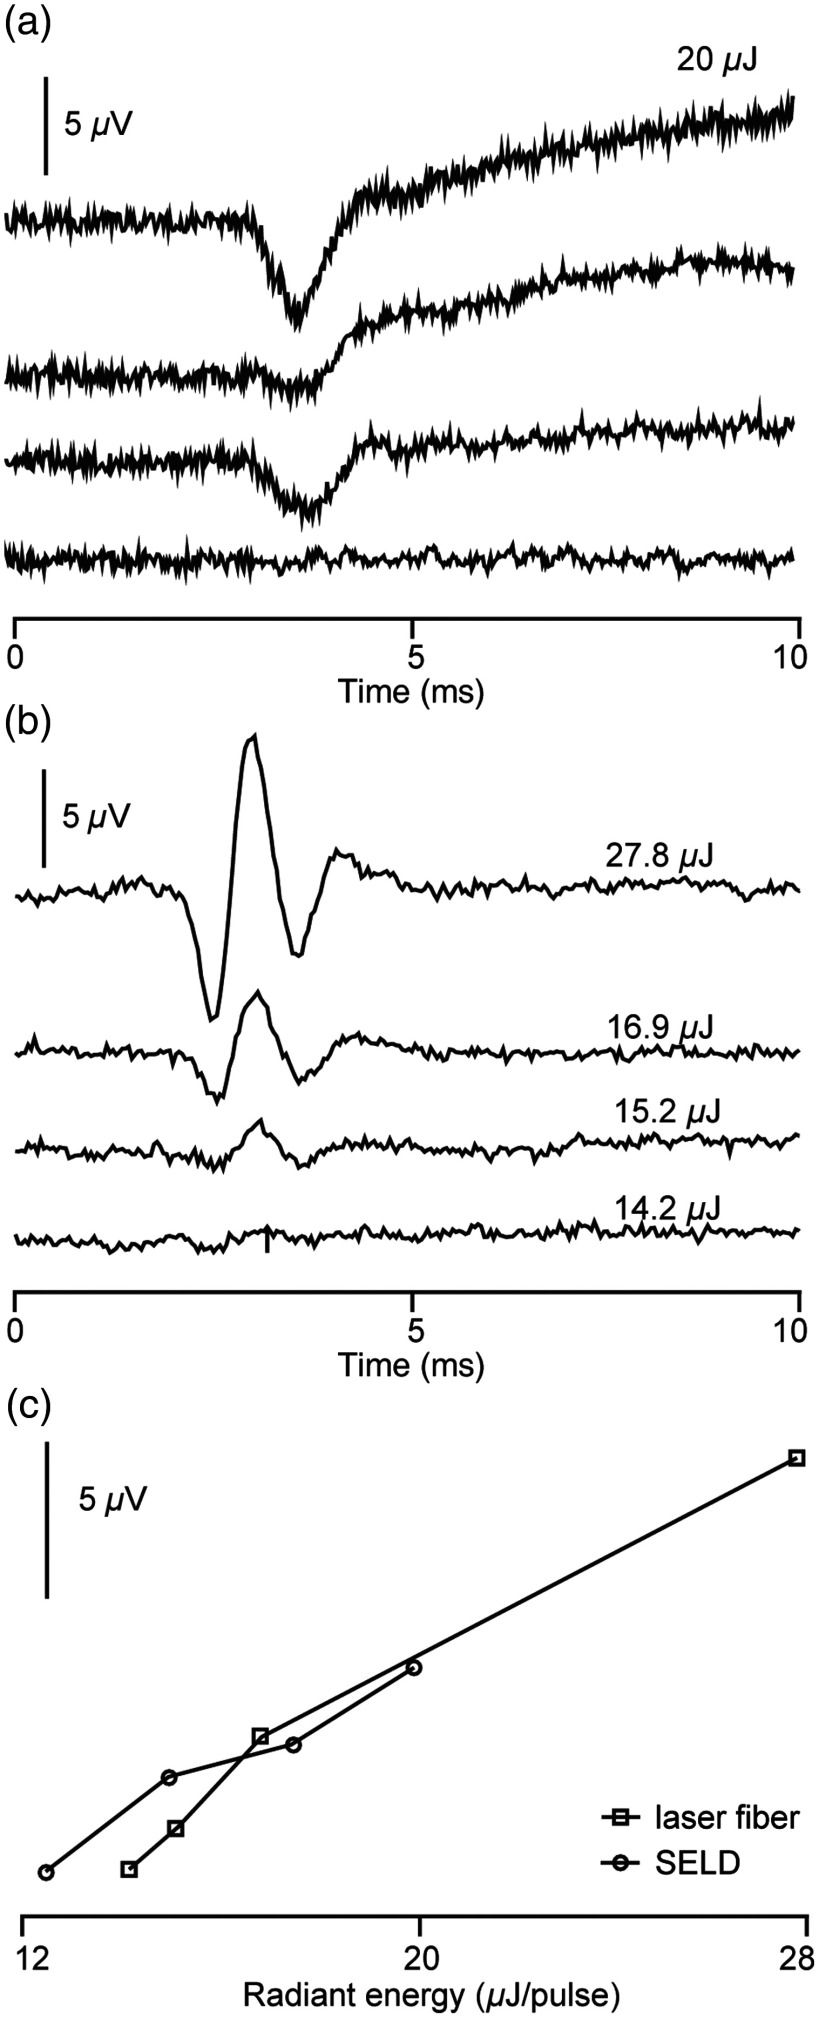
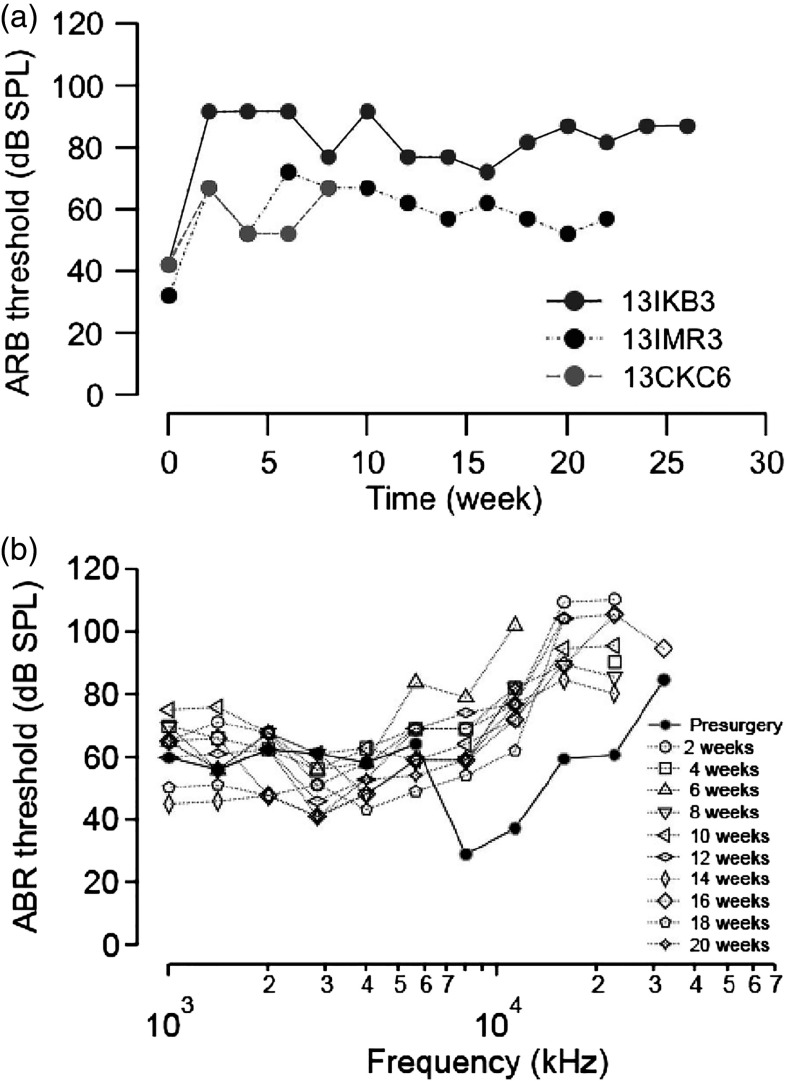
An emerging method in the field of neural stimulation is the use of photons to activate neurons. The possible advantage of optical stimulation over electrical is attributable to its spatially selective activation of small neuron populations, which is promising in generating superior spatial resolution in neural interfaces. Two principal methods are explored for cochlear prostheses: direct stimulation of nerves with infrared light and optogenetics. This paper discusses basic requirements for developing a light delivery system (LDS) for the cochlea and provides examples for building such devices. The proposed device relies on small optical sources, which are assembled in an array to be inserted into the cochlea. The mechanical properties, the biocompatibility, and the efficacy of optrodes have been tested in animal models. The force required to insert optrodes into a model of the human scala tympani was comparable to insertion forces obtained for contemporary cochlear implant electrodes. Side-emitting diodes are powerful enough to evoke auditory responses in guinea pigs. Chronic implantation of the LDS did not elevate auditory brainstem responses over 26 weeks.

Keywords: cochlear implant; infrared neural stimulation; laser; light delivery system; optrode.


Figures

Fig. 1
Fig. 1
Different light sources. (a) The top and (b) the reverse side of a VCSEL (λ=680  nm). The dimension is 250×250×200  μm3 and its maximum output power is about 4 mW. (c) and (d) The top and bottom of a 5×7 VCSEL array, (λ=1860  nm). The dimension is 450×250×200  μm3 and its maximum output power is about 7.5 mW. Each circle in (c) represents one VCSEL. (d) The light emitting window and the cathode, (e) and (f) a SELD (λ=1850  nm). The dimension is 450×350×100  μm3 and its maximum output power is about 50 mW. (g) The original appearance of a blue μLED (λ=470  nm) before being resized. The dimension is 1000×600×200  μm3 and its maximum output power is about 34 mW. Scale bars are the same for (a)–(f) [shown in (b)] and (g)–(h) [shown in (h)]: 100  μm. The power ratings are given for continuous wavemode operation.
Fig. 2
Fig. 2
Optrodes fabricated with small optical sources. (a) A three-channel optrode. The two infrared sources in (a) are VCSELs (λ=1860  nm, larger dies to the left). A red source (λ=680  nm, smaller die to the right) serves as a pilot light, which helps to orient the implant. (b) The completed electrode ready for implantation. At the bottom right, the transcutaneous connector is shown. (c) A picture of a two-channel optical array made of SELDs. The size of the given emitters is 450  μm×300  μm×100  μm. The anode of each emitter was connected with a thin gold wire, and then to a Teflon-insulated silver wire. The cathodes of both emitters were connected to a single silver wire, which also served as a heat sink for the light sources. The direction of the light emission is indicated by the arrow. (d) A picture of a silicone-embedded single-channel optical array made with a SELD. The anode and cathode connections are the same as shown in panel (c). The array is embedded in silicone. (e) An array of 15  μLEDs connected with a silver wire to the cathodes and platinum wires to the anodes. (f) An optrode made with 15 light sources. (g) The insertion of this optrode into a human scala tympani model. (g) and (i) The radiation of a single μLED and multiple μLEDs. Scale bars=900  μm.
Fig. 3
Fig. 3
The fabrication of the optrode based on FPCB technique. (a) The vertical fabrication structure and materials of the light source carrier and (b) the FPCB carrier and the tip. The light source mounting area on the tip is 100  μm×100  μm; the distance between two channels is 1 mm; the width of the carrier is 0.75 mm, and the thickness is 100  μm. (c) An FPCB-based optrode with a connector at the end and (d) the tip of an FPCB-based optrode with three VCSELs. (e) The tip of a FPCB-based optrode with three μLEDs. (f) The tip of a FPCB-based optrode with three infrared SELDs.
Fig. 4
Fig. 4
The implantation of the optrode into a cat cochlea. (a) The optrode was inserted into a cat cochlea through the cochleostomy, (b) the optrode was fixed to bulla with dental acrylic, (c) the second layer of dental acrylic, and (d) the transcutaneous connector was secured onto the lower neck skin.
Fig. 5
Fig. 5
The insertion of the sham optrode into a cadaveric cat cochlea. (a) The landmarks of the magnified view of the cochlea, the round window, the cochleostomy, and the optrode. (b)–(d) The progressive insertion of the optrode into the cochlea. In panel (d), the entire optrode is inserted into scala tympani. The length of insertion is about a 6 mm. Considering the spacing of the optical sources and insertion depth, the maximum number of VCSELs that can be inserted into the cat cochlear at this time is five.
Fig. 6
Fig. 6
The changes in force during insertion in a model of the human scala tympani at different depths of insertion for four arrays. The optrode has 10 (blue line) or 15 (turquoise line) μLEDs. The electrical alone arrays have 16 or 12 contacts. The placement of each array in the model is shown in the four corresponding inserts.
Fig. 7
Fig. 7
(a) An x-ray projection of an inserted optical array in situ in a cat cochlea. The thick wire is the backbone and acts as a heat sink. The thin wires connect to the anodes of the optical sources. The scale bar represents 500  μm. (b) and (c) The same array after the reconstruction and its sketch. The optical sources irradiate Rosenthal’s canal. A thin layer of tissue can be seen around the electrode, which has been slightly retracted (dash line in the sketch). The organ of Corti (OC) is also marked. The scale bar represents 500  μm and is used for the following panels. (d) and (e) The cross section of the same array after the reconstruction and its sketch. The optrode (Op), tissue, bone, and OC are marked in the sketch.
Fig. 8
Fig. 8
The traces show CAPs evoked with an SELD and an optical fiber in the same animal (guinea pig). (a) CAP responses evoked by a SELD operated at different current levels. The energy output measured prior to the in vivo test was 20  μJ/pulse with 600-mA current input. The four traces represent the current input of 600, 500, 400, and 300 mA. The traces are the averaged responses to 20 stimulus presentations. (b) CAPs evoked by delivering the radiant energy with an optical fiber at different energy levels. The traces are the averaged responses to 100 stimulus presentations. (c) The CAP amplitudes at different radiant energies for both the SELD and the optical fiber.
Fig. 9
Fig. 9
The ABR thresholds to acoustic stimuli pre- and postimplantation. (a) Click evoked ABR thresholds at different time points in three cats. Click thresholds were elevated after optrode implantation, but then remained consistent in the months after; (b) pure tone evoked ABR thresholds at different times after implantation for animal 13IMR3. The optrode implantation caused high-frequency hearing loss (at 32 kHz) and elevated thresholds among 8 to 22.6 kHz, but little change was noted below 8 kHz.

References

    1. Wilson B. S., Dorman M. F., “Cochlear implants: current designs and future possibilities,” J. Rehabil. Res. Dev. 45(5), 695–730 (2008).10.1682/JRRD.0000.00.0000 - DOI - PubMed
    1. Webb K., et al. , “Tough choices: the challenges of cochlear implantation when there is ‘something to lose’,” Cochlear Implants Int. 16(Suppl. 1), S50–S52 (2015).10.1179/1467010014Z.000000000236 - DOI - PubMed
    1. Wilson B. S., “Getting a decent (but sparse) signal to the brain for users of cochlear implants,” Hear. Res. 322, 24–38 (2015).10.1016/j.heares.2014.11.009 - DOI - PubMed
    1. Bierer J. A., Middlebrooks J. C., “Auditory cortical images of cochlear-implant stimuli: dependence on electrode configuration,” J. Neurophysiol. 87, 478–492 (2002).JONEA410.1152/jn.00212.2001 - DOI - PubMed
    1. Snyder R. L., Bierer J. A., Middlebrooks J. C., “Topographic spread of inferior colliculus activation in response to acoustic and intracochlear electric stimulation,” J. Assoc. Res. Otolaryngol. 5, 305–322 (2004).10.1007/s10162-004-4026-5 - DOI - PMC - PubMed