. 2018 Oct 24;4(10):eaau4130.
doi: 10.1126/sciadv.aau4130. eCollection 2018 Oct.

Structure and dynamics conspire in the evolution of affinity between intrinsically disordered proteins

Affiliations

Structure and dynamics conspire in the evolution of affinity between intrinsically disordered proteins

Per Jemth et al. Sci Adv. .

Abstract

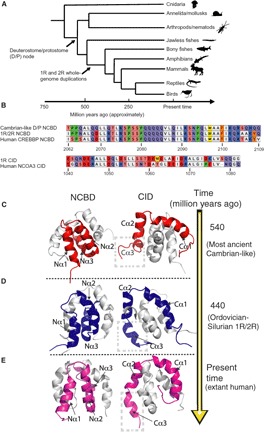
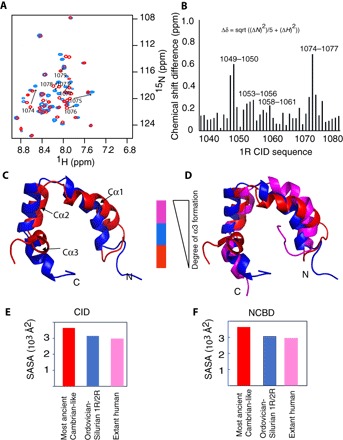
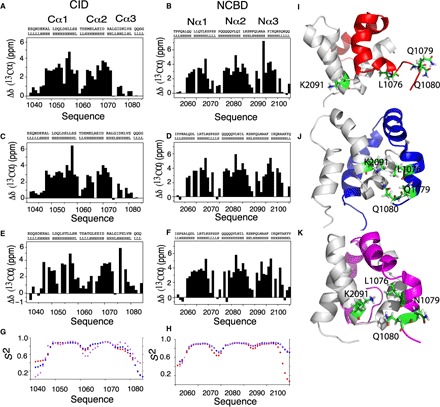
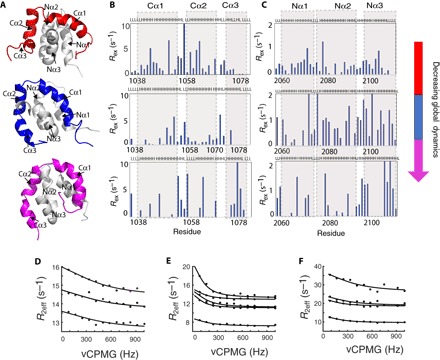
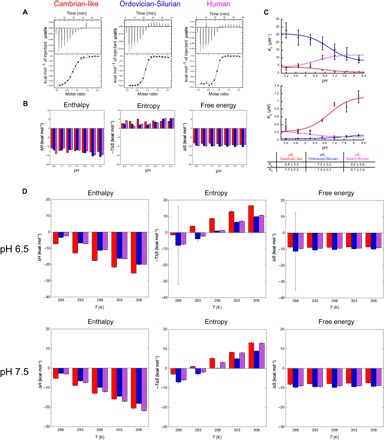
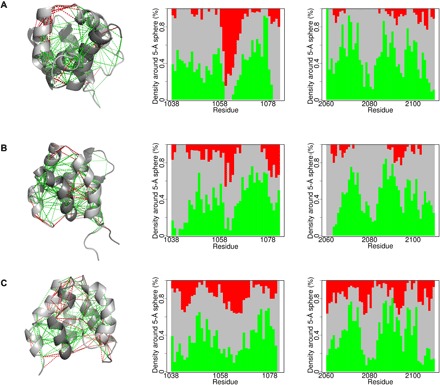
In every established species, protein-protein interactions have evolved such that they are fit for purpose. However, the molecular details of the evolution of new protein-protein interactions are poorly understood. We have used nuclear magnetic resonance spectroscopy to investigate the changes in structure and dynamics during the evolution of a protein-protein interaction involving the intrinsically disordered CREBBP (CREB-binding protein) interaction domain (CID) and nuclear coactivator binding domain (NCBD) from the transcriptional coregulators NCOA (nuclear receptor coactivator) and CREBBP/p300, respectively. The most ancient low-affinity "Cambrian-like" [540 to 600 million years (Ma) ago] CID/NCBD complex contained less secondary structure and was more dynamic than the complexes from an evolutionarily younger "Ordovician-Silurian" fish ancestor (ca. 440 Ma ago) and extant human. The most ancient Cambrian-like CID/NCBD complex lacked one helix and several interdomain interactions, resulting in a larger solvent-accessible surface area. Furthermore, the most ancient complex had a high degree of millisecond-to-microsecond dynamics distributed along the entire sequences of both CID and NCBD. These motions were reduced in the Ordovician-Silurian CID/NCBD complex and further redistributed in the extant human CID/NCBD complex. Isothermal calorimetry experiments show that complex formation is enthalpically favorable and that affinity is modulated by a largely unfavorable entropic contribution to binding. Our data demonstrate how changes in structure and motion conspire to shape affinity during the evolution of a protein-protein complex and provide direct evidence for the role of structural, dynamic, and frustrational plasticity in the evolution of interactions between intrinsically disordered proteins.


Figures

Fig. 1
Fig. 1. Reconstructed ancestral sequences, phylogenetic tree ancestral, and extant CID/NCBD complexes.
(A) The sequences were previously reconstructed (6) using 181 (NCBD) and 184 (CID) protein sequences from present-day protostome and deuterostome species of the animal phyla, superclasses, and classes depicted in the simplified phylogenetic tree. (B) The complexes used in this study are (i) 1R CID with D/P NCBD (most ancient Cambrian-like complex), (ii) 1R CID with 1R/2R NCBD (the Ordovician-Silurian 1R/2R complex), and (iii) extant human CID/NCBD complex (from NCOA3 and CREBBP, respectively). Note that the timing of the whole-genome duplications 1R and 2R is not resolved and might predate the divergence of jawed and jawless vertebrates (25). Animals were downloaded from phylopic.org. (C) The most ancient Cambrian-like complex (red) contains D/P NCBD and 1R CID. (D) The Ordovician-Silurian 1R/2R complex (blue) contains 1R/2R NCBD and 1R CID. (E) The extant human complex (magenta) contains human CREBBP NCBD and NCOA3 CID. In the three left panels, the solved structures of NCBD domains are displayed in cartoon representation and colored, while the CID domains are cartoon and gray. In the three right panels, the solved structures of CID domains are displayed as colored cartoons, and the NCBD domains are gray cartoons. The complexes in the left and right panels are rotated 180° with respect to each other.
Fig. 2
Fig. 2. Evolutionary snapshots highlighting structural heterogeneity.
(A) Overlay of the heteronuclear single-quantum correlation spectra for 1R CID bound to Cambrian-like NCBD (red) and Ordovician-Silurian NCBD (blue). Arrows indicate the peak shifts of the amino acid residues 1073 to 1079 corresponding to the CID Cα3 helix (for clarity, only the assignments of residues 1073 to 1079 are shown; complete assignments can be found in fig. S7). In the most ancient low-affinity complex with Cambrian-like NCBD, these residues remain unstructured. However, in the younger high-affinity Ordovician-Silurian 1R/2R complex, the increased number of interactions in the region leads to increased α-helical content of Cα3 (see Fig. 4). The increase in dispersion for residues 1074 to 1077 is accompanied by an increase in the number of inter- and intramolecular NOEs (i, i + 3, indicative of helices; figs. S3 and S4), indicating that this region becomes more structured. ppm, parts per million. (B) Root mean square deviations (RMSDs) between the combined HN/N chemical shifts for the complexes of 1R CID with Cambrian-like D/P NCBD and Ordovician-Silurian 1R/2R NCBD, respectively. Large structural changes are seen for residues Leu1049 and Asp1050 located in Cα1 and for residues Asp1074, Lys1075, Leu1076, and Val1077 in Cα3. sqrt, square root. (C) Superposition of structures of 1R CID bound to Cambrian-like NCBD (red) and Ordovician-Silurian NCBD (blue), respectively. (D) 1R CID bound to Cambrian-like NCBD (red) and Ordovician-Silurian NCBD (blue), and human NCOA3 CID bound to CREBBP NCBD (magenta). For clarity, only the CID domains are displayed in (C) and (D). (E and F) Plots of total SASA calculated from the respective complex and plotted separately for each domain, CID (E) and NCBD (F).
Fig. 3
Fig. 3. Evolution of Cα3 and Nα3 helical content and conformational rearrangements within the Cα3 helix of CID domains during evolution.
Plots of the difference of experimental Cα shifts from those of random coil values as a function of the amino acid sequences and TALOS prediction for ancestral and extant CID domains (A, C, and E) and NCBD domains (B, D, and F). The height of the bars indicates the degree of α helix formed with zero, indicating no α-helical content. There is a general increase in helical content for Cα3 and Nα3 as we evolve from Cambrian-like and Ordovician-Silurian (1R/2R) complexes to the present-day human CID/NCBD complex. (G and H) Chemical shift–based S2 values show that the flexibility in the Cα3 and Nα3 helices is higher in the most ancient low-affinity Cambrian-like complex (red) than in the younger high-affinity Ordovician-Silurian 1R/2R (blue) and present-day human (magenta) complexes. Specific interactions and rearrangements of K2091 of Nα2 and L1076, Q1079, and Q1080 of Cα3 (side chains are numbered and colored green) for (I) Cambrian-like D/P NCBD (gray) with 1R CID (red), (J) Ordovician-Silurian 1R/2R NCBD bound to 1R CID (blue), and (K) the extant human complex between CREBBP NCBD and NCOA3 CID (magenta). The three highlighted Cα3 residues are mainly solvent exposed in the most ancient Cambrian-like complex, while specific interactions are seen in both the Ordovician-Silurian 1R/2R and the extant human complex. For clarity, the structures have been slightly reoriented in relation to each other to show the specific interactions.
Fig. 4
Fig. 4. Redistribution of slow motions and flexibility during the evolution of the CID/NCBD complex.
Plots of Rex from relaxation dispersion experiments as a function of position along the amino acid sequences for ancestral and extant CID domains (B) and NCBD domains (C). The CPMG probe (83 to 1000 Hz) used for these experiments detects conformational exchange occurring on the microsecond-to-millisecond time scale, and nonzero Rex values therefore indicate the presence of motions in this time regime. Notably, all three complexes show a distinct distribution. (A) Cartoon representation of the respective complex of CID/NCBD domains displayed in a similar orientation. R2eff determined as a function of different CPMG frequencies were fitted globally to Eq. 1 (see Methods), describing a two-site exchange process for selected residues. kex values of 3260 ± 1850 s−1, 1800 ± 245 s−1, and 2300 ± 1000 s−1 were obtained for (D) the most ancient Cambrian-like complex, (E) Ordovician-Silurian 1R/2R complex, and (F) the extant human CID/NCBD complex, respectively.
Fig. 5
Fig. 5. The pH and temperature dependence of interactions for ancestral and extant NCBD/CID.
(A) Examples of ITC experiments conducted at pH 7.7 and 25°C for the three different complexes. (B) Contribution from enthalpy (ΔH, left) and entropy (−TΔS, middle) to the total free energy (ΔG, right) at different pH values for formation of Cambrian-like (red), Ordovician-Silurian (blue), and extant human (magenta) CID/NCBD complexes, respectively. (C) The association (KA, top) and dissociation (KD, bottom) equilibrium constants plotted against pH and fitted to a two-state equation (Eq. 4 in Methods), which yielded the apparent pKa values listed in the table. Because of the large noise in the original data for the extant human complex at pH 5.2, these points were not included in the curve fitting but are shown in the figure. (D) Bar diagrams showing the contribution of enthalpy (ΔH, left) and entropy (−TΔS, middle) to the free energy (ΔG, right) for formation of the respective CID/NCBD complex at different temperatures and at two different pH values (6.5 and 7.5, respectively). To determine ΔCp, the ΔH values were plotted against temperature and analyzed according to Eq. 2 (fig. S5).
Fig. 6
Fig. 6. Evolution of frustration in the CID/NCBD complex.
The local frustration patterns were calculated for each complex using the electrostatics mode of the Frustratometer (22). Left: CID/NCBD backbones are displayed as gray ribbons (darkest gray is NCBD), direct contacts with solid lines, and water-mediated interactions with dashed lines. Minimally frustrated interactions (green) and highly frustrated contacts (red) are shown. Middle and right: The proportion of contacts within 5 Å of the Cα atom of each residue is plotted and classified according to their frustration index. (A) The Cambrian-like complex contains 1R CID (middle) and D/P NCBD (right). (B) The Ordovician-Silurian complex contains 1R CID (middle) and 1R/2R NCBD (right). (C) The extant human complex contains NCOA3 CID (middle) and CREBBP NCBD (right).

Similar articles

Cited by

References

    1. Leo C., Chen J. D., The SRC family of nuclear receptor coactivators. Gene 245, 1–11 (2000). - PubMed
    1. Harms M. J., Thornton J. W., Evolutionary biochemistry: Revealing the historical and physical causes of protein properties. Nat. Rev. Genet. 14, 559–571 (2013). - PMC - PubMed
    1. McKeown A. N., Bridgham J. T., Anderson D. W., Murphy M. N., Ortlund E. A., Thornton J. W., Evolution of DNA specificity in a transcription factor family produced a new gene regulatory module. Cell 159, 58–68 (2014). - PMC - PubMed
    1. Lim S. A., Hart K. M., Harms M. J., Marqusee S., Evolutionary trend toward kinetic stability in the folding trajectory of RNases H. Proc. Natl. Acad. Sci. U.S.A. 113, 13045–13050 (2016). - PMC - PubMed
    1. Nguyen V., Wilson C., Hoemberger M., Stiller J. B., Agafonov R. V., Kutter S., English J., Theobald D. L., Kern D., Evolutionary drivers of thermoadaptation in enzyme catalysis. Science 355, 289–294 (2017). - PMC - PubMed

Publication types

Substances

LinkOut - more resources