. 2018;13(10-11):1088-1105.
doi: 10.1080/15592294.2018.1543504. Epub 2018 Nov 22.

The proto CpG island methylator phenotype of sessile serrated adenomas/polyps

Affiliations

The proto CpG island methylator phenotype of sessile serrated adenomas/polyps

Hannah R Parker et al. Epigenetics. 2018.

Abstract

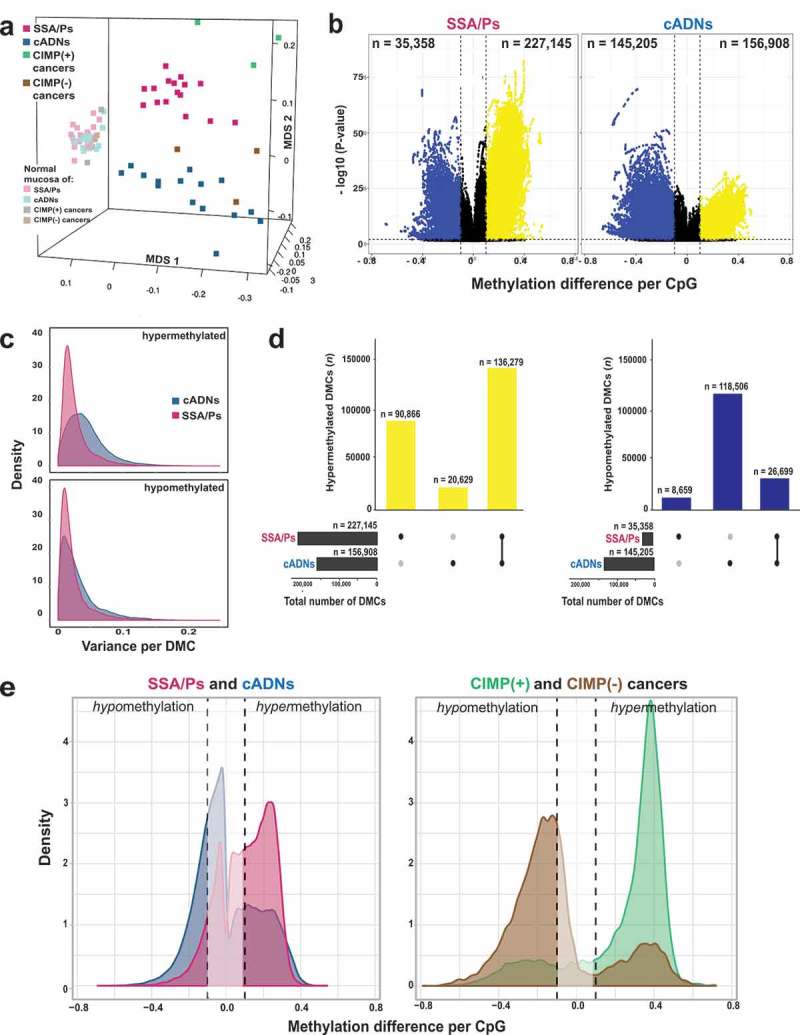
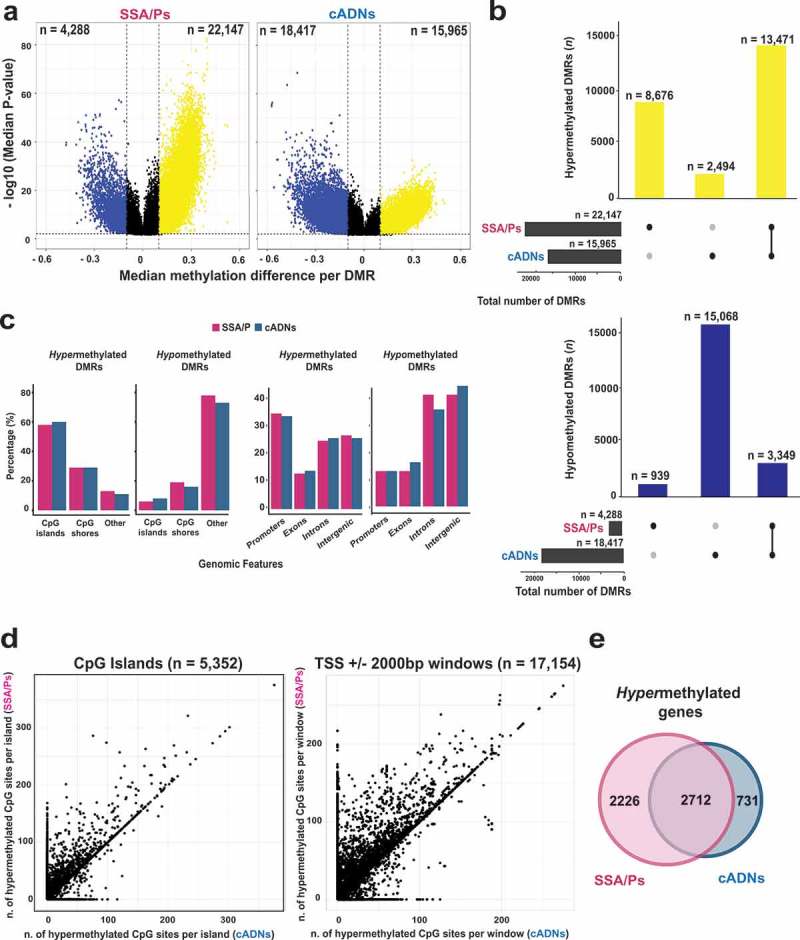
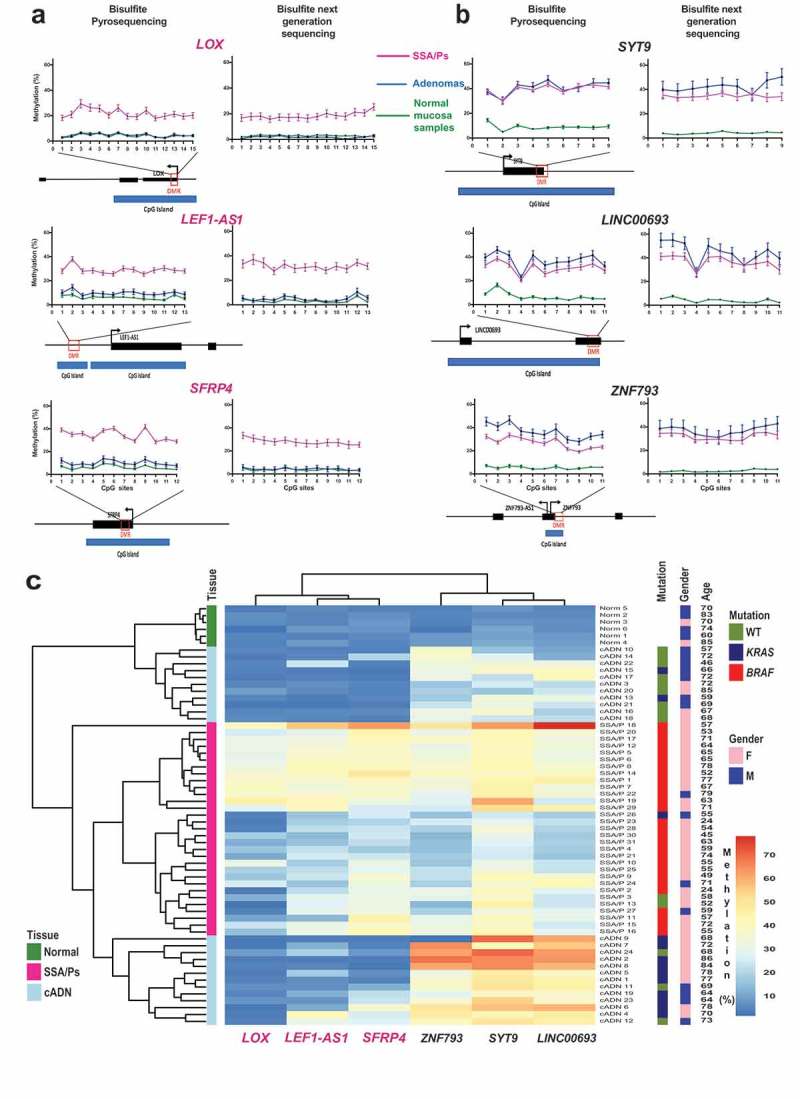
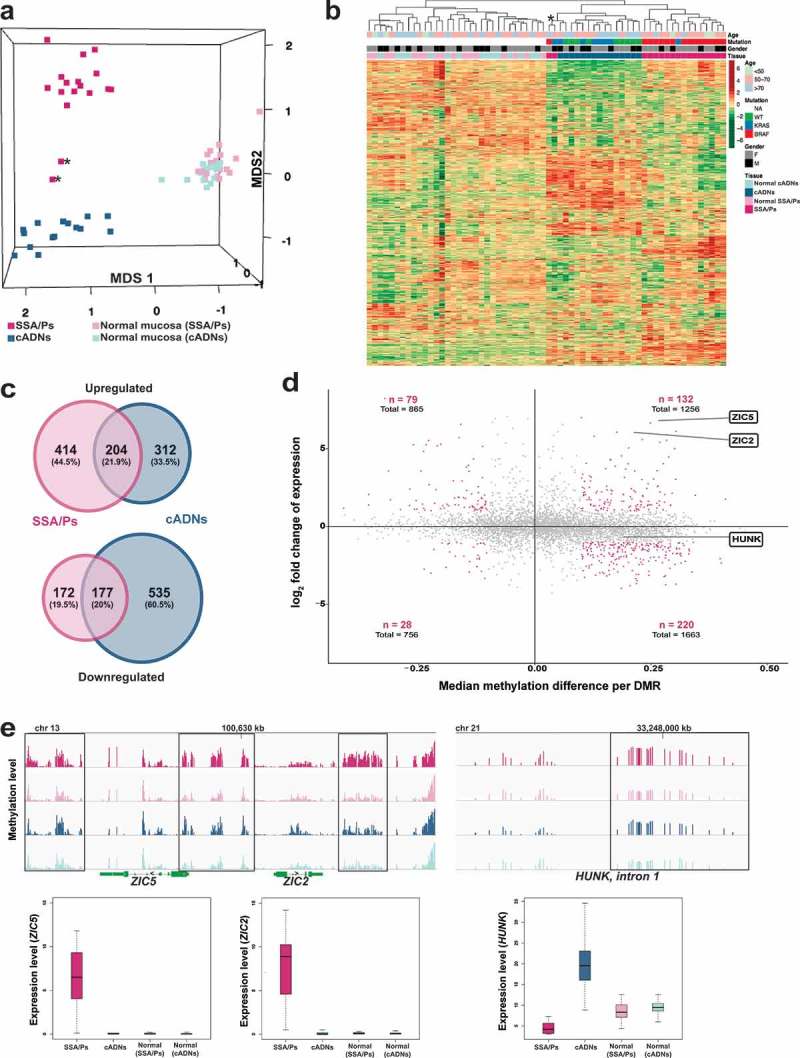
Sessile serrated adenomas/polyps (SSA/Ps) are the putative precursors of the ~20% of colon cancers with the CpG island methylator phenotype (CIMP). To investigate the epigenetic phenotype of these precancers, we prospectively collected fresh-tissue samples of 17 SSA/Ps and 15 conventional adenomas (cADNs), each with a matched sample of normal mucosa. Their DNA was subjected to bisulfite next-generation sequencing to assess methylation levels at ~2.7 million CpGs located predominantly in gene regulatory regions and spanning 80.5Mb; RNA was sequenced to define the samples' transcriptomes. Compared with normal mucosa, SSA/Ps and cADNs exhibited markedly remodeled methylomes. In cADNs, hypomethylated regions were far more numerous (18,417 vs 4288 in SSA/Ps) and rarely affected CpG islands/shores. SSA/Ps seemed to have escaped this wave of demethylation. Cytosine hypermethylation in SSA/Ps was more pervasive (hypermethylated regions: 22,147 vs 15,965 in cADNs; hypermethylated genes: 4938 vs 3443 in cADNs) and more extensive (region for region), and it occurred mainly within CpG islands and shores. Given its resemblance to the CIMP typical of SSA/Ps' putative descendant colon cancers, we refer to the SSA/P methylation phenotype as proto-CIMP. Verification studies of six hypermethylated regions in an independent series of precancers demonstrated DNA methylation markers' high potential for predicting the diagnosis of SSA/Ps and cADNs. Surprisingly, proto-CIMP in SSA/Ps was associated with upregulated gene expression; downregulation was more common in cADNs. In conclusion, the epigenetic landscape of SSA/Ps differs markedly from that of cADNs. These differences are a potentially rich source of novel tissue-based and noninvasive biomarkers.

Keywords: DNA methylation; Sessile serrated adenoma/polyp; adenomatous polyp; colon cancer.


Figures

Figure 1.
Figure 1.
Differentially methylated cytosines (DMCs) in precancerous and cancerous colon lesions. a. MDS plot (Supplementary Experimental Procedures) of DNA methylation levels in SSA/Ps (n = 16); cADNs (n = 15); CIMP(+) cancers (n = 3); CIMP(-) cancers (n = 3); and matched samples of normal mucosa for each lesion. b. Volcano plots showing the magnitude (x axis) and statistical significance (y axis) of the differential methylation observed at DMCs identified in SSA/Ps and cADNs. X-axis: The magnitude of differential methylation was calculated as the M:T ratio (no. methylated reads/total no. reads) for the tumor sample minus M:T ratio for matched normal-tissue control. Black dots: DMCs with absolute methylation differences of <0.1 and P-values > 0.01. Yellow and blue dots: highly significant (P-value < 0.01) DMCs (hypermethylated and hypomethylated, respectively). c. Density plot showing variance at the hypermethylated (top) and hypomethylated (bottom) DMCs (yellow and blue dots of panel B, respectively). d. UpSet plots showing hypermethylated (left) and hypomethylated (right) DMC sets in SSA/Ps and cADNs and their overlaps. Exact numbers of lesion-specific (•) and shared (•-•) DMCs appear above the bars. e. Overlaid density plots showing the distributions of hypo- and hypermethylated DMCs in SSA/Ps and cADNs (left), and CIMP(+) and CIMP(-) cancers (right). X-axis as described in panel B.
Figure 2.
Figure 2.
Differentially methylated regions (DMRs) in precursor lesions and proto-CIMP in SSA/Ps. a. Volcano plots showing the median differential methylation (x-axis) and its statistical significance (y-axis) for DMRs found in SSA/Ps and cADNs. (See Figure 1B legend for cutoffs and color codes) b. UpSet plots showing the lesion-specificity of hypermethylated and hypomethylated DMRs found in precancerous tumors. Exact numbers of lesion-specific (•) and shared (•-•) DMRs appear above the bars. c. Genomic location of DMRs in SSA/Ps vs cADNs. d. Scatterplots showing the extent of methylation at regions hypermethylated in both SSA/Ps and cADNs, and located within CpG islands (dots in the left panel) or 4-kb peri-TSS windows, i.e., TSS plus 2000-bp upstream and downstream flanking regions (dots in the right panel). In addition, CpG islands or peri-TSS windows with at least one hypermethylated CpG in either SSA/Ps or cADNs are included in the two graphics (i.e., dots along the y or x axis, respectively). e. Venn diagrams showing overlap between sets of genes in SSA/Ps and cADNs whose peri-TSS window contained at least one hypermethylated DMR.
Figure 3.
Figure 3.
Bisulfite pyrosequencing verification of 6 hypermethylated DMRs. Methylation levels at each CpG site of (a) 3 SSA/P-specific DMRs and (b) 3 DMRs shared between SSA/Ps and cADNs. Verification assay results in 61 FFPE colon tissue samples (left) are compared with those of genome-wide bisulfite sequencing of the fresh tissue series (right). DMR-containing loci (red box) and CpG islands (blue horizontal bars) are schematically represented below graph pairs. c. Hierarchical clustering heatmap of the 61 FFPE tissue samples based on the mean methylation level across all CpGs in each DMR. The cADN cluster contains two subgroups, probably reflecting their different frequencies of KRAS mutations. The SSA/P cluster also contains a subgroup of lesions with higher levels of methylation at all 6 markers, presumably reflecting these patients’ significantly older age when the lesions were discovered (mean: 66.3 years versus 54.5 years in the subgroup with lower methylation levels; P = 0.01). Significant differences between subgroups regarding other clinical variables (Supplementary Table 3) were not observed.
Figure 4.
Figure 4.
Analysis of the SSA/P and cADN transcriptomes in light of the lesions’ methylome profiles. (a) MDS plot and (b) hierarchical clustering heatmap of the 17 SSA/Ps and 15 cADNs and their normal mucosal samples. Asterisks indicate the two samples with intermediate profiles (for details, see Table 1). Hierarchical clustering in B was based on expression levels of the 10,000 genes with most highly variable expression. c. Venn diagrams showing the precursor-lesion specificity of the most dysregulated genes (P-value < 10−10 and log2 fold change > 1). d. Scatter plots showing the variable relation between the magnitude of differential DNA methylation (x axis) and the expression (y axis) for SSA/Ps (vs matched normal mucosa samples). Genes with at least one DMR (P-value < 0.05) in their peri-TSS windows and dysregulated expression (P-value < 0.05) are shown. Red dots: subsets of genes with a median methylation difference of ≥ 0.1 and log2 fold change in expression of >1. ZIC2, ZIC5, and HUNK are highlighted to illustrate the heterogeneous relation between DNA methylation and gene expression. e. Methylation levels (top) and gene expression (bottom) data for the ZIC2, ZIC5, and HUNK loci in SSA/Ps (pink), cADNs (blue), and corresponding samples of normal mucosa (light-pink and light blue, respectively). Areas outlined in black are those displaying differential methylation (see details in Supplementary Figures 5 and 6).
Figure 5.
Figure 5.
In situ hybridization analysis of ZIC2, HUNK, and ANXA10 mRNAs in SSA/Ps and cADNs. ZIC2 expression (red punctate labeling) is (a) present in SSA/Ps and (b) absent in cADNs. HUNK (brown punctate labeling) is (c) almost absent in SSA/Ps (very low-level expression was present at the bottom of serrated crypts, see inset) and (d) expressed in cADNs. Control staining for ANXA10, a known SSA/P-specific marker[25,73–75] was (e) strongly positive in SSA/Ps (dense red punctate labeling) and (f) absent in cADNs.

References

    1. Jass JR. Serrated adenoma of the colorectum and the DNA-methylator phenotype. Nat Clin Pract Oncol. 2005. August;2(8):398–405. PubMed PMID: 16130936. - PubMed
    1. Phipps AI, Limburg PJ, Baron JA, et al. Association between molecular subtypes of colorectal cancer and patient survival. Gastroenterology. 2015. January;148(1):77–87 e2. . PubMed PMID: 25280443; PubMed Central PMCID: PMCPMC4274235. - PMC - PubMed
    1. Hinoue T, Weisenberger DJ, Lange CP, et al. Genome-scale analysis of aberrant DNA methylation in colorectal cancer. Genome Res. 2012. February;22(2):271–282. . PubMed PMID: 21659424; PubMed Central PMCID: PMCPMC3266034. - PMC - PubMed
    1. Okugawa Y, Grady WM, Goel A. Epigenetic alterations in colorectal cancer: emerging biomarkers. Gastroenterology. 2015. October;149(5):1204–1225 e12. . PubMed PMID: 26216839; PubMed Central PMCID: PMCPMC4589488. - PMC - PubMed
    1. Ijspeert JEG, Vermeulen L, Meijer GA, et al. Serrated neoplasia-role in colorectal carcinogenesis and clinical implications. Nat Rev Gastroenterol Hepatol. 2015. July;12(7):401–409. . PubMed PMID: 25963511. - PubMed

Publication types