. 2019 Feb;290(2):456-464.
doi: 10.1148/radiol.2018180958. Epub 2018 Nov 6.

A Deep Learning Model to Predict a Diagnosis of Alzheimer Disease by Using 18F-FDG PET of the Brain

Affiliations

A Deep Learning Model to Predict a Diagnosis of Alzheimer Disease by Using 18F-FDG PET of the Brain

Yiming Ding et al. Radiology. 2019 Feb.

Abstract

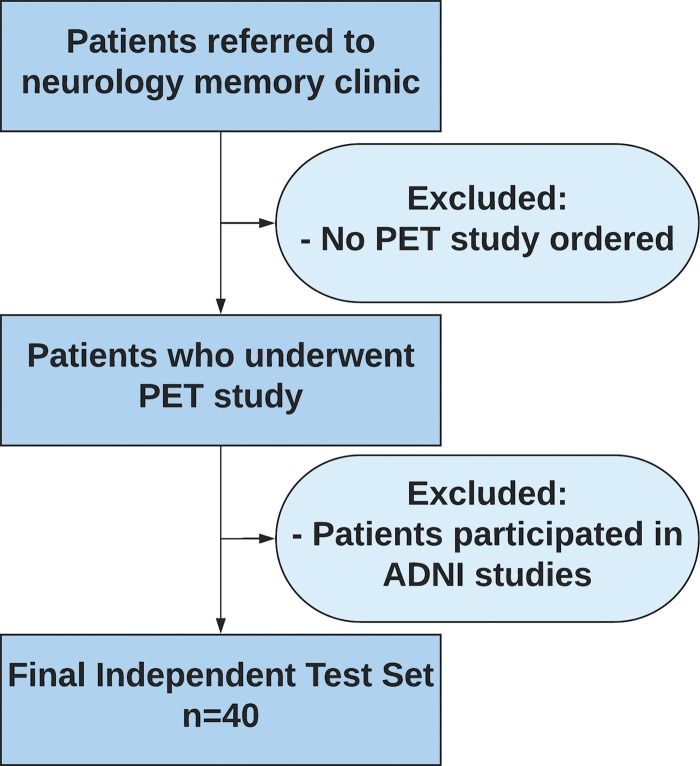
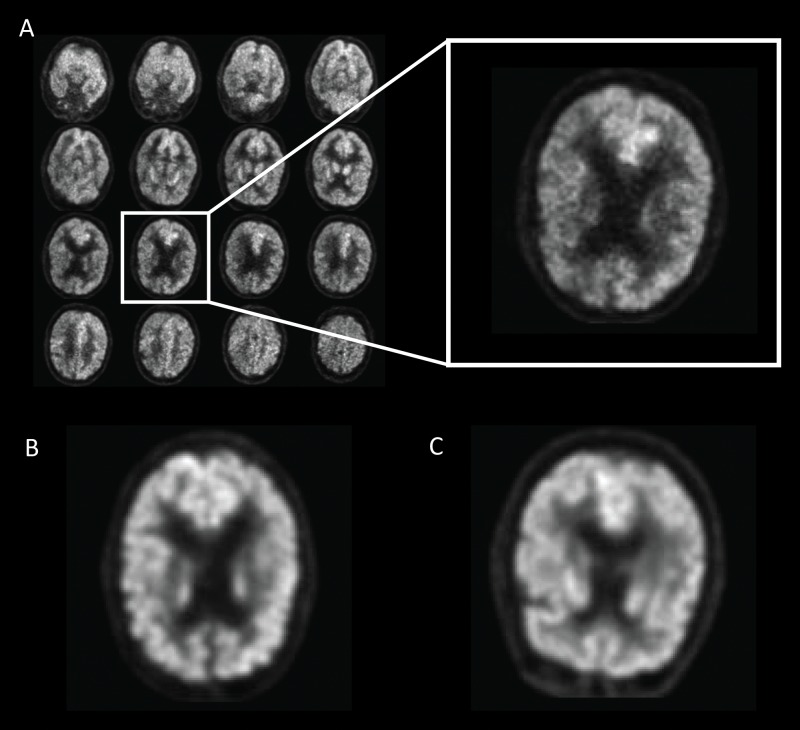
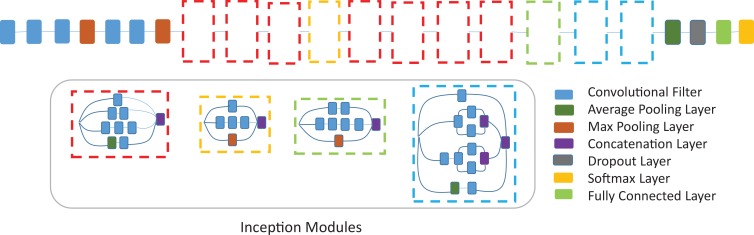
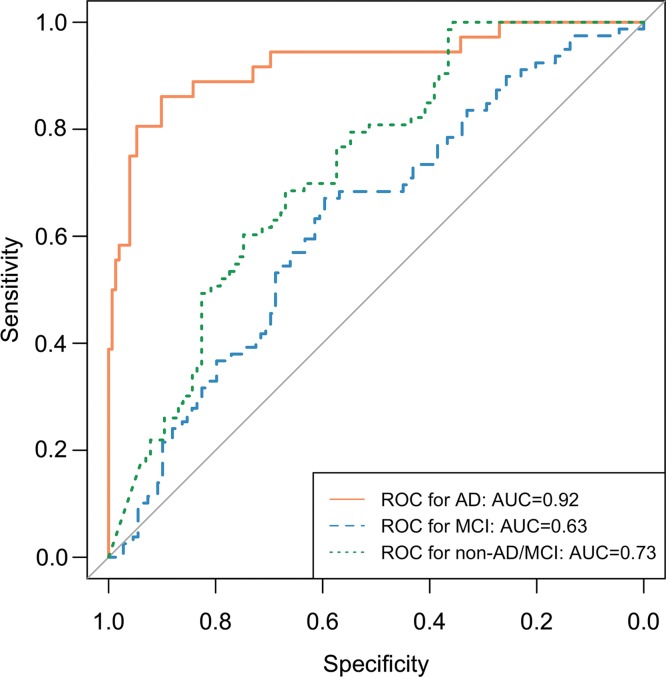
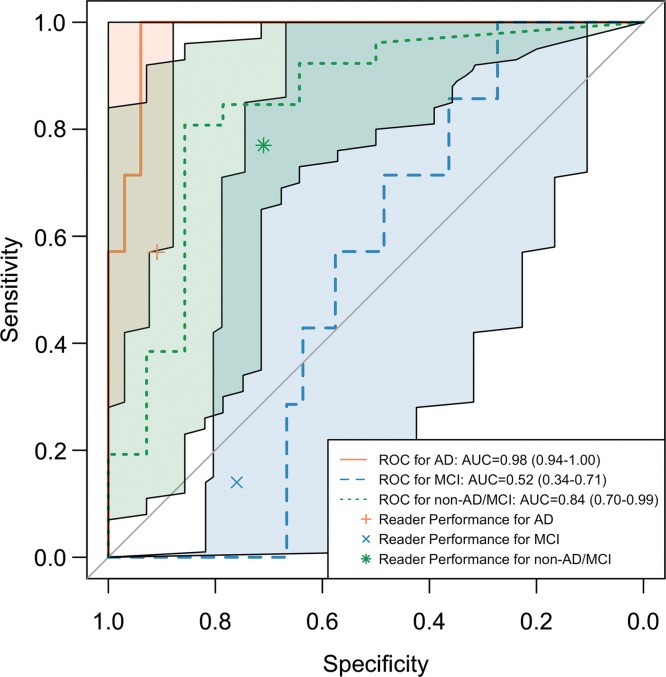
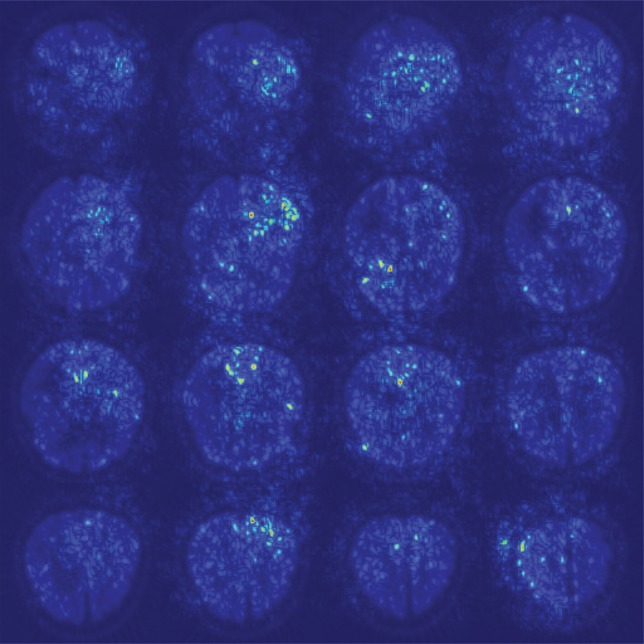
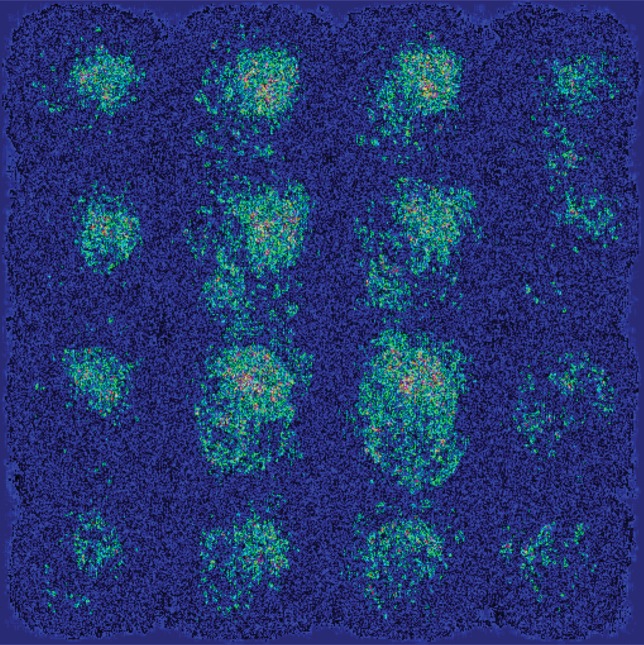
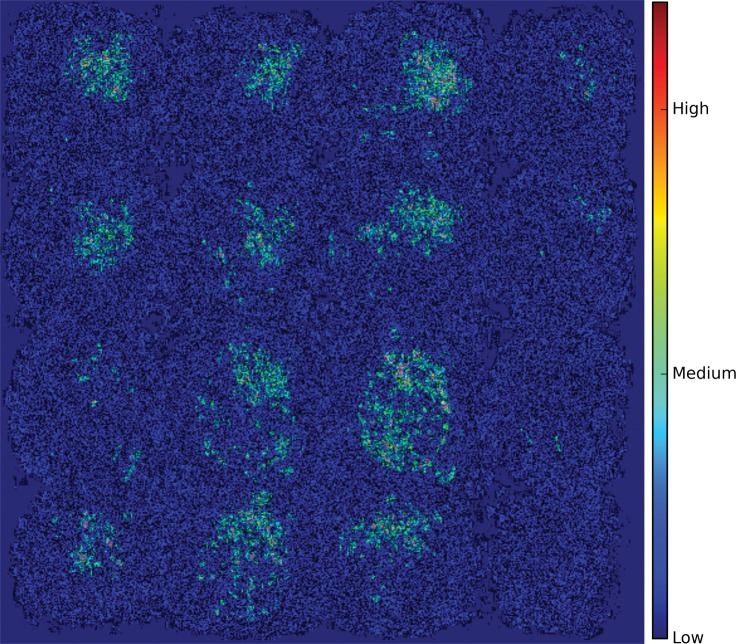
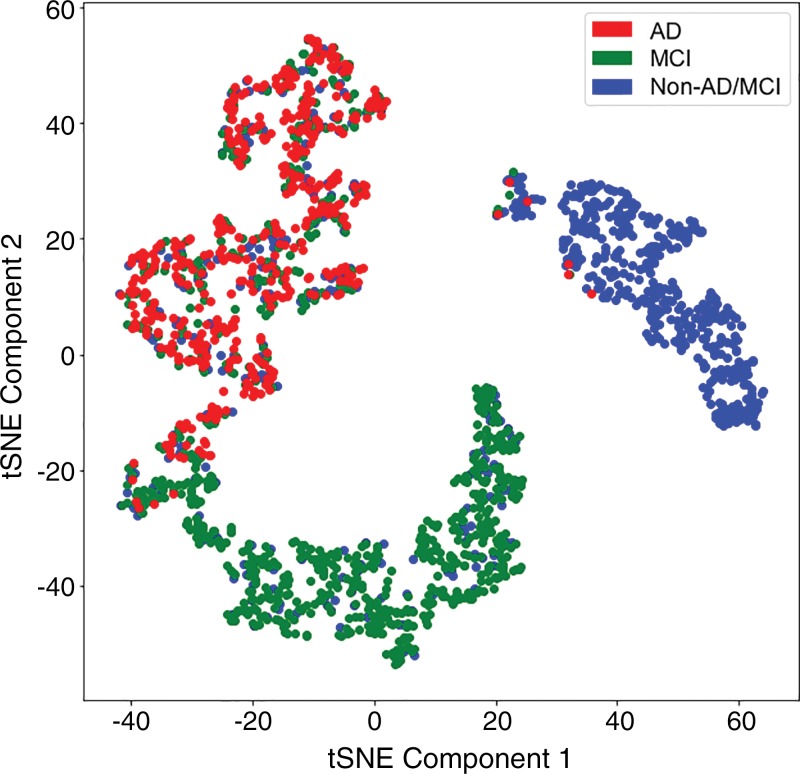
Purpose To develop and validate a deep learning algorithm that predicts the final diagnosis of Alzheimer disease (AD), mild cognitive impairment, or neither at fluorine 18 (18F) fluorodeoxyglucose (FDG) PET of the brain and compare its performance to that of radiologic readers. Materials and Methods Prospective 18F-FDG PET brain images from the Alzheimer's Disease Neuroimaging Initiative (ADNI) (2109 imaging studies from 2005 to 2017, 1002 patients) and retrospective independent test set (40 imaging studies from 2006 to 2016, 40 patients) were collected. Final clinical diagnosis at follow-up was recorded. Convolutional neural network of InceptionV3 architecture was trained on 90% of ADNI data set and tested on the remaining 10%, as well as the independent test set, with performance compared to radiologic readers. Model was analyzed with sensitivity, specificity, receiver operating characteristic (ROC), saliency map, and t-distributed stochastic neighbor embedding. Results The algorithm achieved area under the ROC curve of 0.98 (95% confidence interval: 0.94, 1.00) when evaluated on predicting the final clinical diagnosis of AD in the independent test set (82% specificity at 100% sensitivity), an average of 75.8 months prior to the final diagnosis, which in ROC space outperformed reader performance (57% [four of seven] sensitivity, 91% [30 of 33] specificity; P < .05). Saliency map demonstrated attention to known areas of interest but with focus on the entire brain. Conclusion By using fluorine 18 fluorodeoxyglucose PET of the brain, a deep learning algorithm developed for early prediction of Alzheimer disease achieved 82% specificity at 100% sensitivity, an average of 75.8 months prior to the final diagnosis. © RSNA, 2018 Online supplemental material is available for this article. See also the editorial by Larvie in this issue.


Figures

Figure 1:
Figure 1:
Inclusion and exclusion criteria for the independent test set. Patient must have had at least one follow-up with a neurologist at our local institution. ADNI = Alzheimer’s Disease Neuroimaging Initiative.
Figure 2:
Figure 2:
Example of fluorine 18 fluorodeoxyglucose PET images from Alzheimer’s Disease Neuroimaging Initiative set preprocessed with the grid method for patients with Alzheimer disease (AD). One representative zoomed-in section was provided for each of three example patients: A, 76-year-old man with AD, B, 83-year-old woman with mild cognitive impairment (MCI), and, C, 80-year-old man with non-AD/MCI. In this example, the patient with AD presented slightly less gray matter than did the patient with non-AD/MCI. The difference between the patient with MCI and the patient with non-AD/MCI appeared minimal to the naked eye.
Figure 3:
Figure 3:
Convolutional neural network architecture, Inception v3, used in this study. Inception v3 network stacks 11 inception modules where each module consists of pooling layers and convolutional filters with rectified linear units as activation function. The input of the model is two-dimensional images of 16 horizontal sections of the brain placed on 4 × 4 grids as produced by the preprocessing step. Three fully connected layers of size 1024, 512, and 3 are added to the final concatenation layer. A dropout with rate of 0.6 is applied before the fully connected layers as means of regularization. The model is pretrained on ImageNet dataset and further fine-tuned with a batch size of 8 and learning rate of 0.0001.
Figure 4a:
Figure 4a:
Receiver operating characteristic (ROC) curves of deep learning model Inception V3 trained on 90% of Alzheimer’s Disease Neuroimaging Initiative (ADNI) data and tested on the remaining 10% of ADNI set and independent test set. (a) ROC curves of trained deep learning model tested on the remaining 10% of ADNI set. ROC curve labeled AD (Alzheimer disease) represents the core model performance for distinguishing AD versus all other cases. ROC curves for mild cognitive impairment (MCI) and non-AD/MCI are also reported for technical completeness. (b) ROC curves including the 95% confidence interval of trained deep learning model tested on the independent test set together with reader performance plotted on ROC space. The deep learning algorithm performs statistically significantly better at recognizing patients with AD on the independent test set. The algorithm is also better at recognizing patient with non-AD/MCI and worse at recognizing patients with MCI, but did not reach statistical significance.
Figure 4b:
Figure 4b:
Receiver operating characteristic (ROC) curves of deep learning model Inception V3 trained on 90% of Alzheimer’s Disease Neuroimaging Initiative (ADNI) data and tested on the remaining 10% of ADNI set and independent test set. (a) ROC curves of trained deep learning model tested on the remaining 10% of ADNI set. ROC curve labeled AD (Alzheimer disease) represents the core model performance for distinguishing AD versus all other cases. ROC curves for mild cognitive impairment (MCI) and non-AD/MCI are also reported for technical completeness. (b) ROC curves including the 95% confidence interval of trained deep learning model tested on the independent test set together with reader performance plotted on ROC space. The deep learning algorithm performs statistically significantly better at recognizing patients with AD on the independent test set. The algorithm is also better at recognizing patient with non-AD/MCI and worse at recognizing patients with MCI, but did not reach statistical significance.
Figure 5a:
Figure 5a:
Saliency map of deep learning model Inception V3 on the classification of Alzheimer disease. (a) A representative saliency map with anatomic overlay in 77-year-old man. (b) Average saliency map over 10% of Alzheimer’s Disease Neuroimaging Initiative set. (c) Average saliency map over independent test set. The closer a pixel color is to the "High" end of the color bar in the image, the more influence it has on the prediction of Alzheimer disease class.
Figure 5b:
Figure 5b:
Saliency map of deep learning model Inception V3 on the classification of Alzheimer disease. (a) A representative saliency map with anatomic overlay in 77-year-old man. (b) Average saliency map over 10% of Alzheimer’s Disease Neuroimaging Initiative set. (c) Average saliency map over independent test set. The closer a pixel color is to the "High" end of the color bar in the image, the more influence it has on the prediction of Alzheimer disease class.
Figure 5c:
Figure 5c:
Saliency map of deep learning model Inception V3 on the classification of Alzheimer disease. (a) A representative saliency map with anatomic overlay in 77-year-old man. (b) Average saliency map over 10% of Alzheimer’s Disease Neuroimaging Initiative set. (c) Average saliency map over independent test set. The closer a pixel color is to the "High" end of the color bar in the image, the more influence it has on the prediction of Alzheimer disease class.
Figure 6:
Figure 6:
Visualization of training set after dimension reduction with t-distributed stochastic neighbor embedding (t-SNE). Each dot represents the 1024 features output by the final fully connected layer of the Inception V3 network. Red dots represent samples from Alzheimer disease (AD), green dots represent samples from mild cognitive impairment (MCI), and blue dots represent samples from neither classes (non-AD/MCI).

Comment in

Similar articles

Cited by

References

    1. Jack CR, Jr, Albert MS, Knopman DS, et al. Introduction to the recommendations from the National Institute on Aging-Alzheimer’s Association workgroups on diagnostic guidelines for Alzheimer’s disease. Alzheimers Dement 2011;7(3):257–262. - PMC - PubMed
    1. McKhann GM, Knopman DS, Chertkow H, et al. The diagnosis of dementia due to Alzheimer’s disease: recommendations from the National Institute on Aging-Alzheimer’s Association workgroups on diagnostic guidelines for Alzheimer’s disease. Alzheimers Dement 2011;7(3):263–269. - PMC - PubMed
    1. Scheltens P, Blennow K, Breteler MMB, et al. Alzheimer’s disease. Lancet 2016;388(10043):505–517. - PubMed
    1. Matsuda H. The role of neuroimaging in mild cognitive impairment. Neuropathology 2007;27(6):570–577. - PubMed
    1. Mosconi L, Tsui WH, Herholz K, et al. Multicenter standardized 18F-FDG PET diagnosis of mild cognitive impairment, Alzheimer’s disease, and other dementias. J Nucl Med 2008;49(3):390–398. - PMC - PubMed

Publication types

Substances