. 2019 Jan 2;129(1):388-405.
doi: 10.1172/JCI98869. Epub 2018 Dec 10.

Dominant-negative SERPING1 variants cause intracellular retention of C1 inhibitor in hereditary angioedema

Affiliations

Dominant-negative SERPING1 variants cause intracellular retention of C1 inhibitor in hereditary angioedema

Didde Haslund et al. J Clin Invest. .

Abstract

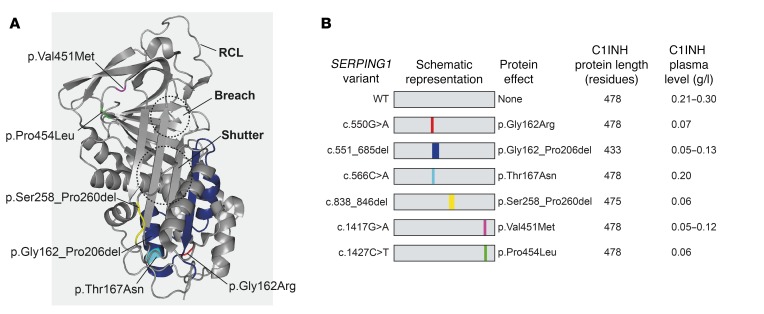
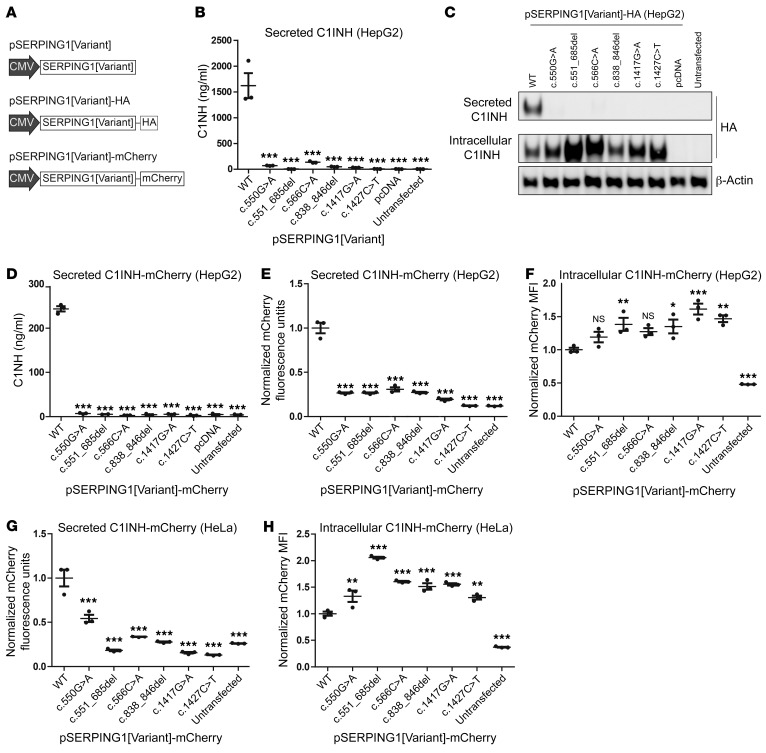
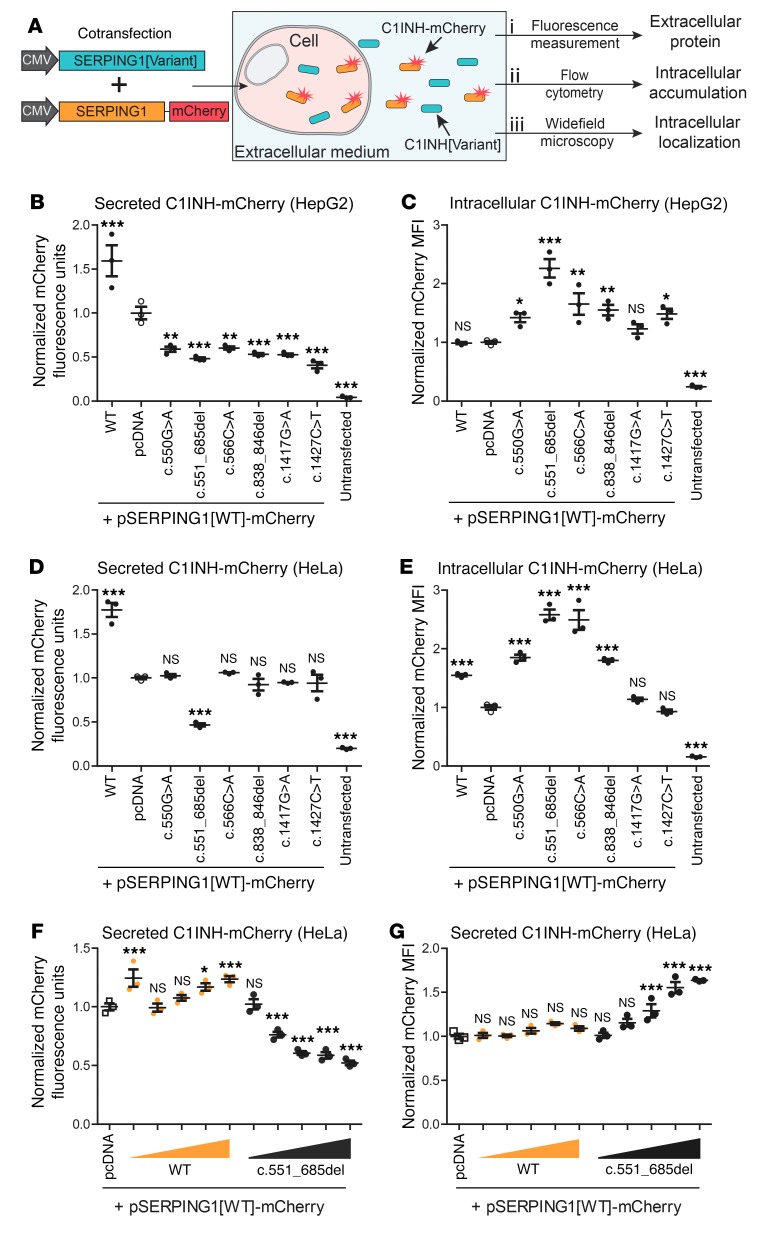
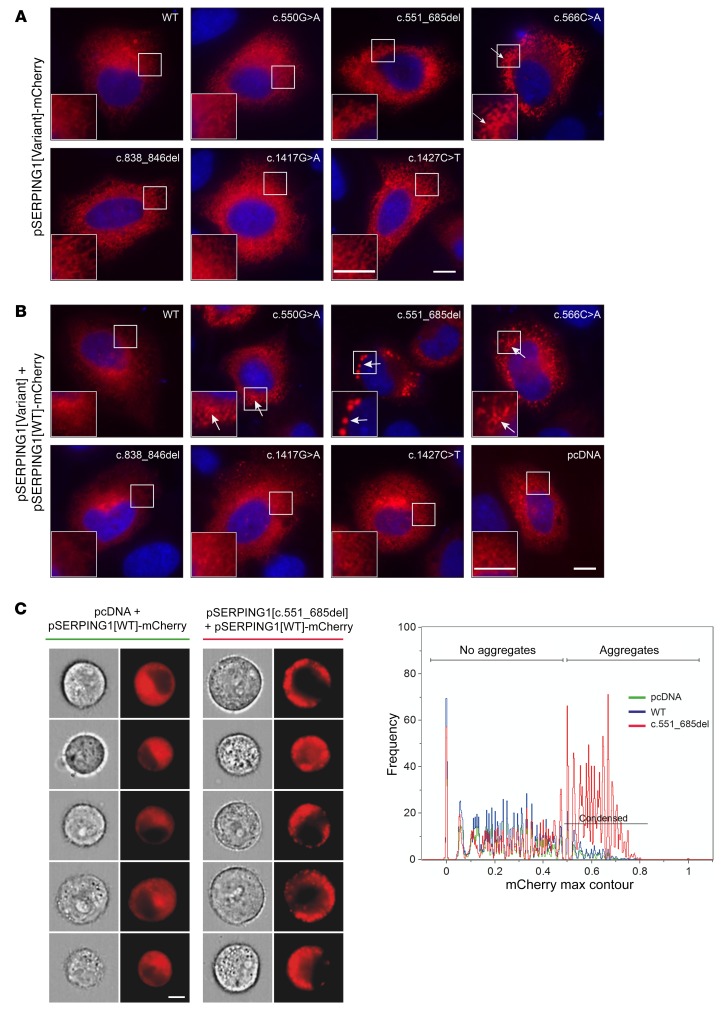
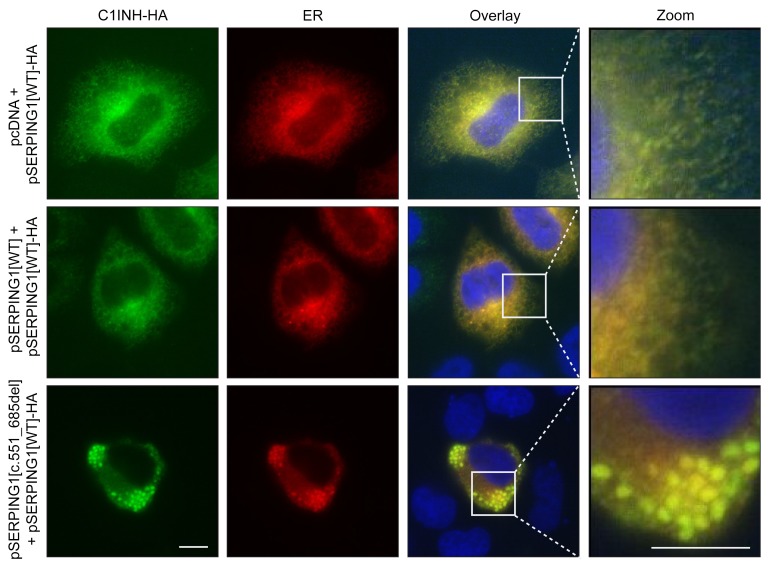
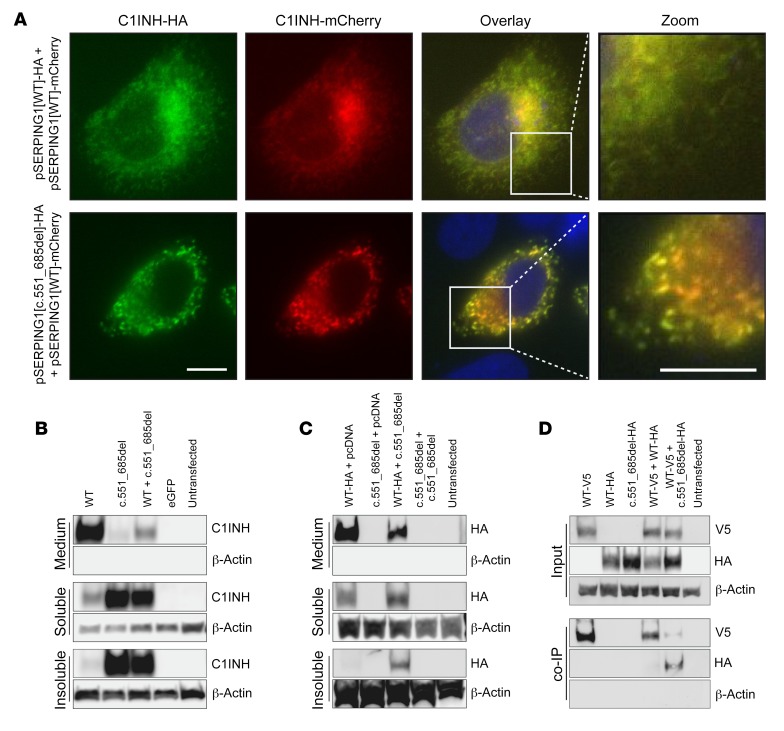
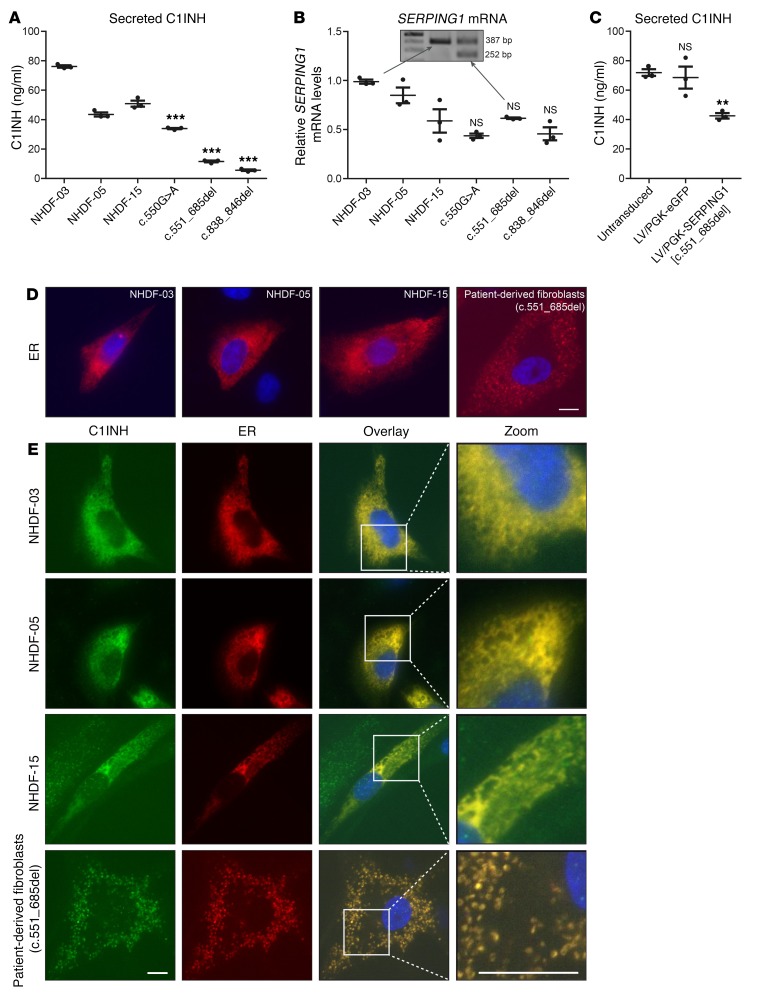
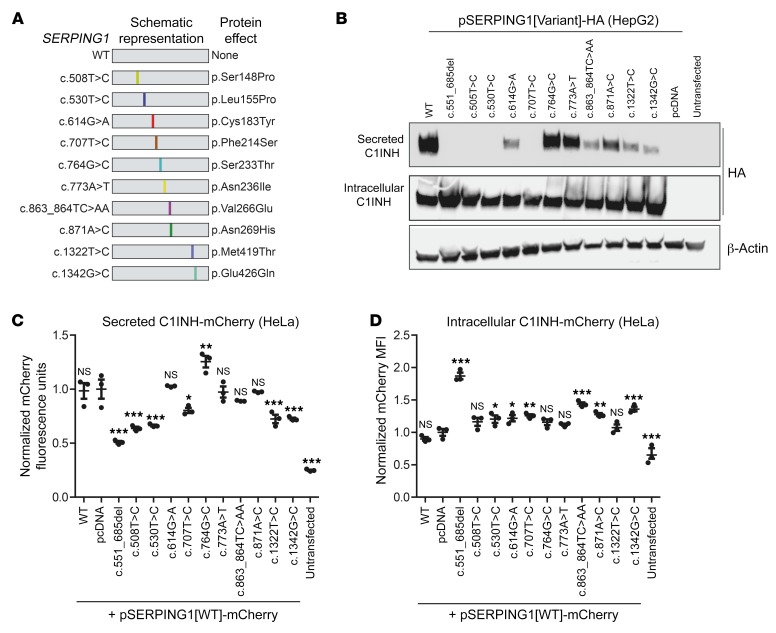
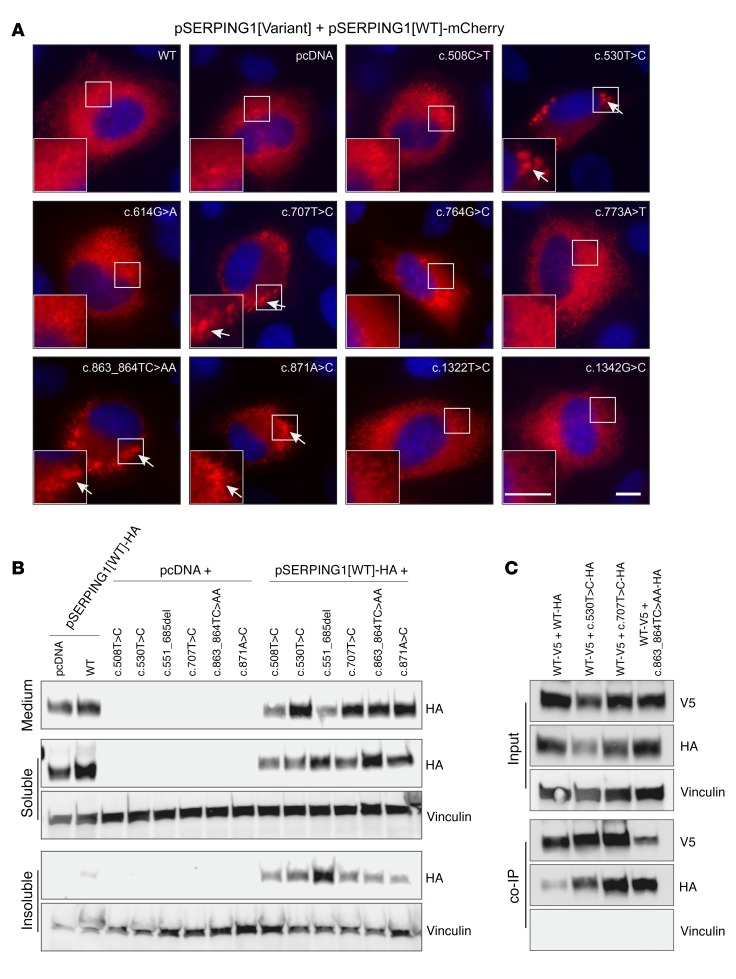
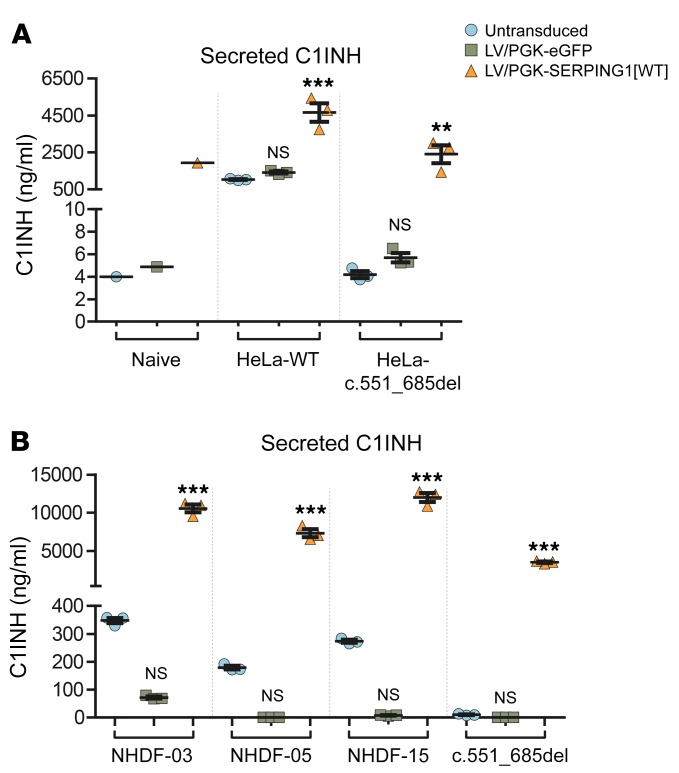
Hereditary angioedema (HAE) is an autosomal dominant disease characterized by recurrent edema attacks associated with morbidity and mortality. HAE results from variations in the SERPING1 gene that encodes the C1 inhibitor (C1INH), a serine protease inhibitor (serpin). Reduced plasma levels of C1INH lead to enhanced activation of the contact system, triggering high levels of bradykinin and increased vascular permeability, but the cellular mechanisms leading to low C1INH levels (20%-30% of normal) in heterozygous HAE type I patients remain obscure. Here, we showed that C1INH encoded by a subset of HAE-causing SERPING1 alleles affected secretion of normal C1INH protein in a dominant-negative fashion by triggering formation of protein-protein interactions between normal and mutant C1INH, leading to the creation of larger intracellular C1INH aggregates that were trapped in the endoplasmic reticulum (ER). Notably, intracellular aggregation of C1INH and ER abnormality were observed in fibroblasts from a heterozygous carrier of a dominant-negative SERPING1 gene variant, but the condition was ameliorated by viral delivery of the SERPING1 gene. Collectively, our data link abnormal accumulation of serpins, a hallmark of serpinopathies, with dominant-negative disease mechanisms affecting C1INH plasma levels in HAE type I patients, and may pave the way for new treatments of HAE.

Keywords: Cell Biology; Genetic diseases; Genetics; Molecular genetics; Serpins.


Conflict of interest statement

Conflict of interest: The authors have declared that no conflict of interest exists.

Figures

Figure 1
Figure 1. Characteristics of studied SERPING1 gene variants and plasma levels of C1INH in patients carrying the variants.
(A) The overall structure of active C1INH protein (Protein Data Bank entry 5DU3). The locations of the studied HAE-causing variants are marked as follows: p.Gly162Arg (red), p.Thr167Asn (cyan), p.Val451Met (magenta) and p.Pro454Leu (green). For p.Gly162_Pro206del and p.Ser258_Pro260del the areas deleted in C1INH are marked with dark blue and yellow, respectively. (B) Presentation of the 6 studied SERPING1 gene variants and key data related to each gene variation and to patients carrying the variants. See Supplemental Table 1 for additional information.
Figure 2
Figure 2. Expression and severely reduced secretion of C1INH encoded by the 6 studied SERPING1 gene variants.
(A) Schematic representation of the vector types used in this study to express SERPING1 gene variants. Black arrows indicate the promoter derived from cytomegalovirus (CMV). (B) C1INH levels in medium from HepG2 cells transfected with 900 ng pSERPING1[Variant] measured by ELISA. (C) Western blot analysis of medium protein and total protein derived from HepG2 cells transfected with 900 ng pSERPING1[Variant]-HA. The secreted and intracellular C1INH levels were detected using a HA-specific antibody. (D) C1INH levels in medium from HepG2 cells transfected with 900 ng pSERPING1[Variant]-mCherry measured by ELISA. (E and F) Secreted and intracellular levels of C1INH in HepG2 cells measured by mCherry fluorescence intensity. (G and H) Secreted and intracellular levels of C1INH in HeLa cells measured by mCherry fluorescence intensity. Cells were transfected with different pSERPING1[Variant]-mCherry vectors. The amount of C1INH-mCherry secreted into the medium was determined using a fluorescence scanner (E and G) and the intracellular level by flow cytometry (F and H). (BH) Transfections were carried out in triplicate (n = 3) and similar results were seen in at least 2 independent experiments. Data are mean ± SEM. *P < 0.05, **P < 0.01, ***P < 0.001, compared with WT. Statistical analyses were performed by 1-way ANOVA with Dunnett’s multiple comparison test. MFI, median fluorescence intensity.
Figure 3
Figure 3. Negative impact of C1INH encoded by HAE-causing SERPING1 gene variants on secretion of normal C1INH-mCherry correlates with increased intracellular protein levels.
(A) Schematic representation of the cellular assay system. Cells were cotransfected with pSERPING1[Variant] and pSERPING1[WT]-mCherry. Expression of mCherry-fused normal C1INH allowed evaluation of the effect of different SERPING1 gene variants on (i) secretion, (ii) intracellular retention, and (iii) intracellular localization of normal C1INH-mCherry. (B and C) Levels of secreted and intracellular C1INH-mCherry in HepG2 cells cotransfected with 450 ng of both pSERPING1[Variant] and pSERPING1[WT]-mCherry. (D and E) Levels of secreted and intracellular C1INH-mCherry in HeLa cells transfected as in B and C. Secretion of normal C1INH-mCherry was measured by fluorescence scanning (B and D) and the intracellular level by flow cytometry (C and E). (F) Increasingly restricted C1INH secretion with higher levels of mutant C1INH. Dose-response experiment was carried out in HeLa cells. Cells were cotransfected with 450 ng pSERPING1[WT]-mCherry and 50, 200, 450, 700, or 900 ng pSERPING1[WT] or pSERPING1[c.551_685del]. pcDNA plasmid was included in all transfections to ensure a total amount of 1,350 ng plasmid DNA in each transfection reaction. (G) Intracellular levels of C1INH-mCherry in cells described in F. (BG) Transfections were carried out in triplicate (n = 3) and similar results were seen in at least 3 independent experiments. Data are mean ± SEM. *P < 0.05, **P < 0.01, ***P < 0.001, compared with pcDNA. Statistical analyses were performed by 1-way ANOVA with Dunnett’s multiple comparison test. MFI, median fluorescence intensity.
Figure 4
Figure 4. Intracellular localization of C1INH-mCherry detected by widefield microscopy and Imagestream analysis.
(A) Intracellular localization of normal and mutated C1INH-mCherry (red). Live widefield microscopy of HeLa cells cultured for 48 hours after transfection with 900 ng pSERPING1[Variant]-mCherry. Scale bar: 10 μm. (B) Intracellular localization of normal C1INH-mCherry (red) in the presence of HAE-causing SERPING1 gene variants. Live widefield microscopy of HeLa cells cultured for 48 hours after cotransfection with 450 ng pSERPING1[WT]-mCherry (red) and 450 ng pSERPING1[Variant] gene variants. Aggregates of normal C1INH-mCherry were detectable in cells cotransfected with pSERPING1[WT]-mCherry and vectors encoding the following SERPING1 variants: c.550G>A, c.551_685del, or c.566C>A. Examples of aggregates are indicated with white arrows. Cells were incubated with Hoechst to visualize nuclei (blue). Scale bar: 10 μm. (C) High prevalence of C1INH aggregates in cells expressing normal and c.551_685del SERPING1 gene variants. HeLa cells were cotransfected with pSERPING1[WT]-mCherry and either pcDNA, pSERPING1[WT] or pSERPING1[c.551_685del]. The cells were analyzed by imaging flow cytometry using Imagestream technology, and cells with C1INH aggregates were identified to have a max contour above 0.5 (condensed). Two sets of columns (left panels) show light/fluorescence microscopy images of cells expressing SERPING1[WT]-mCherry in the presence of pcDNA and pSERPING1[c.551_685del], respectively. Scale bar: 7 μm. Right panel: Imagestream-based quantification of larger cell populations, showing aggregate formation predominantly in cells cotransfected with pSERPING1[WT]-mCherry and pSERPING1[c.551_685del] (red graph). Number (n) of condensed cells relative to the number of mCherry-positive cells were as follows: pSERPING1[WT]-mCherry + pcDNA, n = 262/2,137; pSERPING1[WT]-mCherry + pSERPING1[WT], n = 159/1,395; pSERPING1[WT]-mCherry + pSERPING1[c.551_685del], n = 2,115/3,579. Data shown in A and B are representative of findings from more than 3 biological replicates, and similar results were seen in at least 3 independent experiments. Imaging flow cytometry in C was performed twice with reproducible results.
Figure 5
Figure 5. Intracellular retention of C1INH in the ER.
HeLa cells were cotransfected with pSERPING1[WT]-HA and pcDNA, pSERPING1[WT], or pSERPING1[c.551_685del]. To visualize ER, an expression plasmid encoding the Tomato fluorescence gene fused to an endoplasmic reticulum–targeting sequence was included in the transfections (red). At 48 hours after the cotransfections, the cells were fixated and incubated with a HA-antibody and Hoechst to visualize normal C1INH-HA (green) and the nuclei (blue), respectively. Scale bars: 10 μm. Data are representative of findings from more than 3 biological replicates, and similar results were seen in at least 3 independent experiments.
Figure 6
Figure 6. Direct interaction between normal C1INH and C1INHGly162_Pro206del.
(A) Colocalization of normal and mutated C1INH. Widefield microscopy of HeLa cells cultured for 48 hours after cotransfection with SERPING1[WT]-mCherry and SERPING1[WT]-HA or SERPING1[c.551_685del]-HA. C1INH-HA was visualized with HA-specific antibody (green) and nuclei with Hoechst (blue). Scale bars: 10 μm. (B and C) Western blot analysis of total protein in medium as well as soluble and insoluble protein fractions derived from HeLa cells cultured for 72 hours after transfection or cotransfection with 900 ng plasmid DNA in total. Separation of soluble and insoluble C1INH fractions by centrifugation of whole cell lysate at 12,000g for 20 minutes at 4°C. (B) Detection of C1INHGly162_Pro206del in the insoluble fraction. HeLa cells were transfected with 900 ng pSERPING1[WT] or pSERPING1[c.551_685del] or cotransfected with 450 ng pSERPING1[WT] and 450 ng pSERPING1[c.551_685de]. C1INH levels were detected using PAb C1INH antibody. (C) Normal C1INH in the insoluble fraction induced by C1INHGly162_Pro206del. HeLa cells were cotransfected with 450 ng pSERPING1[WT]-HA and either 450 ng pcDNA or pSERPING1[c.551_685del]. Normal C1INH-HA levels were detected with HA-specific antibody. (D) Direct protein-protein interaction between normal and mutated C1INH. Coimmunoprecipitation on whole cell lysate from HeLa cells cultured for 48 hours after transfection or cotransfection with 40 μg plasmid DNA in total. HeLa cells were transfected with pSERPING1[WT]-V5, pSERPING1[WT]-HA, or pSERPING1[c.551_685del]-HA, or cotransfected with pSERPING1[WT]-V5 and pSERPING1[WT]-HA or pSERPING1[c.551_685del]-HA. A small amount of the whole cell lysate was saved (input) and the remaining lysate incubated with anti-V5 coupled beads to capture normal V5-tagged C1INH and interacting proteins (co-IP). Presence of normal C1INH-V5 and C1INH[Variant]-HA was visualized with V5- and HA-specific antibodies as relevant. (A) Data are representative of findings from more than 3 biological replicates. (AC) Similar results were seen in at least 2 independent experiments. (BD) Transfections were carried out in triplicate (n = 3).
Figure 7
Figure 7. Correlation of reduced C1INH secretion in skin-derived fibroblasts derived from a patient carrying the c.551_685del mutation with C1INH accumulation in ER.
(A) C1INH in medium from control (NHDF-03, NHDF-05, NHDF-15) and patient-derived fibroblasts. (B) Evaluation of SERPING1 mRNA expression levels in control and patient-derived fibroblasts by qPCR. Equal expression of normal and mutant SERPING1 alleles in fibroblasts derived from the patient carrying the c.551_685del mutation. Inset: Agarose gel showing PCR products from PCR amplification (using primers spanning the deletion) on cDNA synthesized from RNA purified from either control NHDF-03 fibroblasts or patient-derived fibroblasts. (C) Restricted C1INH secretion induced by lentiviral delivery of SERPING1[c.551_685del]. Control NHDF-03 fibroblasts were transduced with lentiviral vectors encoding C1INHGly162_Pro206del (or eGFP as control) at an estimated MOI of 1. (D) Structure of the ER in control fibroblasts and fibroblasts derived from the c.551_685del patient. The fibroblasts were transfected with 900 ng plasmid encoding the Tomato fluorescence gene fused to an ER-targeting sequence to visualize ER (red). Cells were fixated 48 hours after transfections, and nuclei visualized with Hoechst (blue). Scale bar: 10 μm. (E) Accumulation of endogenous C1INH within the ER of patient-derived fibroblasts. The fibroblasts were transfected as in D, fixated, and incubated with Hoechst to visualize the nuclei (blue) and C1INH antibody to visualize both normal and mutated C1INH (green). Scale bars: 10 μm. (AC) The experiment was carried out in triplicate (n = 3), and data are mean ± SEM. *P < 0.05, **P < 0.01, ***P < 0.001, patient-derived fibroblasts compared with NHDF-05 (A) or NHDF-15 (B) or transduced compared with untransduced NHDF-03 (C). Statistical analyses were performed by 1-way ANOVA with Dunnett’s multiple comparison test. (DE) Data are representative of findings from more than 3 biological replicates. (AE) Similar results were seen in at least 2 independent experiments.
Figure 8
Figure 8. Dominant-negative properties of additional HAE-causing SERPING1 gene variants.
(A) Schematic representation of studied SERPING1 gene variants. See Supplemental Table 2 for additional information. (B) Western blot analysis of medium and total protein derived from HepG2 cells transfected with 900 ng pSERPING1[Variant]-HA. The C1INH-HA levels were detected using a HA-specific antibody. (C and D) Secretion and intracellular levels of normal C1INH-mCherry in HeLa cells cotransfected with 450 ng pSERPING1[WT]-mCherry and 450 ng pSERPING1[Variant]. (BD) Transfections were carried out in triplicate (n = 3), and similar results were seen in at least 2 independent experiments. (C and D) *P < 0.05, **P < 0.01, ***P < 0.001, compared with pcDNA. Statistical analyses were performed by 1-way ANOVA with Dunnett’s multiple comparison test.
Figure 9
Figure 9. Formation of C1INH aggregates containing associated normal and mutant C1INH induced by dominant-negative SERPING1 gene variants causing HAE.
(A) Live widefield microscopy of HeLa cells cultured for 48 hours after cotransfection with 450 ng pSERPING1[WT]-mCherry and 450 ng pSERPING1[Variant]. Aggregates are indicated with arrows. Scale bars: 10 μm. (B) Western blot analysis of medium, soluble and insoluble C1INH derived from HeLa cells cultured for 72 hours after cotransfection with 450 ng pSERPING1[WT]-HA and 450 ng pSERPING1[Variant]. The experiment was carried out as described in Figure 6, B and C. (C) Coimmunoprecipitation on cell lysate from HeLa cells cultured for 48 hours after cotransfection with 20 μg pSERPING1[WT]-V5 and 20 μg pSERPING1[Variant]-HA. The experiment was carried out as described in Figure 6D. (A and B) Data are representative of findings from more than 3 biological replicates and similar results were seen in at least 2 independent experiments. Transfections were carried out in triplicate (n = 3; B) or duplicate (n = 2; C).
Figure 10
Figure 10. Increased C1INH secretion after lentiviral delivery of WT SERPING1 gene models HAE gene therapy in fibroblasts from patients carrying a dominant-negative disease allele (SERPING1[c.551_685del]).
(A) HeLa-WT and HeLa-c.551_685del cell populations (3 of each) were created by transduction of naive HeLa cells with lentiviral vectors encoding normal C1INH or C1INHGly162_Pro206del. Stably transduced and naive HeLa cells were reseeded and transduced with lentiviral vectors encoding eGFP or normal C1INH. Transduction of each of the 3 cell populations was carried out in triplicate (n = 3) and the medium was pooled for each transduced cell population prior to C1INH measurements. For the naive cell line, cells were transduced and medium pooled prior to C1INH measurement, resulting in only a single data point for each treatment. (B) Control and patient-derived fibroblasts were transduced with lentiviral vectors encoding normal C1INH or eGFP as a control. Transductions were carried out in triplicate (n = 3). (A and B) Data are mean ± SEM. **P < 0.01, ***P < 0.001, compared with untransduced cells in each group. NS indicates lack of statistical significance between untransduced and LV/PGK-eGFP–treated groups. Statistical analyses were performed by 1-way ANOVA with Dunnett’s multiple comparison test. (B) Similar results were seen in at least 2 independent experiments. LV, lentiviral vectors.

Comment in

  • The hereditary angioedema syndromes.
    Schmaier AH. Schmaier AH. J Clin Invest. 2019 Jan 2;129(1):66-68. doi: 10.1172/JCI125378. Epub 2018 Dec 10. J Clin Invest. 2019. PMID: 30530986 Free PMC article.

References

    1. Bernstein JA. HAE update: epidemiology and burden of disease. Allergy Asthma Proc. 2013;34(1):3–6. doi: 10.2500/aap.2013.34.3623. - DOI - PubMed
    1. Germenis AE, Speletas M. Genetics of hereditary angioedema revisited. Clin Rev Allergy Immunol. 2016;51(2):170–182. doi: 10.1007/s12016-016-8543-x. - DOI - PubMed
    1. Bygum A. Hereditary angio-oedema in Denmark: a nationwide survey. Br J Dermatol. 2009;161(5):1153–1158. doi: 10.1111/j.1365-2133.2009.09366.x. - DOI - PubMed
    1. Colobran R, Lois S, de la Cruz X, Pujol-Borrell R, Hernández-González M, Guilarte M. Identification and characterization of a novel splice site mutation in the SERPING1 gene in a family with hereditary angioedema. Clin Immunol. 2014;150(2):143–148. doi: 10.1016/j.clim.2013.11.013. - DOI - PubMed
    1. Zuraw BL, Christiansen SC. HAE pathophysiology and underlying mechanisms. Clin Rev Allergy Immunol. 2016;51(2):216–229. doi: 10.1007/s12016-016-8561-8. - DOI - PubMed

Publication types

MeSH terms

Substances