. 2019 May 15;199(10):1225-1237.
doi: 10.1164/rccm.201804-0650OC.

Multidimensional Assessment of the Host Response in Mechanically Ventilated Patients with Suspected Pneumonia

Affiliations

Multidimensional Assessment of the Host Response in Mechanically Ventilated Patients with Suspected Pneumonia

James M Walter et al. Am J Respir Crit Care Med. .

Abstract

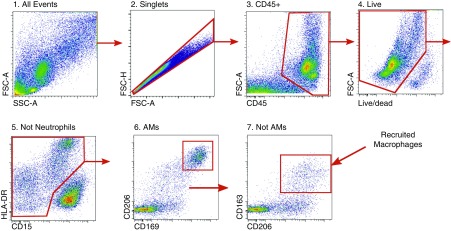
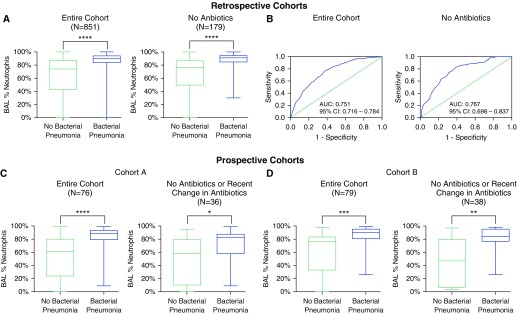
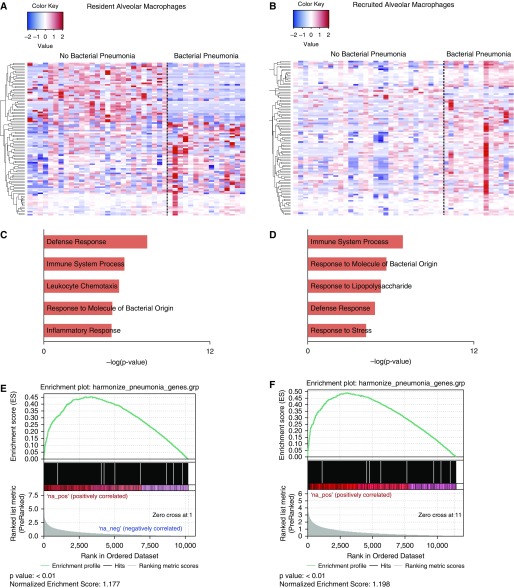
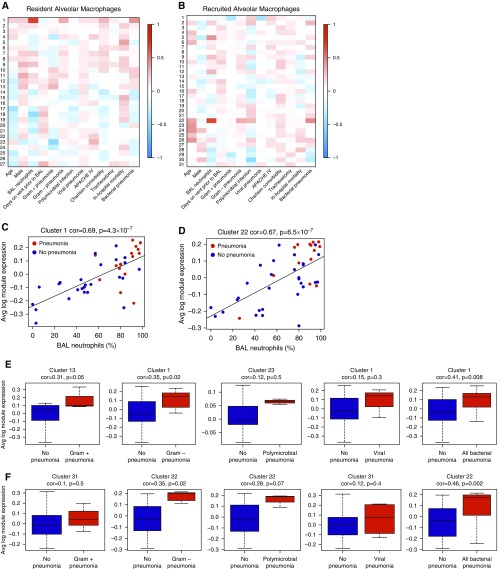
Rationale: The identification of informative elements of the host response to infection may improve the diagnosis and management of bacterial pneumonia. Objectives: To determine whether the absence of alveolar neutrophilia can exclude bacterial pneumonia in critically ill patients with suspected infection and to test whether signatures of bacterial pneumonia can be identified in the alveolar macrophage transcriptome. Methods: We determined the test characteristics of alveolar neutrophilia for the diagnosis of bacterial pneumonia in three cohorts of mechanically ventilated patients. In one cohort, we also isolated macrophages from alveolar lavage fluid and used the transcriptome to identify signatures of bacterial pneumonia. Finally, we developed a humanized mouse model of Pseudomonas aeruginosa pneumonia to determine if pathogen-specific signatures can be identified in human alveolar macrophages. Measurements and Main Results: An alveolar neutrophil percentage less than 50% had a negative predictive value of greater than 90% for bacterial pneumonia in both the retrospective (n = 851) and validation cohorts (n = 76 and n = 79). A transcriptional signature of bacterial pneumonia was present in both resident and recruited macrophages. Gene signatures from both cell types identified patients with bacterial pneumonia with test characteristics similar to alveolar neutrophilia. Conclusions: The absence of alveolar neutrophilia has a high negative predictive value for bacterial pneumonia in critically ill patients with suspected infection. Macrophages can be isolated from alveolar lavage fluid obtained during routine care and used for RNA-Seq analysis. This novel approach may facilitate a longitudinal and multidimensional assessment of the host response to bacterial pneumonia.

Keywords: RNA-Seq; alveolar macrophages; bacterial pneumonia; host response.


Figures

Figure 1.
Figure 1.
Gating strategy used to identify resident and recruited macrophages from patient BAL fluid. Tissue-resident alveolar macrophages were identified using sequential gating as singlets/CD45+/live/CD15/CD206++/CD169+/HLADR+/high autofluorescence; recruited macrophages were identified as singlets/CD45+/live/CD15/CD169/CD206++/CD163+/HLA-DR+/high autofluorescence. Data from a representative patient are shown. AMs = alveolar macrophages; CD = cluster of differentiation; FSC-A = forward scatter–area; FSC-H = forward scatter–height; SSC-A = side scatter–area.
Figure 2.
Figure 2.
BAL neutrophil percentage has a high negative predictive value for bacterial pneumonia in critically ill patients with suspected infection. (A) Percent of neutrophils in BAL fluid in a retrospective cohort of mechanically ventilated patients with suspected pneumonia stratified by antibiotic use at the time of sampling. Boxes extend from the 25th to the 75th percentiles of recorded values, and the horizontal line is plotted at the median. Vertical lines represent ranges. (B) Receiver operating characteristics curve of BAL neutrophil percentage for the diagnosis of bacterial pneumonia stratified by antibiotic use at the time of sampling. (C and D) Percentage of neutrophils in BAL fluid in two independent prospective cohorts of mechanically ventilated patients with suspected pneumonia. Results are shown for the entire cohort and the subgroup of patients who were either not on antibiotics or did not have a change in antibiotics within 48 hours of sampling. Patients who were receiving antibiotics that did not cover the isolated pathogen were considered to be off antibiotics. *P < 0.05, **P < 0.01, ***P < 0.001, and ****P < 0.0001. AUC = area under the curve; CI = confidence interval.
Figure 3.
Figure 3.
Procalcitonin does not discriminate between the presence or absence of bacterial pneumonia in mechanically ventilated patients with suspected infection. (A) Scatter plots showing procalcitonin values in two independent prospective cohorts of mechanically ventilated patients with suspected pneumonia. Vertical lines extend from the 25th to the 75th percentiles of recorded values, and the horizontal line is plotted at the median (P > 0.05 for both cohorts). (B) Receiver operating characteristics curves of procalcitonin for the diagnosis of bacterial pneumonia. AUC = area under the curve; CI = confidence interval; ns = not significant.
Figure 4.
Figure 4.
Transcriptional profiling of flow-sorted resident and recruited alveolar macrophages from critically ill patients with suspected infection reveals a signature of bacterial pneumonia. (A and B) In a derivation cohort, 49 flow-sorted resident alveolar macrophage samples and 46 recruited macrophage samples were obtained from critically ill patients with suspected infection and processed for RNA sequencing. Estimation of differential gene expression using EdgeR was performed comparing patients with and without pneumonia, and heatmaps were generated showing significantly differentially expressed genes ordered using hierarchical clustering. Columns represent individual patients, and rows represent specific genes. (C and D) Functional enrichment analysis with GO Biological Processes was performed using GOrilla. Representative GO processes upregulated in patients with pneumonia are shown. (E and F) Gene set enrichment analysis was performed using the curated Comparative Toxicogenomics Database pneumonia gene set. Enrichment plots with P values and normalized enrichment scores for both cells types are shown. GO = gene ontology.
Figure 5.
Figure 5.
Weighted correlation network analysis (WGCNA) identifies unique gene clusters associated with pneumonia subtypes. (A and B) WGCNA was performed for resident alveolar macrophages (A) and recruited macrophages (B). Each column represents a unique clinical variable. For resident macrophages, row 1 identifies a cluster of 391 genes strongly associated with both BAL neutrophilia and bacterial pneumonia. For recruited macrophages, cluster 22 identifies a cluster of 220 genes strongly associated with both BAL neutrophilia and bacterial pneumonia. (C and D) Average log module expression of these two clusters is plotted against the percentage of neutrophils in BAL fluid. (E and F) Average log module expression of gene clusters with the strongest positive association with pneumonia subtypes. (E) Expression for resident alveolar macrophages; (F) expression for recruited macrophages. APACHE = Acute Physiology and Chronic Health Evaluation; Avg = average; cor = correlation coefficient.
Figure 6.
Figure 6.
Pseudomonas aeruginosa pneumonia produces an identifiable transcriptional signature in alveolar macrophages from humanized (MISTRG) mice. (A) Gating strategy used to identify human alveolar macrophages in humanized mice. (B) Immunohistochemistry for CD206 demonstrates CD206+ cells in the alveolar space of humanized mice (black arrows). Representative histology from each experimental group is shown. Scale bars = 200 μm; insets, scale bars = 100 μm. (C) k-means clustering (k = 6) of 3,078 differentially expressed genes between all groups. Genes were selected using an ANOVA approach and a false discovery rate (FDR) q value less than 0.05. (D) Expression of the top 100 differentially expressed genes (identified using an FDR q value) in humanized mice infected with a high-virulence strain of P. aeruginosa compared with control subjects was assessed in four patients with P. aeruginosa pneumonia and four mechanically ventilated patients without infection. Counts for mice and humans were normalized separately. Representative genes are shown to the right of the figure. Each row represents an individual gene. Each column represents an individual mouse or patient. AM = alveolar macrophage; CD = cluster of differentiation; FSC-A = forward scatter-area; FSC-H = forward scatter-height.

Comment in

Similar articles

Cited by

References

    1. Barlam TF, Cosgrove SE, Abbo LM, MacDougall C, Schuetz AN, Septimus EJ, et al. Implementing an antibiotic stewardship program: guidelines by the Infectious Diseases Society of America and the Society for Healthcare Epidemiology of America. Clin Infect Dis. 2016;62:e51–e77. - PMC - PubMed
    1. Flanders SA, Saint S. Why does antimicrobial overuse in hospitalized patients persist? JAMA Intern Med. 2014;174:661–662. - PubMed
    1. Marston HD, Dixon DM, Knisely JM, Palmore TN, Fauci AS. Antimicrobial resistance. JAMA. 2016;316:1193–1204. - PubMed
    1. Shindo Y, Ito R, Kobayashi D, Ando M, Ichikawa M, Shiraki A, et al. Risk factors for drug-resistant pathogens in community-acquired and healthcare-associated pneumonia. Am J Respir Crit Care Med. 2013;188:985–995. - PubMed
    1. Xu J, Murphy SL, Kochanek KD, Bastian BA. Deaths: final data for 2013. Natl Vital Stat Rep. 2016;64:1–119. - PubMed

Publication types

Substances