

Health-motivated taxes on red and processed meat: A modelling study on optimal tax levels and associated health impacts
- PMID: 30399152
- PMCID: PMC6219766
- DOI: 10.1371/journal.pone.0204139
Health-motivated taxes on red and processed meat: A modelling study on optimal tax levels and associated health impacts
Abstract
Background: The consumption of red and processed meat has been associated with increased mortality from chronic diseases, and as a result, it has been classified by the World Health Organization as carcinogenic (processed meat) and probably carcinogenic (red meat) to humans. One policy response is to regulate red and processed meat consumption similar to other carcinogens and foods of public health concerns. Here we describe a market-based approach of taxing red and processed meat according to its health impacts.
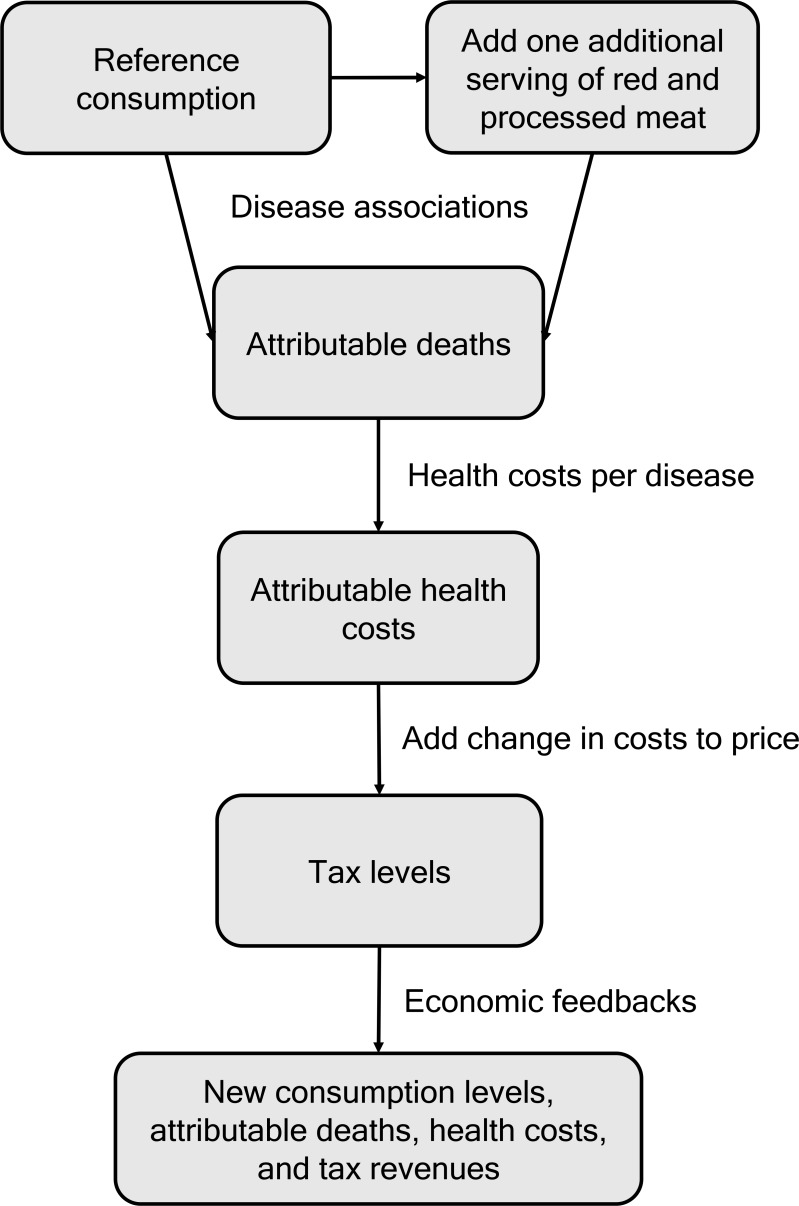
Methods: We calculated economically optimal tax levels for 149 world regions that would account for (internalize) the health costs associated with ill-health from red and processed meat consumption, and we used a coupled modelling framework to estimate the impacts of optimal taxation on consumption, health costs, and non-communicable disease mortality. Health impacts were estimated using a global comparative risk assessment framework, and economic responses were estimated using international data on health costs, prices, and price elasticities.
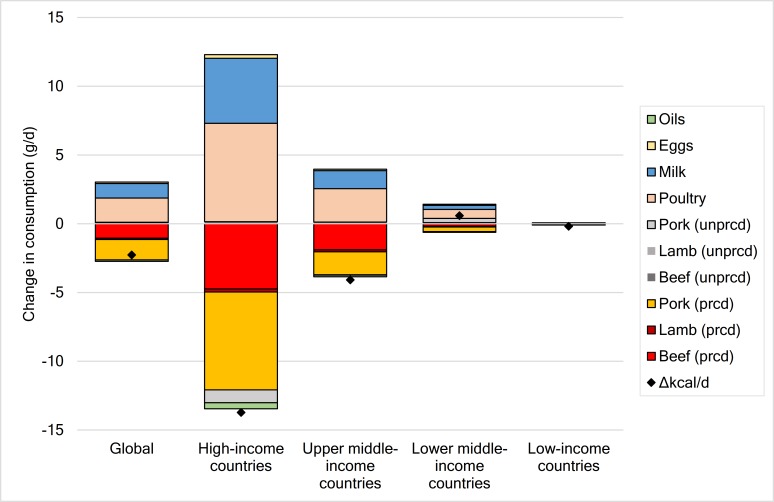
Findings: The health-related costs to society attributable to red and processed meat consumption in 2020 amounted to USD 285 billion (sensitivity intervals based on epidemiological uncertainty (SI), 93-431), three quarters of which were due to processed meat consumption. Under optimal taxation, prices for processed meat increased by 25% on average, ranging from 1% in low-income countries to over 100% in high-income countries, and prices for red meat increased by 4%, ranging from 0.2% to over 20%. Consumption of processed meat decreased by 16% on average, ranging from 1% to 25%, whilst red meat consumption remained stable as substitution for processed meat compensated price-related reductions. The number of deaths attributable to red and processed meat consumption decreased by 9% (222,000; SI, 38,000-357,000), and attributable health costs decreased by 14% (USD 41 billion; SI, 10-57) globally, in each case with greatest reductions in high and middle-income countries.
Interpretation: Including the social health cost of red and processed meat consumption in the price of red and processed meat could lead to significant health and environmental benefits, in particular in high and middle-income countries. The optimal tax levels estimated in this study are context-specific and can complement the simple rules of thumb currently used for setting health-motivated tax levels.
Conflict of interest statement
The authors have declared that no competing interests exist.
Figures

References
-
- Micha R, Khatibzadeh S, Shi P, Andrews KG, Engell RE, Mozaffarian D, et al. Global, regional and national consumption of major food groups in 1990 and 2010: a systematic analysis including 266 country-specific nutrition surveys worldwide. BMJ Open. 2015;5: e008705 10.1136/bmjopen-2015-008705 - DOI - PMC - PubMed
Publication types
MeSH terms
Grants and funding
LinkOut - more resources
Full Text Sources
Other Literature Sources
