. 2018 Nov 6;13(11):e0207100.
doi: 10.1371/journal.pone.0207100. eCollection 2018.

Arrhythmia initiation in catecholaminergic polymorphic ventricular tachycardia type 1 depends on both heart rate and sympathetic stimulation

Affiliations

Arrhythmia initiation in catecholaminergic polymorphic ventricular tachycardia type 1 depends on both heart rate and sympathetic stimulation

Tore K Danielsen et al. PLoS One. .

Abstract

Aims: Catecholaminergic polymorphic ventricular tachycardia type 1 (CPVT1) predisposes to ventricular tachyarrhythmias (VTs) during high heart rates due to physical or psychological stress. The essential role of catecholaminergic effects on ventricular cardiomyocytes in this situation is well documented, but the importance of heart rate per se for arrhythmia initiation in CPVT1 is largely unexplored.

Methods and results: Sixteen CPVT1 patients performed a bicycle stress-test. Occurrence of VT triggers, i.e. premature ventricular complexes (PVC), depended on high heart rate, with individual thresholds. Atrial pacing above the individual PVC threshold in three patients did not induce PVCs. The underlying mechanism for the clinical observation was explored using cardiomyocytes from mice with the RyR2-R2474S (RyR2-RS) mutation, which exhibit exercise-induced VTs. While rapid pacing increased the number of Ca2+ waves in both RyR2-RS and wild-type (p<0.05), β-adrenoceptor (βAR) stimulation induced more Ca2+ waves in RyR2-RS (p<0.05). Notably, Ca2+ waves occurred despite decreased sarcoplasmic reticulum (SR) Ca2+ content in RyR2-RS (p<0.05), suggesting increased cytosolic RyR2 Ca2+ sensitivity. A computational model of mouse ventricular cardiomyocyte electrophysiology reproduced the cellular CPVT1 phenotype when RyR2 Ca2+ sensitivity was increased. Importantly, diastolic fluctuations in phosphorylation of RyR2 and SR Ca2+ content determined Ca2+ wave initiation. These factors were modulated towards increased propensity for arrhythmia initiation by increased pacing rates, but even more by βAR stimulation.

Conclusion: In CPVT1, VT propensity depends on individual heart rate thresholds for PVCs. Through converging data from clinical exercise stress-testing, cellular studies and computational modelling, we confirm the heart rate-independent pro-arrhythmic effects of βAR stimulation in CPVT1, but also identify an independent and synergistic contribution from effects of high heart rate.


Conflict of interest statement

The authors have declared that no competing interests exist.

Figures
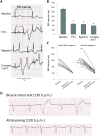
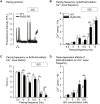
Fig 1
Fig 1. Bicycle stress testing showed the heart rate-dependence of arrhythmias in patients with CPVT1, while atrial pacing did not induce arrhythmias.
(A) ECG tracings from a patient with CPVT1 recorded during a bicycle stress test. RR-interval was measured before PVCs occurred. (B) Bar graphs of RR-intervals of sinus beats in stable sinus rhythm (baseline), and immediately before the occurrence of isolated PVCs, PVCs in bigeminy, and couplets or nsVT, respectively. Data from 31 bicycle stress tests performed by 16 patients with CPVT1. *p<0.05 compared to baseline with one-way ANOVA with Bonferroni correction. (C) Individual plots of RR-intervals of patients who developed arrhythmias during the stress test. RR-intervals at baseline and before the first arrhythmic event are shown, both in absence and in presence of βAR antagonists. (D) ECG tracings from a patient with CPVT1 recorded during a bicycle stress test (upper panel) with PVCs in bigeminy at 120 beat per minute (b.p.m.), and at rest during pacing through an atrial lead with no PVCs at 130 b.p.m. (lower panel).
Fig 2
Fig 2. High pacing frequency induced Ca2+ waves in RyR2-RS mouse left ventricular cardiomyocytes, but βAR stimulation was necessary to reveal increased propensity compared to WT.
(A) Tracings of whole-cell Ca2+ fluorescence showing Ca2+ transients and Ca2+ waves (arrow) during 0.5 Hz pacing by field stimulation in absence and presence of stimulation of βARs with ISO. (B) Bar graphs showing the mean frequency of Ca2+ waves in RyR2-RS and WT cardiomyocytes in a 10 s post-pacing period after 0.5, 4 and 8 Hz pacing in absence and presence of ISO, respectively. Analyzed by Nested ANOVA with data from 9 RyR2-RS and 8–15 WT mice per bar (29–55 cells per result). (C) Bar graphs showing the mean Ca2+ wave latency in RyR2-RS and WT cardiomyocytes after different pacing frequencies, in absence and presence of ISO. Analyzed by Nested ANOVA with data from 9–16 RyR2-RS and 10–21 WT mice per bar (28–70 cells per result). (D) Bar graph showing the mean frequency of Ca2+ waves in a 10 s period after 4 Hz pacing in 0, 2, 20 and 200 nM ISO. Analyzed by Nested ANOVA with data from 3–13 RyR2-RS and 3–18 WT mice (8–65 cells per result). *p<0.05 RyR2-RS vs WT, #p<0.05 vs 0.5 Hz in the same conditions (+/- ISO), $p<0.05 +ISO vs–ISO for the same genotype and frequency.
Fig 3
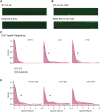
Fig 3. High pacing frequency induced Ca2+ sparks in RyR2-RS mouse left ventricular cardiomyocytes, but βARstimulation was necessary to reveal increased propensity compared to WT.
(A) Line scan confocal imaging in absence of stimulation of βARs with ISO after 0.5 Hz pacing in WT (upper panel) and RyR2-RS (lower panel). (B) Line scan confocal imaging in presence of ISO after 0.5 Hz pacing in WT (upper panel) and RyR2-RS (lower panel). (C) and (D) Density plots illustrating the distribution of number of cells with 0–5 Ca2+ sparks per 100 μm per second, occurring after 0.5, 4 and 8 Hz pacing in absence and presence of ISO, respectively. Higher density means more cells. The legend shows how different patterns represent WT or RyR2-RS, respectively. Results from Poisson analysis of data from 13 RyR2-RS mice (47 cells) and 15 WT mice (62 cells), *p<0.05.
Fig 4
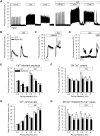
Fig 4. Ca2+ handling characteristics in RyR2-RS left ventricular cardiomyocytes indicated increased RyR open probability and lower threshold for diastolic Ca2+ release.
(A) A whole-cell Ca2+ fluorescence tracing showing the experimental protocol with 0.5, 4 and 8 Hz pacing at baseline and during βAR stimulation. (B) Tracings of whole-cell Ca2+ fluorescence showing Ca2+ transients during 0.5 Hz pacing in absence and presence of ISO. (C) Tracings of whole-cell Ca2+ fluorescence showing caffeine-elicited Ca2+ release after 0.5 Hz pacing. Peak fluorescence intensity was used for measurements of SR Ca2+ content. Caffeine was added immediately after the last stimulated Ca2+ transient. (D) Tracings of whole-cell Ca2+ fluorescence showing caffeine-elicited Ca2+ release at the time of occurrence of Ca2+ waves after 4 Hz stimulation. Caffeine was added immediately after the occurrence of a Ca2+ wave. This protocol was used for measurements of threshold SR Ca2+ content. Peak fluorescence intensity was used for measurements of SR Ca2+ content. (E) Bar graphs showing mean Ca2+ transient amplitude at different pacing frequencies in absence and presence of ISO. Analyzed by Nested ANOVA with data from 8–10 RyR2-RS mice and 7–19 WT mice per bar (29–58 cells per result). (F) Bar graphs showing mean SR Ca2+ content at different pacing frequencies in absence and presence of ISO. Analyzed by Nested ANOVA with data from 7–10 RyR2-RS mice and 4–11 WT mice per bar (20–26 cells per result). (G) Bar graphs showing mean decay rates of the Ca2+ transients at different pacing frequencies in absence and presence of ISO. Analyzed by Nested ANOVA with data from 8–9 RyR2-RS mice and 7–19 WT mice per bar (29–58 cells per result). (H) Bar graphs showing mean threshold SR Ca2+ content at different pacing frequencies in absence and presence of ISO. Analyzed by Nested ANOVA with data from 6–7 RyR2-RS mice and 3–5 WT mice per bar (8–20 cells per result), except 0.5 Hz, at which a meaningful threshold was not obtained since very few cells exhibit Ca2+ waves. For this frequency, bar graphs represent data from 2 mice (3 cells) in each group. *p<0.05 RyR2-RS vs WT.
Fig 5
Fig 5. Analysis of key phosphoproteins did not show any differences between RyR2-RS and WT.
Protein abundance was analyzed after 4 and 8 Hz pacing in absence and presence of ISO. (A) CaMKII phospho-threonine286 (pCaMKII), (B) RyR2 phospho-serine-2808 (pRyR2808), (C) RyR2 phospho-serine-2814 (pRyR 2814), (D) PLB phospho-serine 16 (pPLB-Ser16), (E) PLB phospho-threonine 17 (pPLB-Thr17), (F) SERCA2a. The graphs show mean protein abundance in 6 hearts from each group. Western blot results were normalized to WT (in the absence of ISO stimulation) at 4 and 8 Hz. *p<0.05, #p<0.05 vs. baseline in absence of ISO with Student`s T-test for unpaired data.
Fig 6
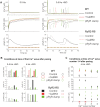
Fig 6. Computational modelling elucidated the interaction between pacing frequency and βAR stimulation in Ca2+ wave development.
(A) Modelled representation of whole-cell intracellular Ca2+ ([Ca2+]i) and SR Ca2+ content ([Ca2+]SR), as well as fluctuations in the level of RyR2 phosphorylation (pRyR) relative to a quiescent myocyte, in a 10 s period after pacing at 0.5 Hz in absence (left panel) and presence of ISO (right panel). Similar simulations were performed with 4 Hz pacing (not shown). The impact of CaMKII and phosphorylation of RyR2 was tested by omitting CaMKII from the model entirely (÷CaMKII), and by holding RyR2 phosphorylation to a set level found in quiescent cells in absence of ISO (RyR P-clamp). (B) SR Ca2+ content ([Ca2+]SR), level of RyR2 phosphorylation (pRyR), and abundance of autophosphorylated CaMKII (pCaMKII) at the time of occurrence of the first Ca2+ wave after 0.5 and 4 Hz pacing in absence and presence of ISO. Note that after 0.5 Hz in absence of ISO no Ca2+ waves occurred in WT. (C) SR Ca2+ content, level of RyR2 phosphorylation (RyR-P), and CaMKII activity at the time of the first and subsequent Ca2+ waves in a 10 s period after 4 Hz pacing.

References

    1. Lehnart SE, Wehrens XHT, Laitinen PiJ, Reiken SR, Deng SX, Cheng Z, et al. Sudden death in familial polymorphic ventricular tachycardia associated with calcium release channel (ryanodine receptor) leak. Circulation. 2004;109(25):3208–14. 10.1161/01.CIR.0000132472.98675.EC - DOI - PubMed
    1. Khoury A, Marai I, Suleiman M, Blich M, Lorber A, Gepstein L, et al. Flecainide therapy suppresses exercise-induced ventricular arrhythmias in patients with CASQ2-associated catecholaminergic polymorphic ventricular tachycardia. Heart Rhythm. 2013;10(11):1671–5. 10.1016/j.hrthm.2013.08.011 - DOI - PubMed
    1. Roses-Noguer F, Jarman JWE, Clague JR, Till J. Outcomes of defibrillator therapy in catecholaminergic polymorphic ventricular tachycardia. Heart Rhythm. 2014;11(1):58–66. 10.1016/j.hrthm.2013.10.027 - DOI - PubMed
    1. Watanabe H, Chopra N, Laver D, Hwang HS, Davies SS, Roach DE, et al. Flecainide prevents catecholaminergic polymorphic ventricular tachycardia in mice and humans. Nat Med. 2009;15(4):380–3. Epub 2009/03/31. 10.1038/nm.1942 - DOI - PMC - PubMed
    1. Priori SG, Napolitano C, Memmi M, Colombi B, Drago F, Gasparini M, et al. Clinical and molecular characterization of patients with catecholaminergic polymorphic ventricular tachycardia. Circulation. 2002;106(1):69–74. - PubMed

Publication types

MeSH terms