. 2018 Nov 6;13(11):e0207031.
doi: 10.1371/journal.pone.0207031. eCollection 2018.

Longitudinal analysis of developmental changes in electroencephalography patterns and sleep-wake states of the neonatal mouse

Affiliations

Longitudinal analysis of developmental changes in electroencephalography patterns and sleep-wake states of the neonatal mouse

Nicholas Rensing et al. PLoS One. .

Abstract

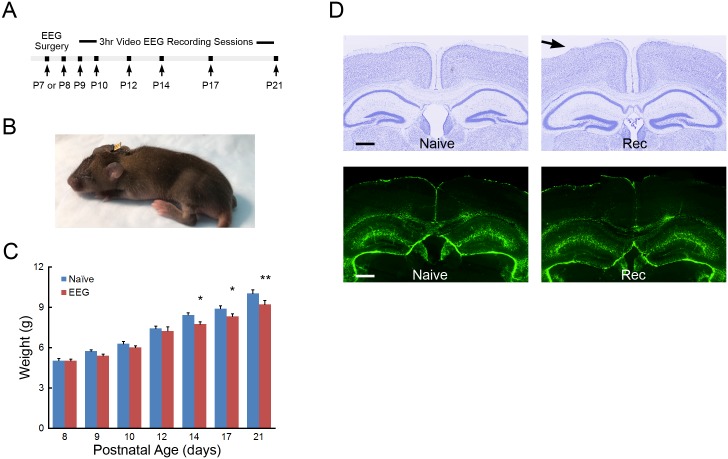
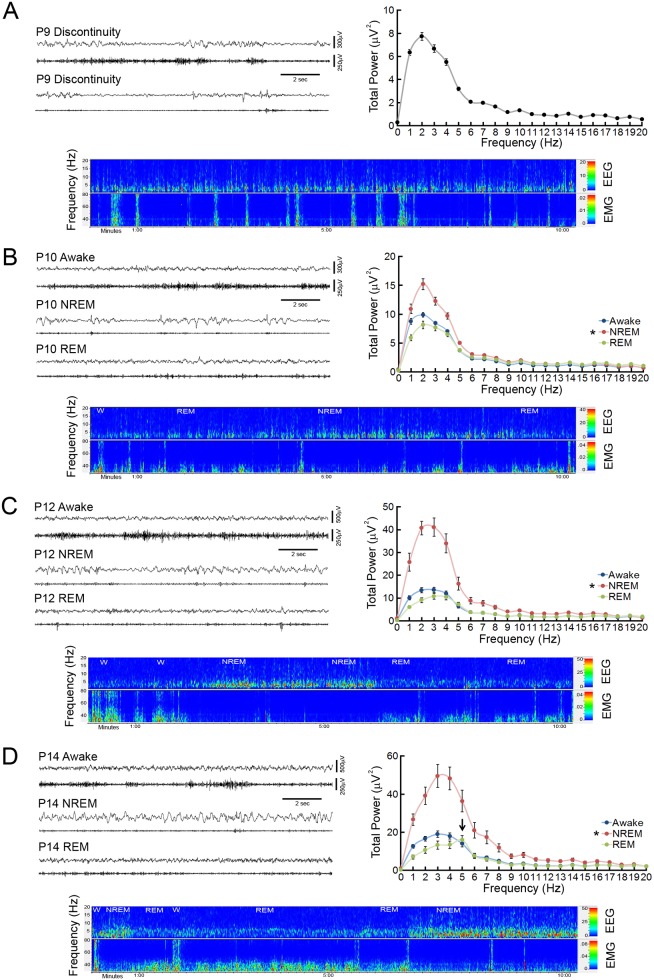
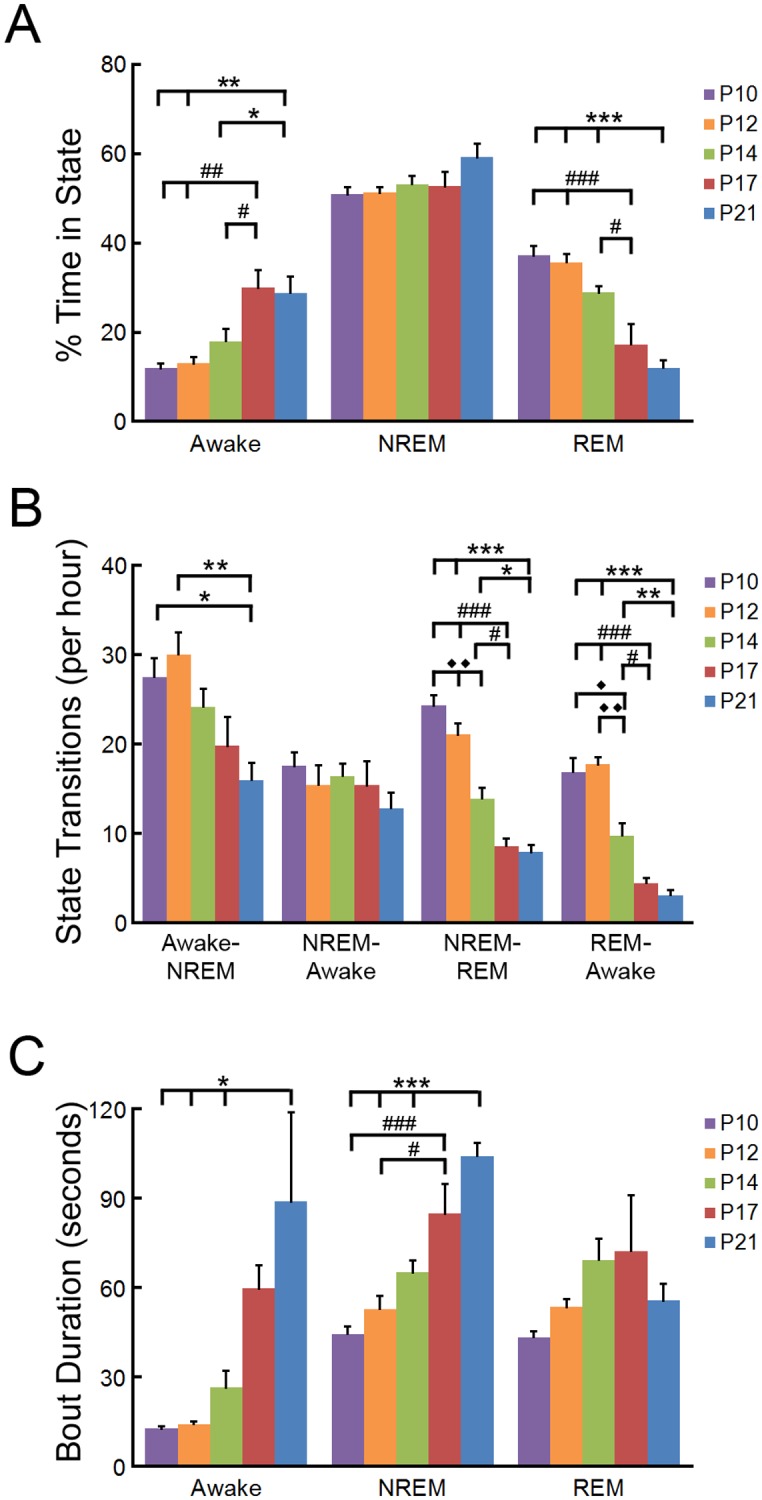
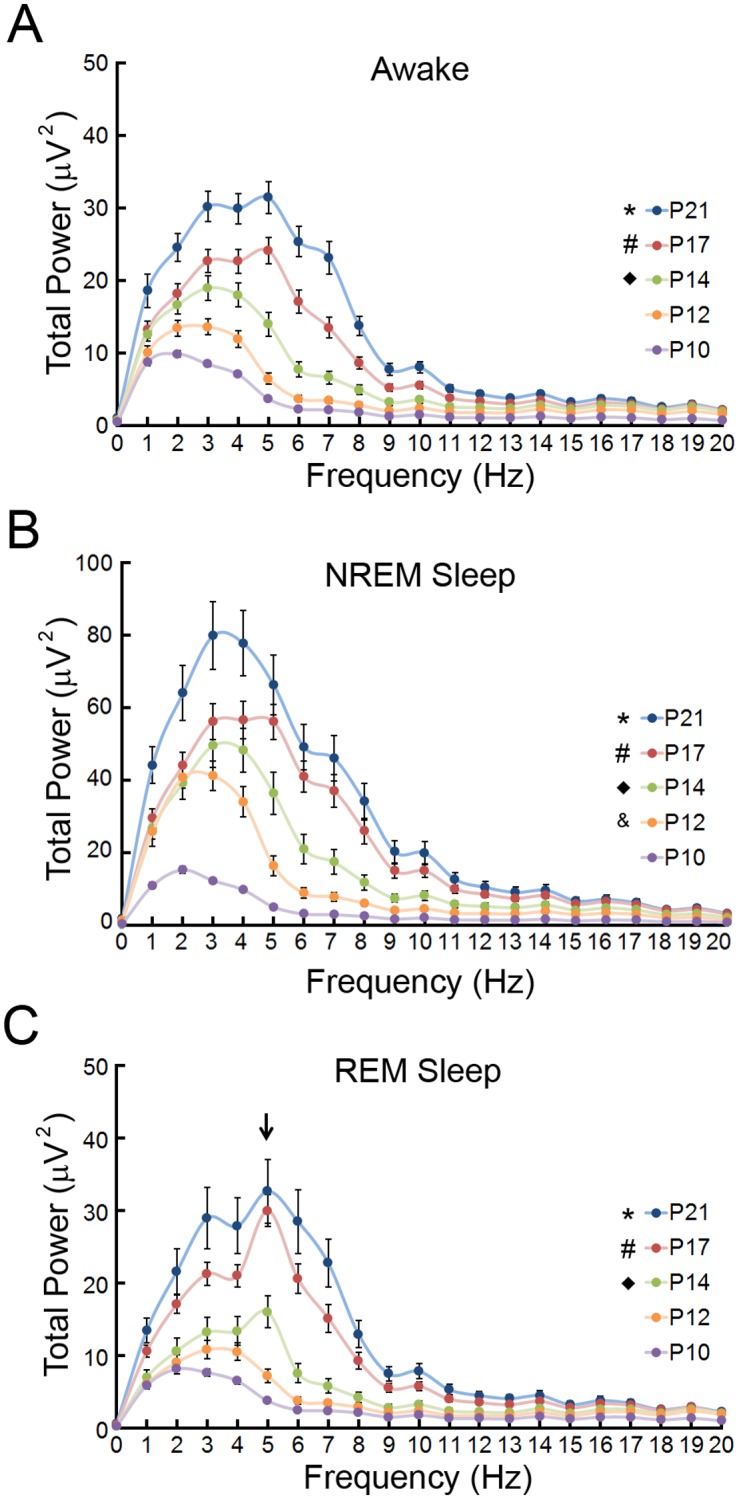
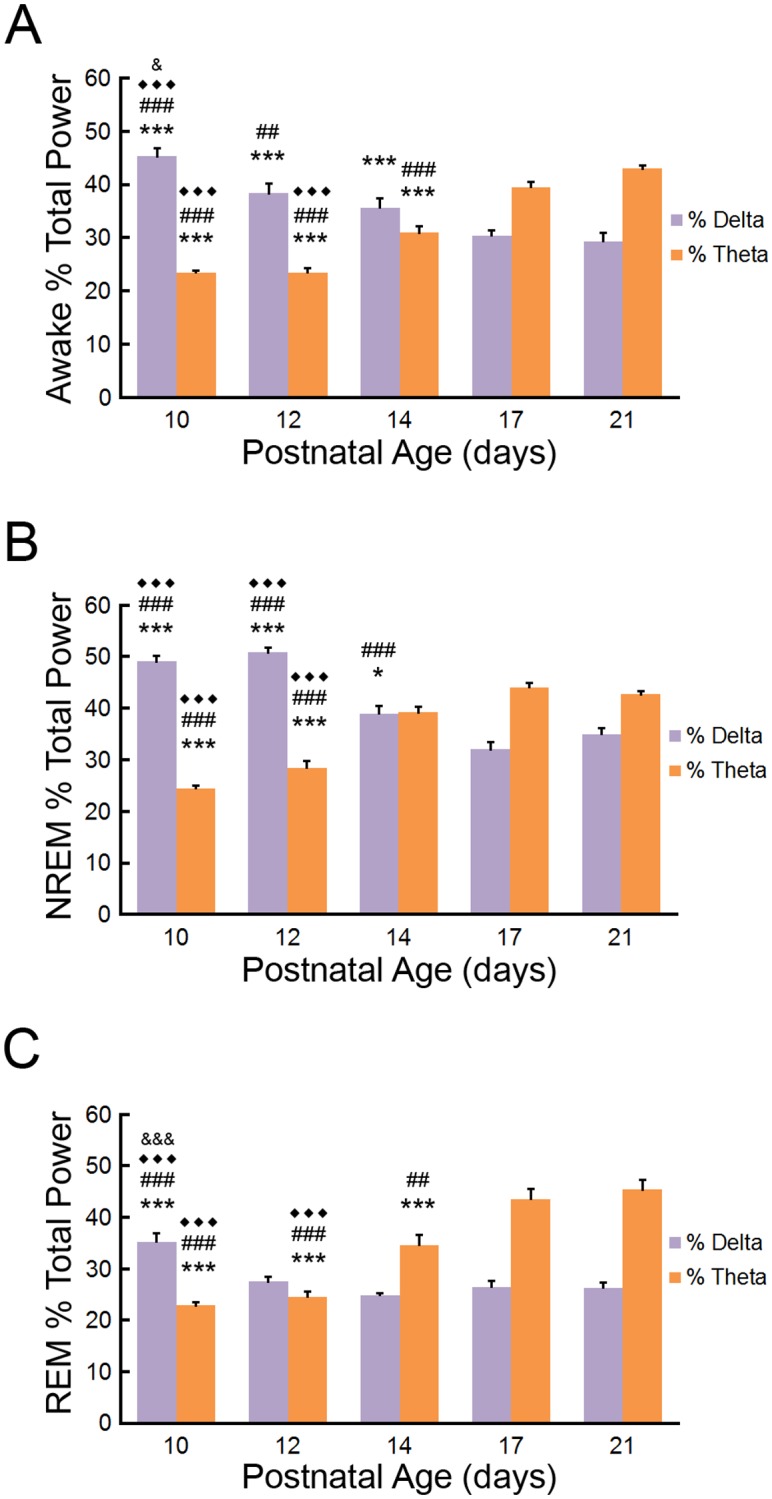
The neonatal brain undergoes rapid maturational changes that facilitate the normal development of the nervous system and also affect the pathological response to brain injury. Electroencephalography (EEG) and analysis of sleep-wake vigilance states provide important insights into the function of the normal and diseased immature brain. While developmental changes in EEG and vigilance states are well-described in people, less is known about the normal maturational properties of rodent EEG, including the emergence and evolution of sleep-awake vigilance states. In particular, a number of developmental EEG studies have been performed in rats, but there is limited comparable research in neonatal mice, especially as it pertains to longitudinal EEG studies performed within the same mouse. In this study, we have attempted to provide a relatively comprehensive assessment of developmental changes in EEG background activity and vigilance states in wild-type mice from postnatal days 9-21. A novel EEG and EMG method allowed serial recording from the same mouse pups. EEG continuity and power and vigilance states were analyzed by quantitative assessment and fast Fourier transforms. During this developmental period, we demonstrate the timing of maturational changes in EEG background continuity, frequencies, and power and the emergence of identifiable wake, NREM, and REM sleep states. These results should serve as important control data for physiological studies of mouse models of normal brain development and neurological disease.


Conflict of interest statement

The authors have declared that no competing interests exist.

Figures

Fig 1
Fig 1. Longitudinal EEG and EMG recordings in the neonatal mouse.
(A) Protocol summarizing the timing of the longitudinal recording sessions in individual mice. (B) After electrode placement surgery at P7 or P8, the attached electrode apparatus is of minimal size and the exposed pin header allows reversible connections for recording EEG and EMG while permitting pup feeding and group nesting. (C) Weight gain in operated and naïve mice. *p<0.05, P14 and P17, **p<0.01, P21 naïve compared to EEG recorded mice by two-way repeated measures ANOVA with Holm-Sidak posttest; n = 9–11 per age group. (D) Histological assessment of electrode placement and injury during EEG recording of the neonatal mouse. Top panels: Cresyl violet stained coronal sections display limited injury to underlying layer I/II cortex of naive or EEG recorded (Rec) mice caused by surgery or recoding paradigm. Bottom panels: GFAP analysis shows no signs of gliosis in the cortex or hippocampus of EEG recorded (Rec) neonatal mice compared to naïve (Naïve) controls; n = 8 Rec, n = 6 Naïve. Scale bar is 500μm.
Fig 2
Fig 2. Identification of vigilance states in the neonatal mouse.
(A) Representative 15 second EEG and nuchal EMG traces from a postnatal day 9 (P9) mouse exhibit a discontinuous EEG pattern during periods of high muscle tone (upper traces) and muscle atonia (lower traces). A ten minute EEG/EMG CDSA displays bursts of EEG activity separated by brief periods of suppressed EEG power and limited slow wave activity. Despite intermittent bursts of EMG activity, EEG shows no definite evidence of qualitative state changes. The P9 FFT displays the mean total power within the frequency for the entire recording period. (B) Representative P10 EEG and EMG traces display initial evidence of state change, with low amplitude, relatively continuous EEG activity and prominent EMG activity during the awake state, higher amplitude discontinuous bursts of prominent slow wave activity on EEG and decreased EMG activity during NREM, and low amplitude continuous EEG activity with suppressed EMG with intermittent myoclonic activity during REM sleep. The CDSA displays state differences in short, defined vigilance patterns with multiple sleep/wake cycles (W- Awake; NREM- NREM sleep; REM- REM sleep; not all vigilance epochs labeled) of a P10 neonatal mouse. The P10 power FFT displays a significant increase in power (1-7Hz) during NREM labeled epochs. *p<0.05, compared to awake/REM by ANOVA with Tukey; n = 8. (C) Representative P12 EEG, EMG, and CDSA traces display well-defined distinction between different vigilance state patterns, with limited discontinuity during NREM sleep. The P12 power FFT displays a two-fold increase in delta power (1-4Hz) with an increase in overall power (1-17Hz) during NREM sleep episodes. *p<0.05, compared to awake/REM by Kruskal-Wallis with Dunn’s; n = 9. (D) Representative P14 EEG, EMG and CDSA traces display clear vigilance state patterns. The P14 power FFT displays significant increase in delta power during NREM sleep and the development of a 5Hz peak during REM sleep epochs (arrow). *p <0.05, versus awake/REM by one-way ANOVA; n = 8.
Fig 3
Fig 3. Developmental changes in the percentage of time, number of transitions, and bout durations of vigilance states of the neonatal mouse.
(A) Percentage of recorded time spent in vigilance states of P10 through P21 mice. Older mice display a significant increase in wakefulness and decrease in REM sleep compared to P10, P12, and P14 neonates. p<0.001 compared to ***P21; ###P17, p <0.01 compared to **P21; ##P17, p<0.05 compared to *P21; #P17 by one-way repeated measures ANOVA with Tukey; n = 8–9 mice per group. (B) The number of vigilance state transitions of P10 through P21 mice. The number of vigilance state transitions into sleep and the number of REM transitions decrease in the developing mouse. p<0.001 compared to ***P21; ###P17, p <0.01 compared to **P21; ◆◆P17, p<0.05, compared to *P21; #P17; ◆P14 by one-way repeated measures ANOVA; n = 8–9 mice per group. (C) The bout duration of vigilance states of P10 through P21 mice. The bout duration of wakefulness and NREM sleep increases during development. p<0.001 compared to ***P21; ###P17, p<0.05 compared to *P21; #P17 by one-way repeated measures ANOVA with Tukey; n = 8–9 mice per group.
Fig 4
Fig 4. Developmental changes in total power FFT during different vigilance states of the neonatal mouse.
(A) During wakefulness, a significant increase in total power across frequencies occurs as the mouse ages. *p<0.05, P21 compared to P10 (0–20 Hz), P12 (0–13 Hz); #p<0.05 p17 compared to P10 (2–20 Hz) P12 (5–7 Hz); ◆p<0.05 P14 compared to P10 (3–6, 15–20 Hz) by Kruskal-Wallis with Dunn’s; n = 8–10. (B) During NREM sleep, a significant increase in delta power occurs at P12 and power across all frequencies increases as the mouse ages. *p<0.05, P21 compared to P10 (0–20 Hz), P12 (4–14 Hz); #p<0.05 p17 compared to P10 (0–20 Hz) P12 (6–7 Hz); ◆p<0.05 P14 compared to P10 (0-18Hz); &p<0.05 P12 compared to P10 (1–2 Hz) by Kruskal-Wallis with Dunn’s; n = 8–10 mice per group. (C) During REM sleep, a significant increase in theta power occurs at P14 and power across all frequencies increases as the mouse ages. *p<0.05, P21 compared to P10 (0–20 Hz); P12 (0–12 Hz); #p<0.05 p17 compared to P10 (0–19 Hz) P12(5–8 Hz); ◆p<0.05 P14 compared to P10 (5 Hz) by Kruskal-Wallis with Dunn’s; n = 8–10 mice per group.
Fig 5
Fig 5. Developmental changes in percentage of EEG total power within the delta and theta frequency ranges during vigilance states of the neonatal mouse.
(A) During wakefulness, percentage of delta (1-4Hz) in EEG decreases until P17 and percent theta (4–8.5Hz) increases starting at P14. p<0.001, compared to ***P21; ### P17; ◆◆◆ P14; p<0.01 compared to ## P17; p<0.05 compared to &P12 by one-way repeated measures ANOVA with Tukey; n = 8–9 mice per group. (B) During NREM sleep, percentage of delta power decreases until P17 and percentage of theta power increases at P14. p<0.001, compared to ***P21; ### P17; ◆◆◆ P14; p<0.05 compared to *P21 by one-way repeated measures ANOVA with Tukey; n = 8–9 mice per group. (C) During REM sleep, percentage of delta power levels decreases after P10 and percentage of theta power increases after P12. p<0.001, compared to ***P21; ### P17; ◆◆◆ P14; &&& P12; p<0.01 compared to ## P17 by one-way repeated measures ANOVA with Tukey; n = 8–9 mice per group.

References

    1. Britton JW, Frey LC, Hopp JL, Korb P, Koubeissi MZ, Lievens WE, et al. In: St. Louis EK, Frey LC, editors. Electroencephalography (EEG): An Introductory Text and Atlas of Normal and Abnormal Findings in Adults, Children, and Infants. Chicago: American Epilepsy Society Copyright (c)2016 by American Epilepsy Society; 2016. - PubMed
    1. Andre M, Lamblin MD, d’Allest AM, Curzi-Dascalova L, Moussalli-Salefranque F, SNT T, et al. Electroencephalography in premature and full-term infants. Developmental features and glossary. Neurophysiologie clinique = Clinical neurophysiology. 2010;40(2):59–124. Epub 2010/06/01. 10.1016/j.neucli.2010.02.002 . - DOI - PubMed
    1. Khazipov R, Luhmann HJ. Early patterns of electrical activity in the developing cerebral cortex of humans and rodents. Trends in neurosciences. 2006;29(7):414–8. Epub 2006/05/23. 10.1016/j.tins.2006.05.007 . - DOI - PubMed
    1. Kleitman N, Engelmann TG. Sleep characteristics of infants. Journal of applied physiology. 1953;6(5):269–82. Epub 1953/11/01. 10.1152/jappl.1953.6.5.269 . - DOI - PubMed
    1. Lamblin MD, Walls Esquivel E, Andre M. The electroencephalogram of the full-term newborn: review of normal features and hypoxic-ischemic encephalopathy patterns. Neurophysiologie clinique = Clinical neurophysiology. 2013;43(5–6):267–87. Epub 2013/12/10. 10.1016/j.neucli.2013.07.001 . - DOI - PubMed

Publication types