

The Role of Vitamin D Oral Supplementation in Insulin Resistance in Women with Polycystic Ovary Syndrome: A Systematic Review and Meta-Analysis of Randomized Controlled Trials
- PMID: 30400199
- PMCID: PMC6266903
- DOI: 10.3390/nu10111637
The Role of Vitamin D Oral Supplementation in Insulin Resistance in Women with Polycystic Ovary Syndrome: A Systematic Review and Meta-Analysis of Randomized Controlled Trials
Abstract
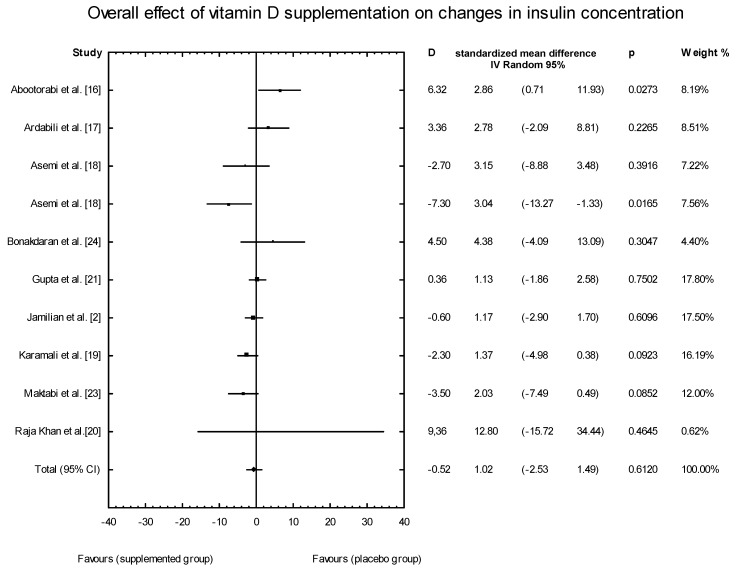
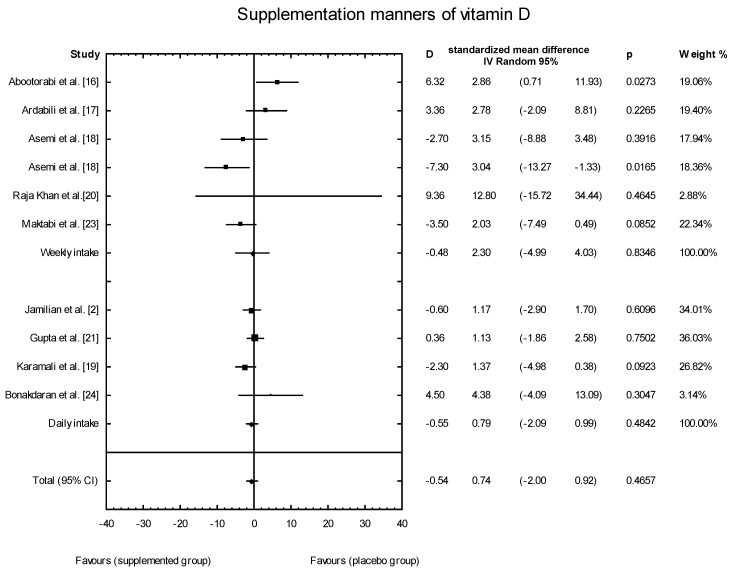
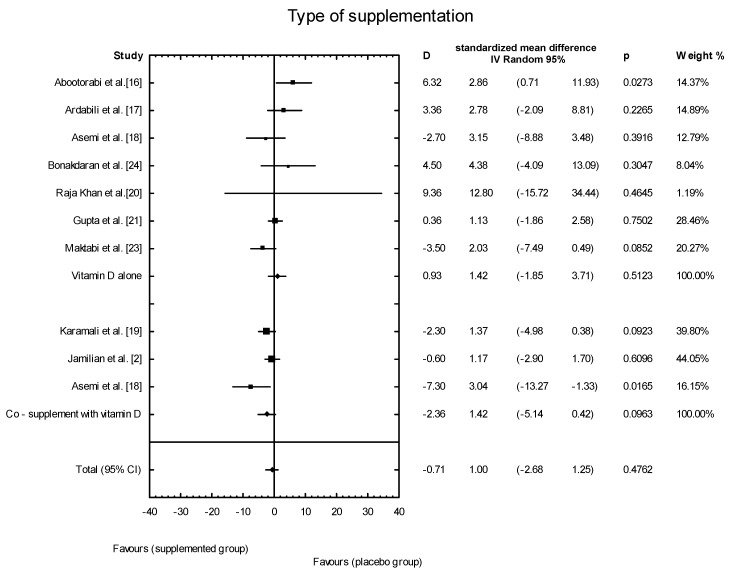
Objective: To evaluate the effect of vitamin D supplementation (alone or with co-supplementation) on insulin resistance in patients with polycystic ovary syndrome (PCOS).
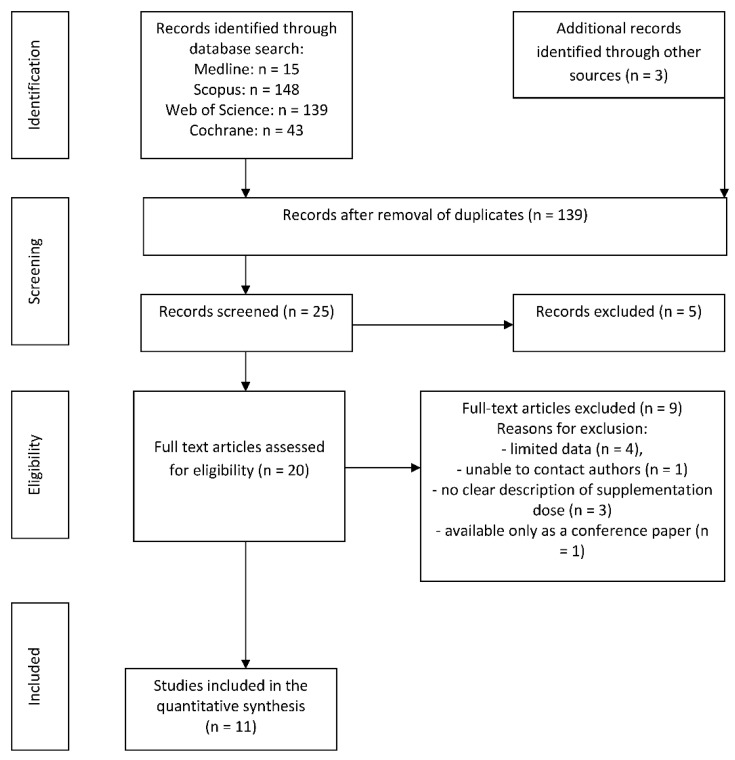
Methods: We performed a literature search of databases (Medline, Scopus, Web of Knowledge, Cochrane Library) and identified all reports of randomized controlled trials (RCTs) published prior to April 2018. We compared the effects of supplementation with vitamin D alone (dose from 1000 IU/d to 60,000 IU/week) or with co-supplements to the administration of placebos in women diagnosed with PCOS. The systematic review and meta-analysis protocol was registered in the International Prospective Register of Systematic Reviews (Prospero) as number CRD42018090572.
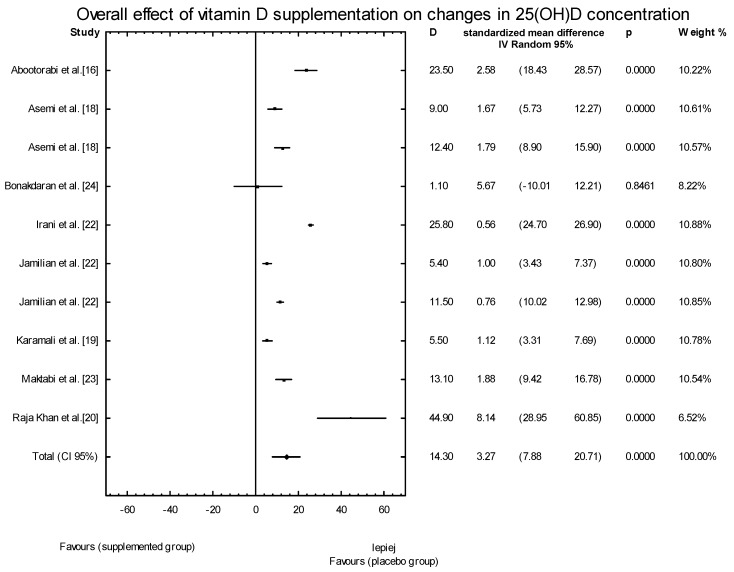
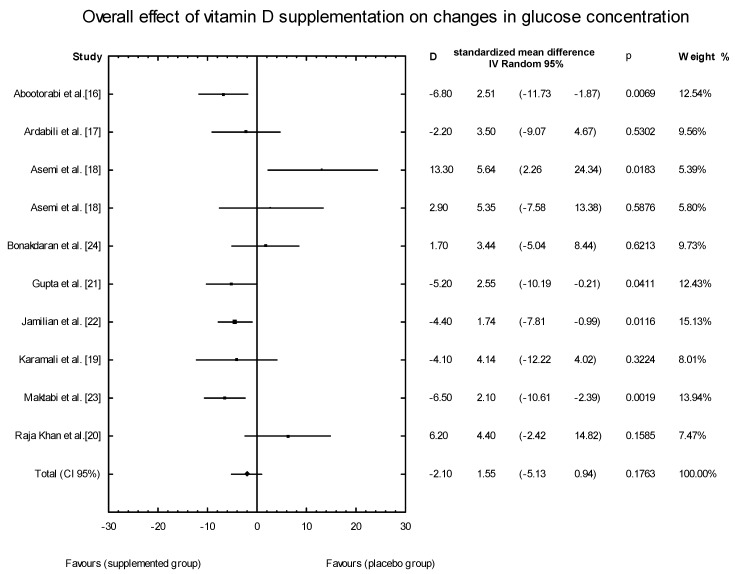
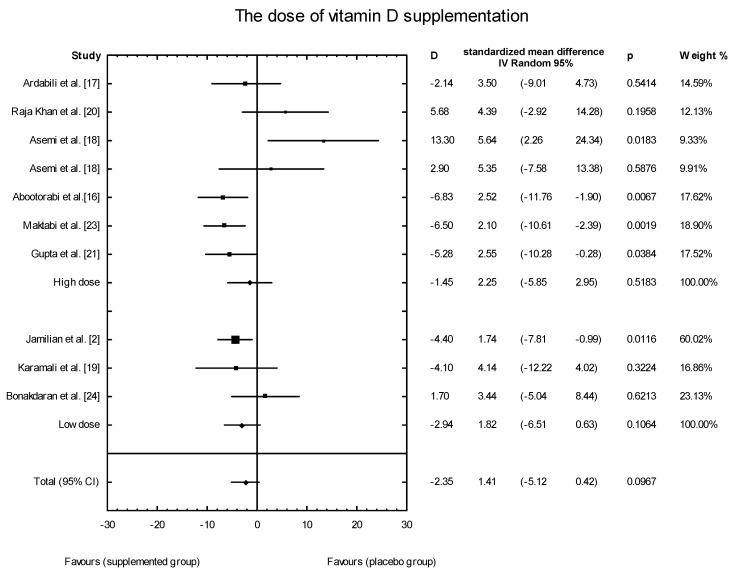
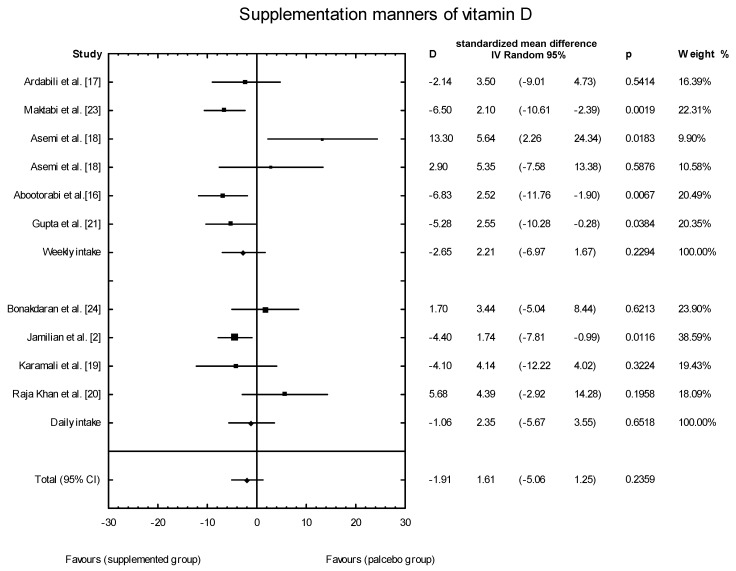
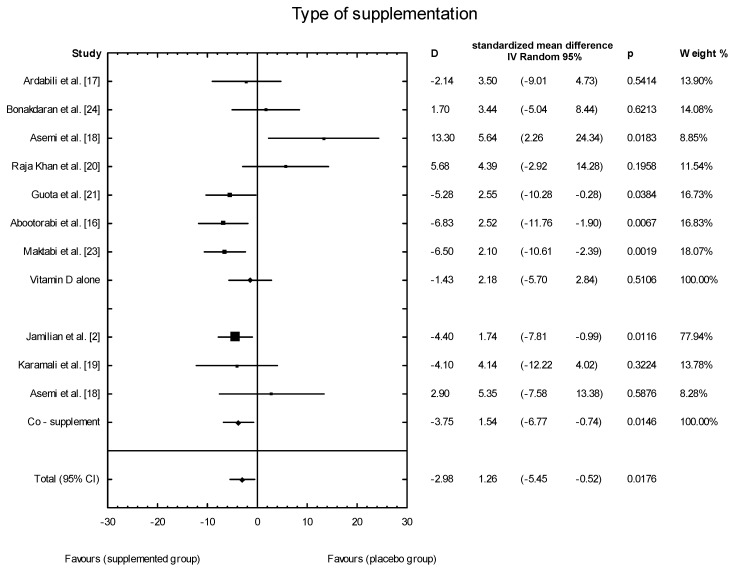
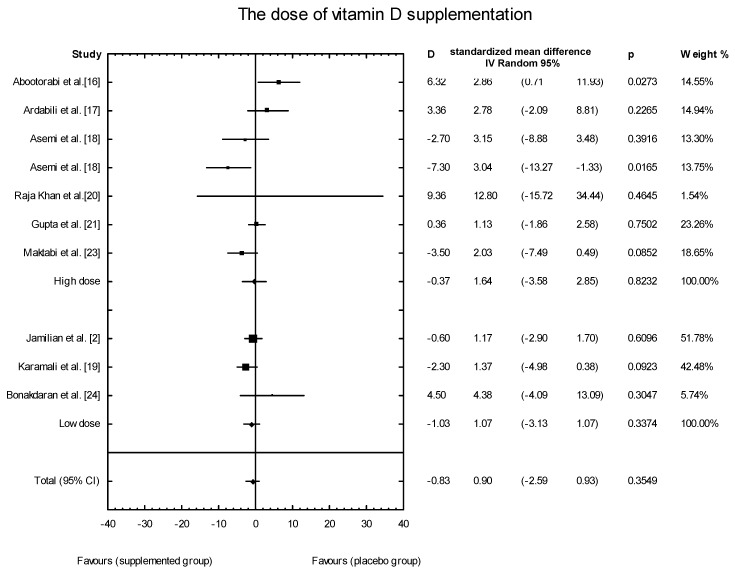
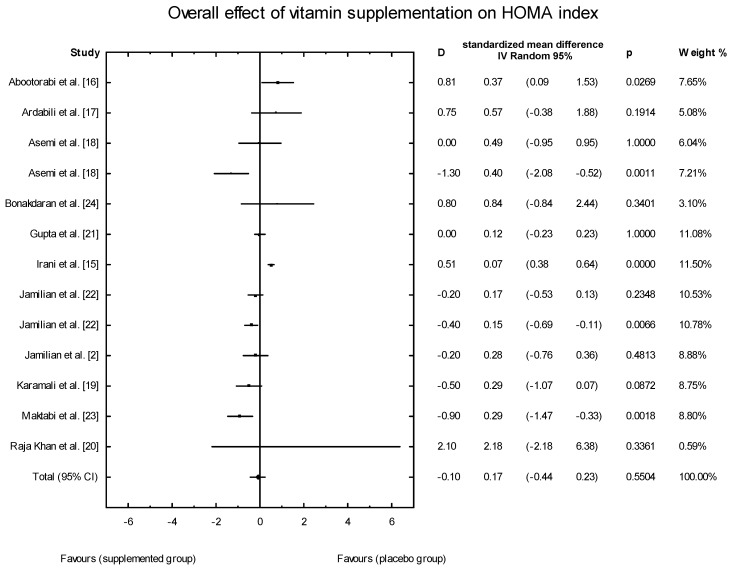
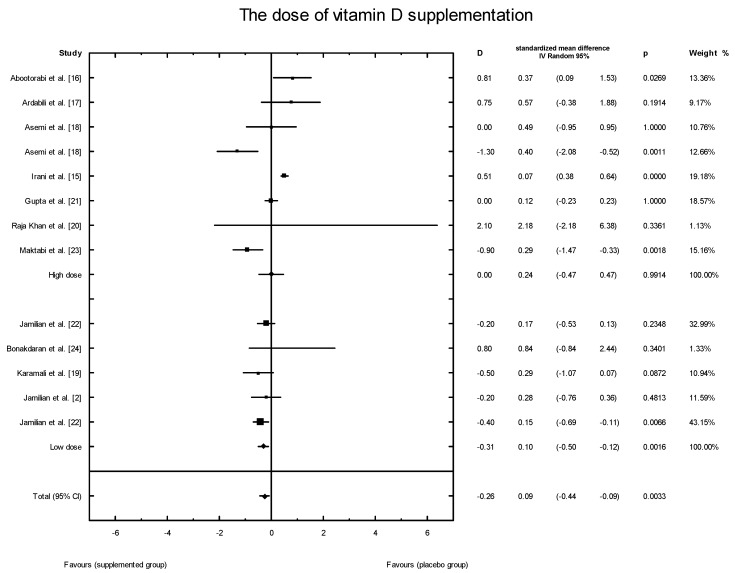
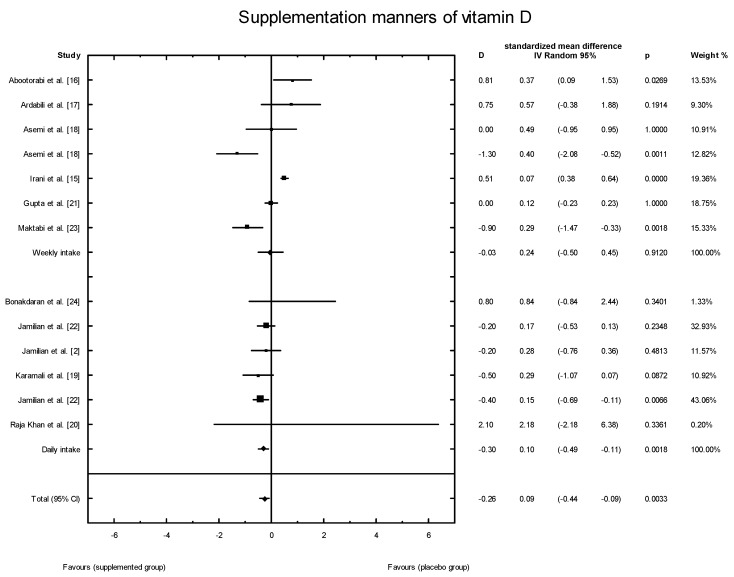
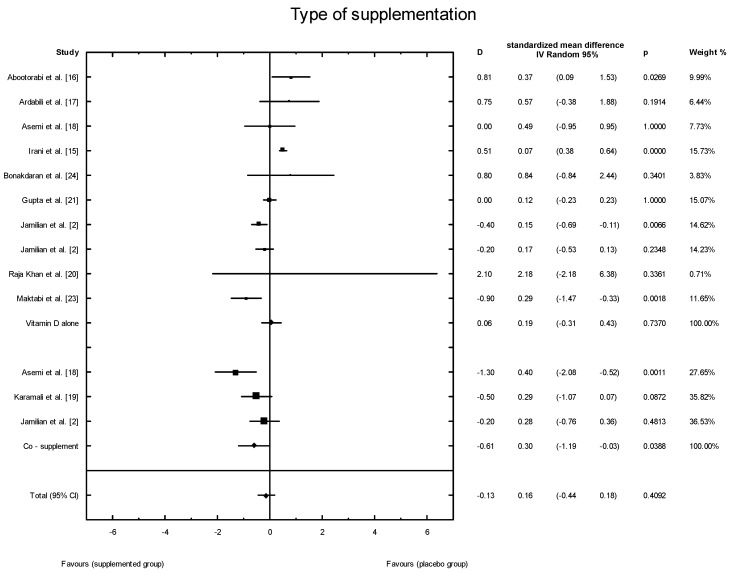
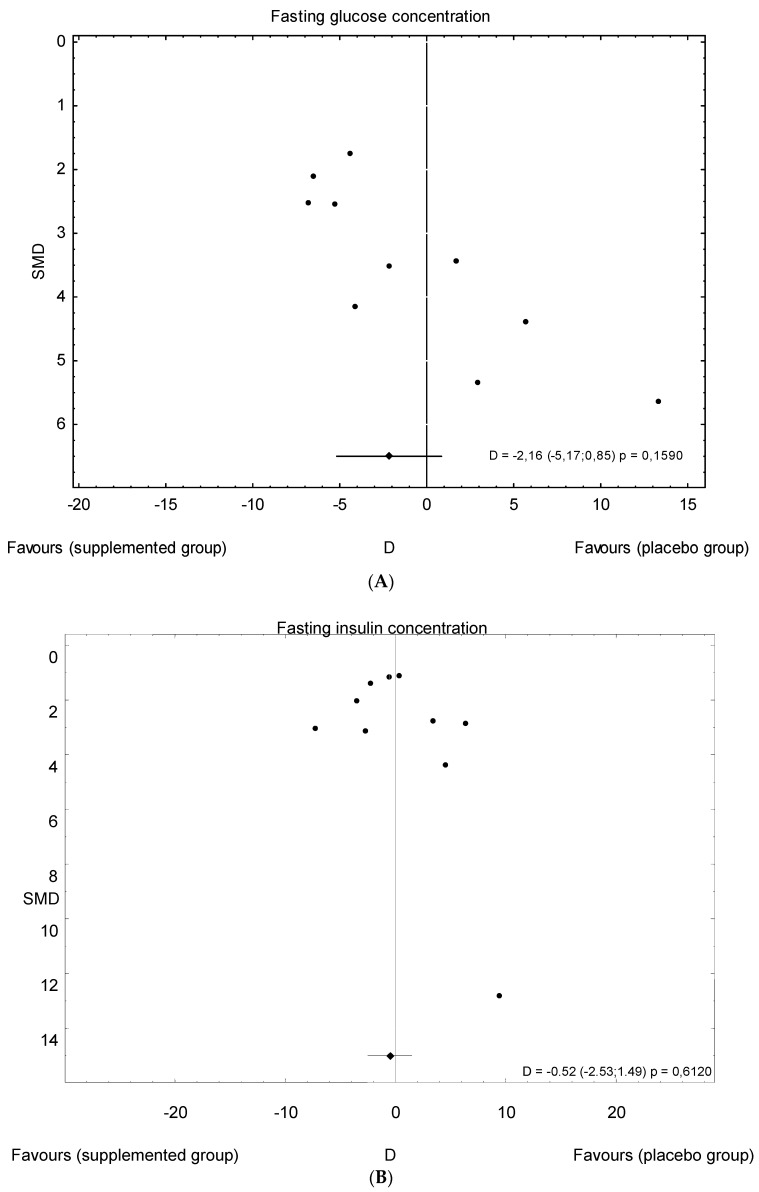
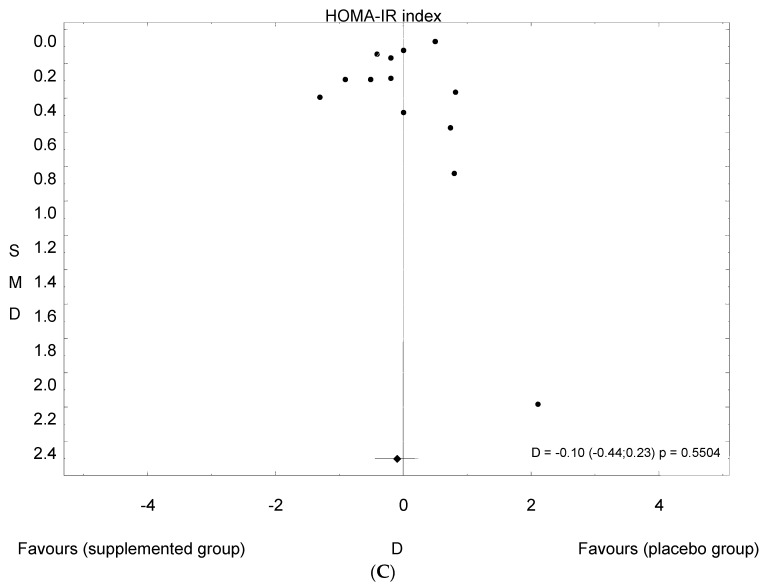
Main results: Eleven of 345 identified studies were included in the analysis; these involved 601women diagnosed with PCOS. Vitamin D as a co-supplement was found to significantly decrease fasting glucose concentrations and the HOMA-IR value. HOMA-IR also declined significantly when vitamin D was supplemented with a dose lower than 4000 IU/d.
Conclusions: Evidence from RCTs suggests that the supplementation of PCOS patients with continuous low doses of vitamin D (<4000 IU/d) or supplementation with vitamin D as a co-supplement may improve insulin sensitivity in terms of the fasting glucose concentration (supplementation with vitamin D in combination with other micronutrients) and HOMA-IR (supplementation with vitamin D in continuous low daily doses or as co-supplement).
Keywords: 25(OH)D; glucose; insulin resistant; polycystic ovary syndrome; vitamin D.
Conflict of interest statement
The authors declare no conflicts of interest.
Figures
Similar articles
-
The effect of vitamin D supplementation on markers of insulin resistance in women with polycystic ovarian syndrome: a systematic review.Eur J Nutr. 2024 Dec;63(8):2859-2869. doi: 10.1007/s00394-024-03489-6. Epub 2024 Sep 14. Eur J Nutr. 2024. PMID: 39276209 Free PMC article.
-
Effects of vitamin D supplementation on metabolic parameters of women with polycystic ovary syndrome: a meta-analysis of randomized controlled trials.Gynecol Endocrinol. 2021 May;37(5):446-455. doi: 10.1080/09513590.2020.1813272. Epub 2020 Sep 10. Gynecol Endocrinol. 2021. PMID: 32909865
-
Calcium plus vitamin D supplementation affects glucose metabolism and lipid concentrations in overweight and obese vitamin D deficient women with polycystic ovary syndrome.Clin Nutr. 2015 Aug;34(4):586-92. doi: 10.1016/j.clnu.2014.09.015. Epub 2014 Oct 3. Clin Nutr. 2015. PMID: 25300649 Clinical Trial.
-
Effects of vitamin D supplementation in women with polycystic ovary syndrome: a review.Gynecol Endocrinol. 2020 Jan;36(1):1-5. doi: 10.1080/09513590.2019.1625881. Epub 2019 Jun 12. Gynecol Endocrinol. 2020. PMID: 31187648 Review.
-
Effects of nutrition on metabolic and endocrine outcomes in women with polycystic ovary syndrome: an umbrella review of meta-analyses of randomized controlled trials.Nutr Rev. 2023 Apr 11;81(5):555-577. doi: 10.1093/nutrit/nuac075. Nutr Rev. 2023. PMID: 36099162
Cited by
-
Mechanisms Involved in the Relationship between Vitamin D and Insulin Resistance: Impact on Clinical Practice.Nutrients. 2021 Oct 1;13(10):3491. doi: 10.3390/nu13103491. Nutrients. 2021. PMID: 34684492 Free PMC article. Review.
-
The latest reports and treatment methods on polycystic ovary syndrome.Ann Med. 2024 Dec;56(1):2357737. doi: 10.1080/07853890.2024.2357737. Epub 2024 Jul 4. Ann Med. 2024. PMID: 38965663 Free PMC article. Review.
-
Vitamin D receptor and binding protein polymorphisms in women with polycystic ovary syndrome: a case control study.BMC Endocr Disord. 2019 Dec 23;19(1):145. doi: 10.1186/s12902-019-0477-x. BMC Endocr Disord. 2019. PMID: 31870342 Free PMC article.
-
Does vitamin D supplementation improve ovarian reserve in women with diminished ovarian reserve and vitamin D deficiency: a before-and-after intervention study.BMC Endocr Disord. 2021 Jun 21;21(1):126. doi: 10.1186/s12902-021-00786-7. BMC Endocr Disord. 2021. PMID: 34154571 Free PMC article.
-
The Association between Vitamin D and Anti-Müllerian Hormone: A Systematic Review and Meta-Analysis.Nutrients. 2020 May 28;12(6):1567. doi: 10.3390/nu12061567. Nutrients. 2020. PMID: 32481491 Free PMC article.
References
-
- Jamilian M., Maktabi M., Asemi Z. A trial on the effects of magnesium-zinc-calcium-vitamin d co-supplementation on glycemic control and markers of cardio-metabolic risk in women with polycystic ovary syndrome. Arch. Iran. Med. 2017;20:640–645. - PubMed
Publication types
MeSH terms
Substances
LinkOut - more resources
Full Text Sources
Medical
Miscellaneous
