Review
. 2018 Nov 2;19(11):3451.
doi: 10.3390/ijms19113451.

Transcriptional Landscape of PARs in Epithelial Malignancies

Affiliations
Review

Transcriptional Landscape of PARs in Epithelial Malignancies

Jeetendra Kumar Nag et al. Int J Mol Sci. .

Abstract

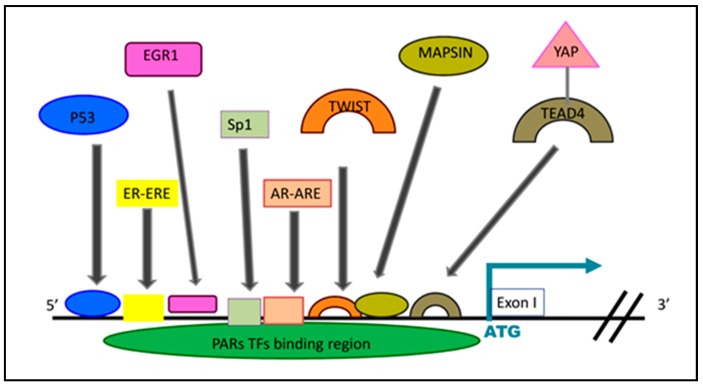
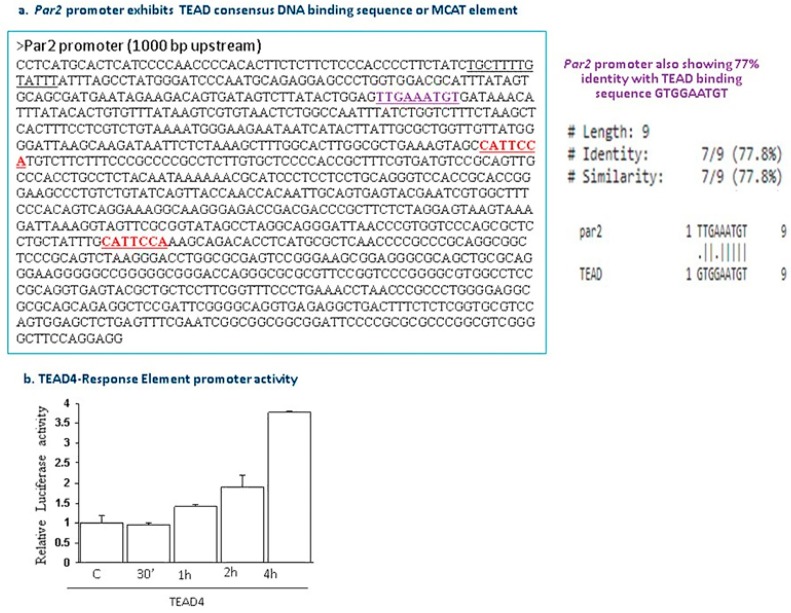
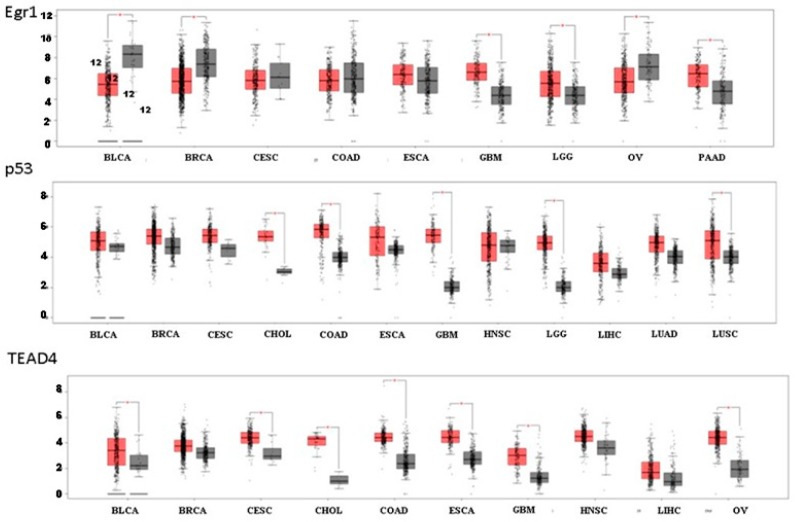
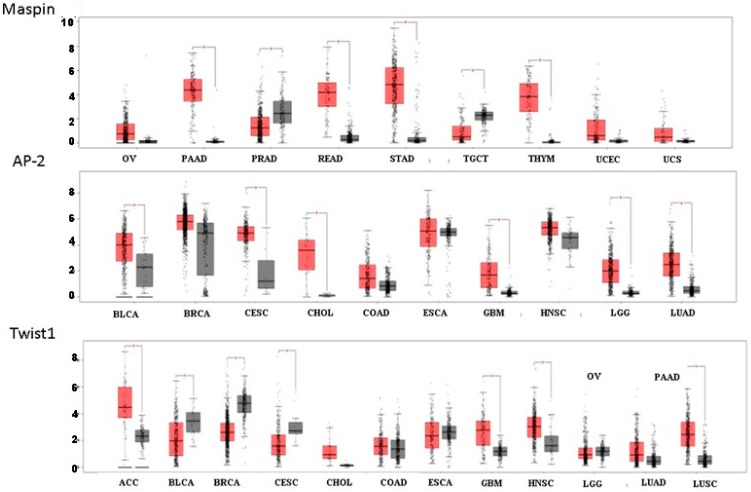
G protein-coupled receptors (GPCRs), the largest family of cell receptors, act as important regulators of diverse signaling pathways. Our understanding of the impact of GPCRs in tumors is emerging, yet there is no therapeutic platform based on GPCR driver genes. As cancer progresses, it disrupts normal epithelial organization and maintains the cells outside their normal niche. The dynamic and flexible microenvironment of a tumor contains both soluble and matrix-immobilized proteases that contribute to the process of cancer advancement. An example is the activation of cell surface protease-activated receptors (PARs). Mammalian PARs are a subgroup of GPCRs that form a family of four members, PAR1⁻4, which are uniquely activated by proteases found in the microenvironment. PAR₁ and PAR₂ play central roles in tumor biology, and PAR₃ acts as a coreceptor. The significance of PAR₄ in neoplasia is just beginning to emerge. PAR₁ has been shown to be overexpressed in malignant epithelia, in direct correlation with tumor aggressiveness, but there is no expression in normal epithelium. In this review, the involvement of key transcription factors such as Egr1, p53, Twist, AP2, and Sp1 that control PAR₁ expression levels specifically, as well as hormone transcriptional regulation by both estrogen receptors (ER) and androgen receptors (AR) are discussed. The cloning of the human protease-activated receptor 2; Par2 (hPar2) promoter region and transcriptional regulation of estrogen (E₂) via binding of the E₂⁻ER complex to estrogen response elements (ERE) are shown. In addition, evidence that TEA domain 4 (TEAD₄) motifs are present within the hPar2 promoter is presented since the YAP oncogene, which plays a central part in tumor etiology, acts via the TEAD₄ transcription factor. As of now, no information is available on regulation of the hPar3 promoter. With regard to hPar4, only data showing CpG methylation promoter regulation is available. Characterization of the PAR transcriptional landscape may identify powerful targets for cancer therapies.

Keywords: AP-2; ARE; EGR-1; ERE; PARs; Sp1; TEAD4; Twist; p53.


Conflict of interest statement

The authors declare no conflict of interest.

Figures

Figure 1
Figure 1
Schematic illustration of the PAR promoter region and allocated TF, focusing on PAR1 and PAR2 promoters with related TFs and putative TF motifs.
Figure 2
Figure 2
(a) Schematic presentation of the hPar2 promoter cloning and generation of deletion constructs. The hPar2 promoter was cloned into a pGL2- basic vector. Deleted constructs were generated using an application of appropriate restriction enzymes. The scheme illustrates the various fragments generated. (b) Schematic presentation of the hPar2 promoter and deleted constructs. Luciferase activity of hPar2 intact promoter and deleted constructs. (c) Consensus ER sequence. (d) Kinetics of E2- or Tam -treated MCF-7 cells. The indicated concentration of E2 (10−8 M and 10−9 M) were applied for various time periods, and the RT-PCR analysis was performed to determine levels of PAR2. While a marked enhancement in PAR2 level is seen by 2 h of 10−8 M treatment and remains till 24 h, no effect is seen by 2 h at 10−9 M. An elevated level of PAR2 at 10−9 M was observed after 6 h of treatment which remained elevated up to 24 h. Dose-response of TAM on the levels of PS2, which is a downstream gene target of tamoxifen (TAM). (e) Down-regulation of aib1 inhibited the effect of E2 and tamoxifen on hPar2 expression and proliferation. MCF-7 cells were stably infected with shRNA-aib1 and maintained for 48 h in phenol red-free medium supplemented with charcoal-stripped fetal bovine serum before either E2 or tamoxifen treatment. Then, the medium was changed to a serum-free medium with or without 10−8 M E2 or tamoxifen at 10−7, 10−6 M treatment. After two hours, RNA was isolated and RT-PCR analysis of hPar2 was performed. Sh-aib1 inhibited the effect of tamoxifen and E2 induced hPar2-LUC-promoter activity. MCF-7 shaib1 cells were transiently transfected with the hPar2-LUC reporter construct. After 48 h the cells were treated with 10−8 M E2 or 10−7 and 10−6 M tamoxifen for a period of two hours and Luc promoter activity was measured. No effect was observed after E2 and tamoxifen treatment. Luciferase activity was normalized to β-gal activity as a control for transfection efficiency. The mean ± standard deviation (SD) are shown (n = 6). (f) Recruitment of ER to the hPar2 promoter: ChIP analysis. (b) Chromatin fragments immunoprecipitated with the indicated antibodies were purified and the regions containing the ERE-proposed sites were amplified using PCR. An equal amount (input) of DNA was applied. PCR products generated by using either hPar2 promoter primers or GAPDH primers to amplify the immunoprecipitated DNA before and after E2 (10−8 M) and tamoxifen (10−6 M) treatment of MCF-7 are shown. GAPDH primers, control IgG, and a non-relevant (αFlt-1) antibody was used as controls for the evaluation of non-specific immunocomplex formation. Recruitment of ER and AIB1 to the PS2 promoter: ChIP analysis. MCF-7 cells were treated with 10−8 M E2, 10−6 M tamoxifen, or with the vehicle alone; chromatin was immunoprecipitated with antibodies against either ER or AIB1. The final DNA extracted were amplified using a primer set that covers functional EREs specific to pS2 promoter sequence. Primers specific to unrelated GAPDH gene sequence were used as a control. Input DNA that was amplified by PCR before immunoprecipitation. Control IgG was used as control for non-specific immunocomplex formation. (g) 5′-flanking sequences of hPar2 promoter and proposed ERE motifs are shown. EREs are highlighted, along with the sequences of the two sets of primers used.
Figure 2
Figure 2
(a) Schematic presentation of the hPar2 promoter cloning and generation of deletion constructs. The hPar2 promoter was cloned into a pGL2- basic vector. Deleted constructs were generated using an application of appropriate restriction enzymes. The scheme illustrates the various fragments generated. (b) Schematic presentation of the hPar2 promoter and deleted constructs. Luciferase activity of hPar2 intact promoter and deleted constructs. (c) Consensus ER sequence. (d) Kinetics of E2- or Tam -treated MCF-7 cells. The indicated concentration of E2 (10−8 M and 10−9 M) were applied for various time periods, and the RT-PCR analysis was performed to determine levels of PAR2. While a marked enhancement in PAR2 level is seen by 2 h of 10−8 M treatment and remains till 24 h, no effect is seen by 2 h at 10−9 M. An elevated level of PAR2 at 10−9 M was observed after 6 h of treatment which remained elevated up to 24 h. Dose-response of TAM on the levels of PS2, which is a downstream gene target of tamoxifen (TAM). (e) Down-regulation of aib1 inhibited the effect of E2 and tamoxifen on hPar2 expression and proliferation. MCF-7 cells were stably infected with shRNA-aib1 and maintained for 48 h in phenol red-free medium supplemented with charcoal-stripped fetal bovine serum before either E2 or tamoxifen treatment. Then, the medium was changed to a serum-free medium with or without 10−8 M E2 or tamoxifen at 10−7, 10−6 M treatment. After two hours, RNA was isolated and RT-PCR analysis of hPar2 was performed. Sh-aib1 inhibited the effect of tamoxifen and E2 induced hPar2-LUC-promoter activity. MCF-7 shaib1 cells were transiently transfected with the hPar2-LUC reporter construct. After 48 h the cells were treated with 10−8 M E2 or 10−7 and 10−6 M tamoxifen for a period of two hours and Luc promoter activity was measured. No effect was observed after E2 and tamoxifen treatment. Luciferase activity was normalized to β-gal activity as a control for transfection efficiency. The mean ± standard deviation (SD) are shown (n = 6). (f) Recruitment of ER to the hPar2 promoter: ChIP analysis. (b) Chromatin fragments immunoprecipitated with the indicated antibodies were purified and the regions containing the ERE-proposed sites were amplified using PCR. An equal amount (input) of DNA was applied. PCR products generated by using either hPar2 promoter primers or GAPDH primers to amplify the immunoprecipitated DNA before and after E2 (10−8 M) and tamoxifen (10−6 M) treatment of MCF-7 are shown. GAPDH primers, control IgG, and a non-relevant (αFlt-1) antibody was used as controls for the evaluation of non-specific immunocomplex formation. Recruitment of ER and AIB1 to the PS2 promoter: ChIP analysis. MCF-7 cells were treated with 10−8 M E2, 10−6 M tamoxifen, or with the vehicle alone; chromatin was immunoprecipitated with antibodies against either ER or AIB1. The final DNA extracted were amplified using a primer set that covers functional EREs specific to pS2 promoter sequence. Primers specific to unrelated GAPDH gene sequence were used as a control. Input DNA that was amplified by PCR before immunoprecipitation. Control IgG was used as control for non-specific immunocomplex formation. (g) 5′-flanking sequences of hPar2 promoter and proposed ERE motifs are shown. EREs are highlighted, along with the sequences of the two sets of primers used.
Figure 3
Figure 3
TEAD4 consensus sequence in hPar2 promoter. (a) 5′-flanking sequence of hPar2 promoter and proposed TEAD4 binding motifs. CATTCCA is the consensus binding motif which is called also M-CAT (M for myfkins family of muscle specific helix-loop-helix family of proteins, followed by the sequence CAT). TTGAAATGT is another sequence found within the promoter of hPar2 for TEAD binding with 77% homology to GTGGAATGT TEAD binding site. (b) TEAD4-LUC promoter activity following SLIGKV activation of PAR2.
Figure 4
Figure 4
RNA-Seq demonstrating levels of Egr-1, p53, and TEAD4 in different types of epithelial cancers versus healthy individuals using GEPIA analysis. Red box indicates cancer patients and grey box healthy individuals.
Figure 5
Figure 5
RNA-Seq demonstrating levels of Maspin, AP-2, and Twist1 in different types of epithelial cancers versus healthy individuals using GEPIA analysis. Red box indicates cancer patients and grey box healthy individuals.

Similar articles

Cited by

References

    1. Dorsam R.T., Gutkind J.S. G-protein-coupled receptors and cancer. Nat. Rev. Cancer. 2007;7:79–94. doi: 10.1038/nrc2069. - DOI - PubMed
    1. Lappano R., Maggiolini M. G protein-coupled receptors: Novel targets for drug discovery in cancer. Nat. Rev. Drug Discov. 2011;10:47–60. doi: 10.1038/nrd3320. - DOI - PubMed
    1. Feigin M.E. Harnessing the genome for characterization of G-protein coupled receptors in cancer pathogenesis. FEBS J. 2013;280:4729–4738. doi: 10.1111/febs.12473. - DOI - PMC - PubMed
    1. Bar-Shavit R., Turm H., Salah Z., Maoz M., Cohen I., Weiss E., Uziely B., Grisaru-Granovsky S. PAR1 plays a role in epithelial malignancies: Transcriptional regulation and novel signaling pathway. IUBMB Life. 2011;63:397–402. doi: 10.1002/iub.452. - DOI - PubMed
    1. Booden M.A., Eckert L.B., Der C.J., Trejo J. Persistent signaling by dysregulated thrombin receptor trafficking promotes breast carcinoma cell invasion. Mol. Cell. Biol. 2004;24:1990–1999. doi: 10.1128/MCB.24.5.1990-1999.2004. - DOI - PMC - PubMed

Substances