. 2017 Jul 1;8(7):209.
doi: 10.3390/mi8070209.

Analysis of the Diffusion Process by pH Indicator in Microfluidic Chips for Liposome Production

Affiliations

Analysis of the Diffusion Process by pH Indicator in Microfluidic Chips for Liposome Production

Elisabetta Bottaro et al. Micromachines (Basel). .

Abstract

In recent years, the development of nano- and micro-particles has attracted considerable interest from researchers and enterprises, because of the potential utility of such particles as drug delivery vehicles. Amongst the different techniques employed for the production of nanoparticles, microfluidic-based methods have proven to be the most effective for controlling particle size and dispersity, and for achieving high encapsulation efficiency of bioactive compounds. In this study, we specifically focus on the production of liposomes, spherical vesicles formed by a lipid bilayer encapsulating an aqueous core. The formation of liposomes in microfluidic devices is often governed by diffusive mass transfer of chemical species at the liquid interface between a solvent (i.e., alcohol) and a non-solvent (i.e., water). In this work, we developed a new approach for the analysis of mixing processes within microfluidic devices. The method relies on the use of a pH indicator, and we demonstrate its utility by characterizing the transfer of ethanol and water within two different microfluidic architectures. Our approach represents an effective route to experimentally characterize diffusion and advection processes governing the formation of vesicular/micellar systems in microfluidics, and can also be employed to validate the results of numerical modelling.

Keywords: diffusion; liposomes; microfluidic; microfluidic hydrodynamic focusing; mixing; pH indicator.


Conflict of interest statement

The authors declare no conflict of interest.

Figures
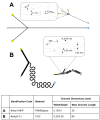
Figure 1
Figure 1
Schematic showing the geometry of the microfluidic chips employed in the present study. (A) #chip1-MHF was characterized by a cross flow geometry; while (B) #chip2-YJ was characterized by a “Y” shape geometry. The constitutive materials of the chips and the dimensions of the main channel (i.e., located after the junction between the inlet channels) are also reported.
Figure 2
Figure 2
Dimensional characteristics of liposomes produced by microfluidics: Z-average (A) and dispersity (B). Liposomes were prepared by #chip1-MHF (filled circles) or #chip2-YJ (open circles). Experimental conditions and lipid composition are described in the methods section. Data represent the average of 3 batches, measured in triplicate ± SD; Cryo-TEM images of liposomes produced using #chip1-MHF (C) and #chip2-YJ (D) are reported, for a FRR of 10 and TFR of 37.5 µL/min.
Figure 3
Figure 3
Change in chemical structure and color of bromoxylenol blue (BB) as a function of pH. The color shifts from yellow (at pH < 6) to blue (at pH >7.6).
Figure 4
Figure 4
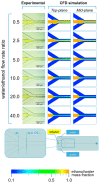
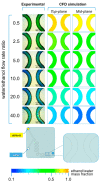
Experimental and computational fluid dynamic (CFD) analysis of the effect of FRR on the shape of the focused stream, in #chip1-MHF. The images illustrate the experimental microscopic observations (left column) and the CFD simulations (mid and right columns) of the focusing region, at the channels’ intersection; The images were employed to determine the focused stream width at 0.175 mm from the inlet channel, as indicated in the schematic at the bottom; The numerical contours of ethanol mass fraction are reported at both the mid-plane (mid column) and top-plane (right column) of the device. Experiments and simulations were conducted at TFR of 37.50 µL/min, and at varying FRRs.
Figure 5
Figure 5
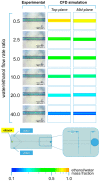
Experimental and computational fluid dynamic (CFD) analysis of the effect of FRR on diffusion and focused stream width, in #chip1-MHF. The images illustrate the experimental microscopic observations (left column) and the CFD simulations (mid and right columns) of the focusing region, at the channels’ intersection; The images were employed to determine the focused stream width at 10 mm from the outlet, as indicated in the schematic at the bottom; The numerical contours of ethanol mass fraction are reported at both the mid-plane (mid column) and top-plane (right column) of the device. Experiments and simulations were conducted at TFR of 37.50 µL/min, and at varying FRRs.
Figure 6
Figure 6
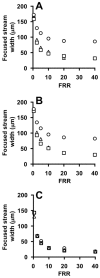
Effect of FFR on the focused stream width at different TFRs, measured from experiments (A,B) and simulations (C) using #chip1-MHF. TFR was set to 18.75 (circles), 37.50 (squares) and 75.00 (triangles) µL/min. Experiments were carried out in the absence (A) or in the presence of liposome forming lipids (B). Data represent the average of 3 measurements ± SD (the maximum standard deviation is equal to 0.9).
Figure 7
Figure 7
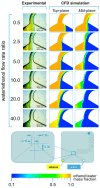
Experimental and computational fluid dynamic (CFD) analysis of the effect of microfluidic parameters on diffusion, diffusion layer width and water/ethanol interface position, in #chip2-YJ. The images illustrate the experimental microscopic observations (left column) and the CFD simulations (mid and right columns) of the “Y” junction region, at the channels’ intersection; The images were employed to determine the width of the diffusion layer (i.e., the green region) and the water/ethanol interface position, as indicated in the schematic at the bottom; The numerical contours of ethanol mass fraction are reported at both the mid-plane (mid column) and top-plane (right column) of the device. Experiments and simulations were conducted at TFR of 37.50 µL/min, and at varying FRRs.
Figure 8
Figure 8
Experimental and computational fluid dynamic (CFD) analysis of the effect of microfluidic parameters on diffusion, diffusion layer width and water/ethanol interface position, in #chip2-YJ. The images illustrate the experimental microscopic observations (left column) and the CFD simulations (mid and right columns) in a region located at the end of the serpentine geometry; The images were employed to determine the width of the diffusion layer (i.e., the green region) and the water/ethanol interface position, as indicated in the schematic at the bottom; The numerical contours of ethanol mass fraction are reported at both the mid-plane (mid column) and top-plane (right column) of the device. Experiments and simulations were conducted at TFR of 37.50 µL/min, and at varying FRRs.
Figure 9
Figure 9
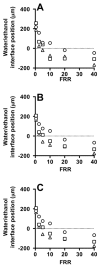
Effect of FFR on the water/ethanol interface position at different TFRs, measured from experiments (A,B) and simulations (C) using #chip2-YJ. TFR was set to 18.75 (circles), 37.50 (squares) and 75.00 (triangles) µL/min. Experiments were carried out in the absence (A) and in the presence of liposome forming lipids (B). Data represent the average of 3 measurements ± SD (the maximum standard deviation is equal to 0.5).

References

    1. Valencia P.M., Farokhzad O.C., Karnik R., Langer R. Microfluidic technologies for accelerating the clinical translation of nanoparticles. Nat. Nanotechnol. 2012;7:623–629. doi: 10.1038/nnano.2012.168. - DOI - PMC - PubMed
    1. Soema P.C., Willems G., Jiskoot W., Amorij J., Kersten G.F. European journal of pharmaceutics and biopharmacutics predicting the influence of liposomal lipid composition on liposome size, zeta potential and liposome-induced dendritic cell maturation using a design of experiments approach. Eur. J. Pharm. Biopharm. 2015;94:427–435. doi: 10.1016/j.ejpb.2015.06.026. - DOI - PubMed
    1. Akbarzadeh A., Rezaei-Sadabady R., Davaran S., Joo S.W., Zarghami N., Hanifehpour Y., Samiei M., Kouhi M., Nejati-Koshki K. Liposome: Classification, preparation, and applications. Nanoscale Res. Lett. 2013;8:102. doi: 10.1186/1556-276X-8-102. - DOI - PMC - PubMed
    1. Walde P. Preparation of Vesicles (Liposomes) Volume 9 American Scientific Publishers; Valencia, CA, USA: 2004.
    1. Sackmann E.K., Fulton A.L., Beebe D.J. The present and future role of microfluidics in biomedical research. Nature. 2014;507:181–189. doi: 10.1038/nature13118. - DOI - PubMed

LinkOut - more resources