. 2017 Sep 27;8(10):290.
doi: 10.3390/mi8100290.

Acoustic Manipulation of Bio-Particles at High Frequencies: An Analytical and Simulation Approach

Affiliations

Acoustic Manipulation of Bio-Particles at High Frequencies: An Analytical and Simulation Approach

Mohamadmahdi Samandari et al. Micromachines (Basel). .

Abstract

Manipulation of micro and nano particles in microfluidic devices with high resolution is a challenge especially in bioengineering applications where bio-particles (BPs) are separated or patterned. While acoustic forces have been used to control the position of BPs, its theoretical aspects need further investigation particularly for high-resolution manipulation where the wavelength and particle size are comparable. In this study, we used a finite element method (FEM) to amend analytical calculations of acoustic radiation force (ARF) arising from an imposed standing ultrasound field. First, an acoustic solid interaction (ASI) approach was implemented to calculate the ARF exerted on BPs and resultant deformation induced to them. The results were then used to derive a revised expression for the ARF beyond the small particle assumption. The expression was further assessed in numerical simulations of one- and multi-directional standing acoustic waves (SAWs). Furthermore, a particle tracing scheme was used to investigate the effect of actual ARF on separation and patterning applications under experimentally-relevant conditions. The results demonstrated a significant mismatch between the actual force and previous analytical predictions especially for high frequencies of manipulation. This deviation found to be not only because of the shifted ARF values but also due to the variation in force maps in multidirectional wave propagation. Findings of this work can tackle the simulation limitations for spatiotemporal control of BPs using a high resolution acoustic actuation.

Keywords: acoustic radiation force (ARF); bio-particle; microfluidics; standing acoustic waves (SAW).


Conflict of interest statement

The authors declare no potential conflicts of interest.

Figures
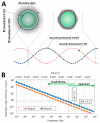
Figure 1
Figure 1
Harmonic behavior of a typical bio-particle (BP) in standing acoustic field with different applied frequencies. (A) Sketches of the BP under low (left) and high (right) frequency actuations; (B) The validity range of small particle and ideal fluid assumptions for a typical BP. In low frequencies, thermal and viscous boundary layer thicknesses (δt and δv, respectively) are comparable to the BP size, therefore the fluid cannot be considered with ideal theory (see Equations (S1) and(S2)). In addition, for wavelengths much larger than particle size (i.e., ka1, in which k is the wave number), the BP boundary experiences either negative or positive pressure. At higher frequencies, boundary layers are thinner. On the other hand, a complex deformation and harmonic behavior are experienced by the BP given the fact that different points of the BP boundary experience different pressure values. Therefore, the BP size cannot be neglected for higher frequencies. The values are calculated based on the parameters presented in Section 2.3.
Figure 2
Figure 2
Mesh dependency analysis and convergence of finite element model (FEM) results. (A) Computational mesh structure for the acoustic solid interaction (ASI) model. An appropriate mesh size is selected based on the acoustic wavelength to comply with the gradients of deformation (color map inside solid domain) and acoustic pressure fields (gray-scale map of acoustic domain); (B,C) Convergence analysis of the ARF using Equation (9) for (B) ASI and (C) 2D model with proposed formulation (Equation (10)). For all simulations, a fine mesh (mesh size/λ = 1/15) was chosen to ensure the results accuracy. The graphs demonstrate that the proposed formulation has a better convergence with respect to the ASI model.
Figure 3
Figure 3
Analysis of the ARF exerted on the BP using ASI simulation. (A) Color map of displacement (i), internal pressure ((ii) psolid=(σ11s+σ22s+σ33s)/3, in which σiis is the i-th principle stress in the solid domain), and time-averaged force on the elements within the BP (iii). The BP is placed in an acoustic standing pressure field (gray scale) with λ = Dp. In high frequencies, the elements located in various positions within the BP experience different displacements due to gradients of the pressure. Thus, the BP cannot be considered as a single point, and the resultant force over the whole BP volume needs to be calculated to obtain the ARF; (B) The comparison between the results of ASI model, proposed formulation (Equation (10)) in present work and previous formulations (Equation (5)). Results show a significant deviation of the ARF values in high frequencies between Equation (5) predictions and ASI results, however the proposed formulation (Equation (10)) is in a good accordance with the ASI model; (C) Density and longitudinal sound velocity of some BP materials [4,6,20,38,44,45]. Since deriving Equation (10) is based on the negligible difference in pressure map inside and outside the BP, the closeness of acoustic impedance of BP and surrounding fluid warrants a negligible error for the proposed formulation (see also Section 3.4).
Figure 4
Figure 4
The influence of BPs size on their trajectory in a separation device. (A) Scheme of a typical separation microfluidic device. The ARF pushes the BPs toward acoustic nodes while exerted force is dependent on the BP size (Equation (5)). The BPs entering the sheath flow are collected from the side outlets, however smaller particles that are less affected by the acoustophoretic force, remain in the sample flow and are collected from the center outlet; (B) 10 µm BPs trajectory in microfluidic channel, affected by a vertical one-directional standing acoustic wave (SAW) with λ = 60 µm. Three similar BPs (P1, P2 and P3) are released from different vertical positions. Dashed lines stand for trajectories of BPs subjected to the ARF derived from conventional formulation with small particle assumption (Equation (5)). The actual trajectory considering the BP size (Equation (12)) are shown by solid lines. Since fm < 1, some BPs may not succeed to enter the sheath flow and therefore the predicted efficacy of separation reduces. The distance along the channel axis is not in scale and is based on the power and inflow channel velocity.
Figure 5
Figure 5
Evaluation of the ARF arising from perpendicular acoustic waves field with Dp/λ = 0.2 and 0.4. (A) Instantaneous acoustic standing pressure map. Ellipses between positive and negative pressure areas show typical pressure nodes while circles indicate typical pressure anti-nodes; (B) The ARF calculated using small particle assumption. Triangles show the force direction; (C) The calculated ARF where the BP size is considered in equations. The results demonstrate that not only the values of actual ARF are significantly lower in comparison with previous analytical approaches but also its pattern is different particularly in higher frequencies; (D) The deviation of previous ARF calculations with respect to the position in standing pressure field. The variable F/Fs implies that Fs cannot be amended by a constant modifying factor for multidirectional acoustic fields.
Figure 6
Figure 6
Investigation on the validity of Equation (10). The effect of (A) density and (B) longitudinal sound velocity of BPs on the force difference (Ɗ) in which the target force is the ARF calculated from Equation (10). The cp and ρp0 are kept constant based on values in Table 1, respectively for (A,B); (C) The ARF obtained from ASI model compared to Equation (5) and Equation (10) predictions for ρp0 1700 kg m−3. Although the deviation of the BP density and longitudinal sound velocity from the optimal values shown in Figure 6A,B increases Ɗ, the predictions are still acceptable compared to the results obtained from previous formulations that use the small particle assumption (Equation (5)).

Similar articles

Cited by

References

    1. Antfolk M., Laurell T. Continuous flow microfluidic separation and processing of rare cells and bioparticles found in blood—A review. Anal. Chim. Acta. 2017;965:9–35. doi: 10.1016/j.aca.2017.02.017. - DOI - PubMed
    1. Jubery T.Z., Srivastava S.K., Dutta P. Dielectrophoretic separation of bioparticles in microdevices: A review. Electrophoresis. 2014;35:691–713. doi: 10.1002/elps.201300424. - DOI - PubMed
    1. Gholizadeh S., Draz M.S., Zarghooni M., Sanati-Nezhad A., Ghavami S., Shafiee H., Akbari M. Microfluidic approaches for isolation, detection, and characterization of extracellular vesicles: Current status and future directions. Biosens. Bioelectron. 2017;91:588–605. doi: 10.1016/j.bios.2016.12.062. - DOI - PMC - PubMed
    1. Lee K., Shao H., Weissleder R., Lee H. Acoustic purification of extracellular microvesicles. ACS Nano. 2015;9:2321–2327. doi: 10.1021/nn506538f. - DOI - PMC - PubMed
    1. Shao H., Chung J., Balaj L., Charest A., Bigner D.D., Carter B.S., Hochberg F.H., Breakefield X.O., Weissleder R., Lee H. Protein typing of circulating microvesicles allows real-time monitoring of glioblastoma therapy. Nat. Med. 2012;18:1835–1840. doi: 10.1038/nm.2994. - DOI - PMC - PubMed