

Spiral-Shaped Piezoelectric MEMS Cantilever Array for Fully Implantable Hearing Systems
- PMID: 30400501
- PMCID: PMC6190361
- DOI: 10.3390/mi8100311
Spiral-Shaped Piezoelectric MEMS Cantilever Array for Fully Implantable Hearing Systems
Abstract
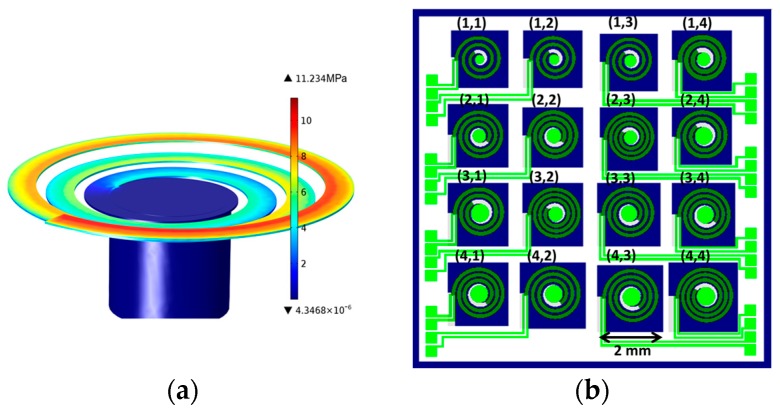
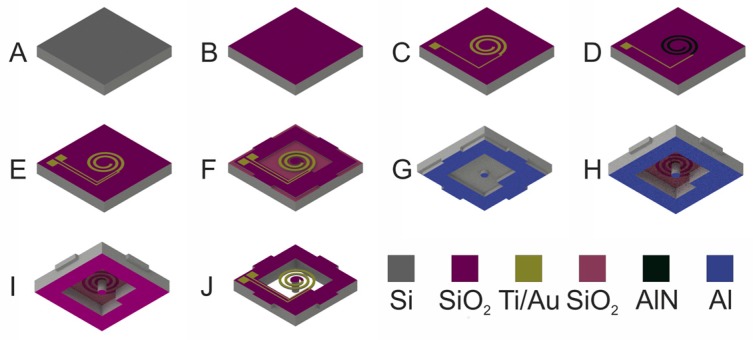
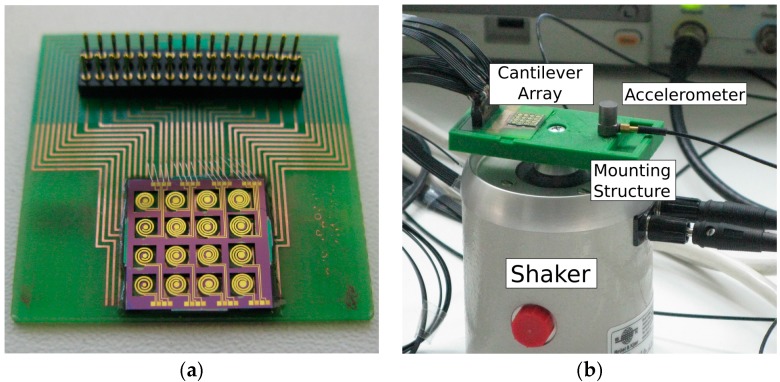
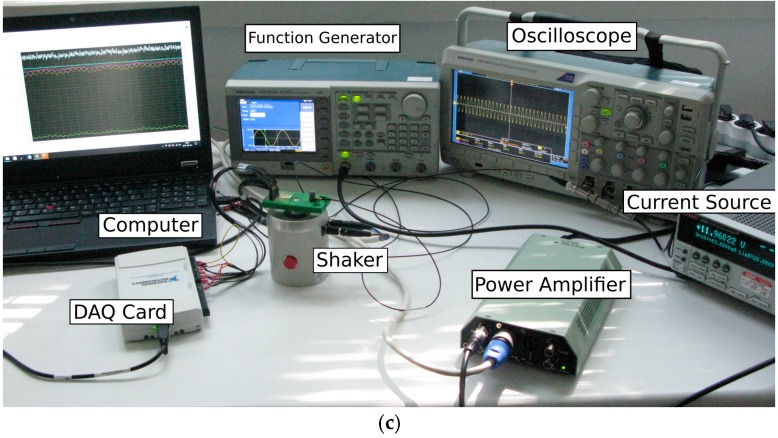
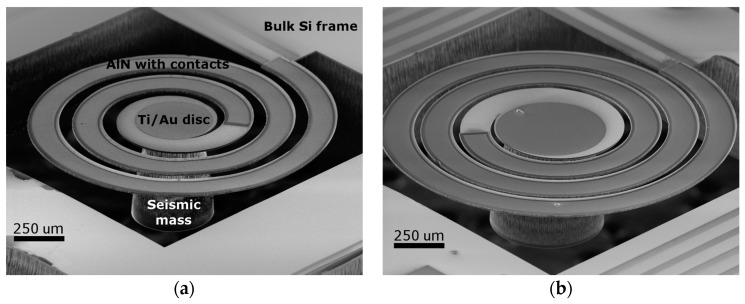
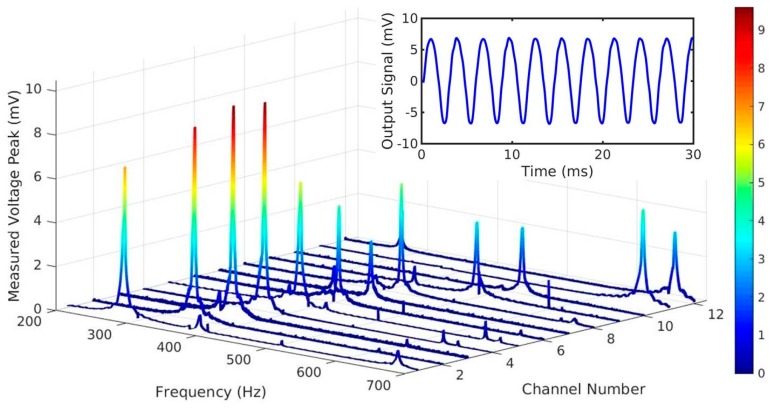
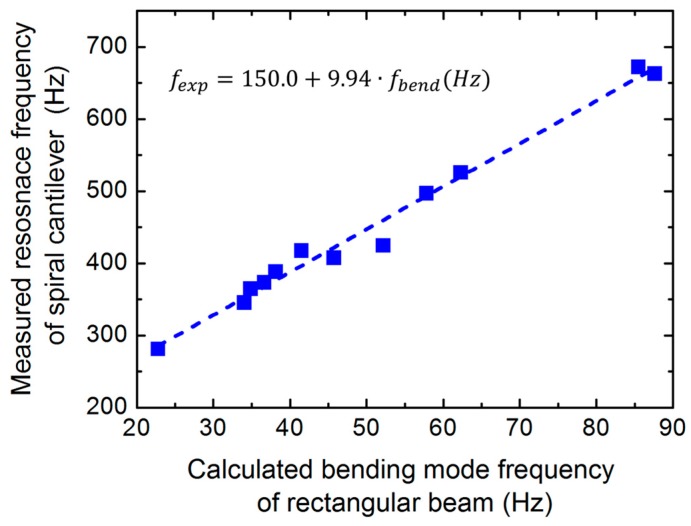
Fully implantable, self-powered hearing aids with no external unit could significantly increase the life quality of patients suffering severe hearing loss. This highly demanding concept, however, requires a strongly miniaturized device which is fully implantable in the middle/inner ear and includes the following components: frequency selective microphone or accelerometer, energy harvesting device, speech processor, and cochlear multielectrode. Here we demonstrate a low volume, piezoelectric micro-electromechanical system (MEMS) cantilever array which is sensitive, even in the lower part of the voice frequency range (300⁻700 Hz). The test array consisting of 16 cantilevers has been fabricated by standard bulk micromachining using a Si-on-Insulator (SOI) wafer and aluminum nitride (AlN) as a complementary metal-oxide-semiconductor (CMOS) and biocompatible piezoelectric material. The low frequency and low device footprint are ensured by Archimedean spiral geometry and Si seismic mass. Experimentally detected resonance frequencies were validated by an analytical model. The generated open circuit voltage (3⁻10 mV) is sufficient for the direct analog conversion of the signals for cochlear multielectrode implants.
Keywords: Archimedean spiral; aluminum nitride (AlN); artificial basilar membrane; cochlear implant; energy harvesting; finite element analysis; frequency selectivity; micro-electromechanical system (MEMS); piezoelectric cantilever.
Conflict of interest statement
The authors declare no conflict of interest.
Figures
Similar articles
-
A Miniaturized Piezoelectric MEMS Accelerometer with Polygon Topological Cantilever Structure.Micromachines (Basel). 2022 Sep 27;13(10):1608. doi: 10.3390/mi13101608. Micromachines (Basel). 2022. PMID: 36295961 Free PMC article.
-
On the design of a MEMS piezoelectric accelerometer coupled to the middle ear as an implantable sensor for hearing devices.Sci Rep. 2018 Mar 2;8(1):3920. doi: 10.1038/s41598-018-22219-7. Sci Rep. 2018. PMID: 29500435 Free PMC article.
-
Mechanical Energy Sensing and Harvesting in Micromachined Polymer-Based Piezoelectric Transducers for Fully Implanted Hearing Systems: A Review.Polymers (Basel). 2021 Jul 12;13(14):2276. doi: 10.3390/polym13142276. Polymers (Basel). 2021. PMID: 34301034 Free PMC article. Review.
-
Simple and Efficient AlN-Based Piezoelectric Energy Harvesters.Micromachines (Basel). 2020 Jan 28;11(2):143. doi: 10.3390/mi11020143. Micromachines (Basel). 2020. PMID: 32012859 Free PMC article.
-
A technical review and evaluation of implantable sensors for hearing devices.Biomed Eng Online. 2018 Feb 13;17(1):23. doi: 10.1186/s12938-018-0454-z. Biomed Eng Online. 2018. PMID: 29433516 Free PMC article. Review.
Cited by
-
Electromechanical Modeling of a Piezoelectric Vibration Energy Harvesting Microdevice Based on Multilayer Resonator for Air Conditioning Vents at Office Buildings.Micromachines (Basel). 2019 Mar 26;10(3):211. doi: 10.3390/mi10030211. Micromachines (Basel). 2019. PMID: 30917550 Free PMC article.
-
Elasto-Kinematics and Instantaneous Invariants of Compliant Mechanisms Based on Flexure Hinges.Micromachines (Basel). 2023 Mar 30;14(4):783. doi: 10.3390/mi14040783. Micromachines (Basel). 2023. PMID: 37421016 Free PMC article.
-
Piezoelectric Multi-Channel Bilayer Transducer for Sensing and Filtering Ossicular Vibration.Adv Sci (Weinh). 2024 Apr;11(16):e2308277. doi: 10.1002/advs.202308277. Epub 2024 Feb 21. Adv Sci (Weinh). 2024. PMID: 38380504 Free PMC article.
-
A polymeric piezoelectric MEMS accelerometer with high sensitivity, low noise density, and an innovative manufacturing approach.Microsyst Nanoeng. 2023 Nov 29;9:151. doi: 10.1038/s41378-023-00628-7. eCollection 2023. Microsyst Nanoeng. 2023. PMID: 38033989 Free PMC article.
-
Piezo-VFETs: Vacuum Field Emission Transistors Controlled by Piezoelectric MEMS Sensors as an Artificial Mechanoreceptor with High Sensitivity and Low Power Consumption.Sensors (Basel). 2024 Oct 21;24(20):6764. doi: 10.3390/s24206764. Sensors (Basel). 2024. PMID: 39460243 Free PMC article.
References
Grants and funding
LinkOut - more resources
Full Text Sources
Other Literature Sources
