. 2018 Nov 6;19(1):403.
doi: 10.1186/s12859-018-2426-5.

SyNDI: synchronous network data integration framework

Affiliations

SyNDI: synchronous network data integration framework

Erno Lindfors et al. BMC Bioinformatics. .

Abstract

Background: Systems biology takes a holistic approach by handling biomolecules and their interactions as big systems. Network based approach has emerged as a natural way to model these systems with the idea of representing biomolecules as nodes and their interactions as edges. Very often the input data come from various sorts of omics analyses. Those resulting networks sometimes describe a wide range of aspects, for example different experiment conditions, species, tissue types, stimulating factors, mutants, or simply distinct interaction features of the same network produced by different algorithms. For these scenarios, synchronous visualization of more than one distinct network is an excellent mean to explore all the relevant networks efficiently. In addition, complementary analysis methods are needed and they should work in a workflow manner in order to gain maximal biological insights.

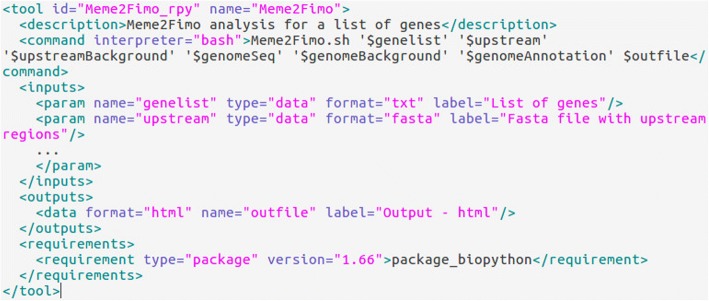
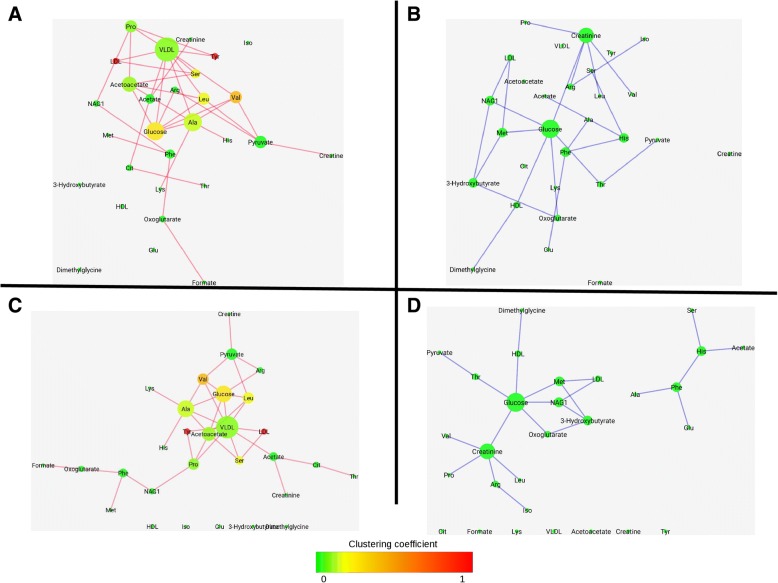
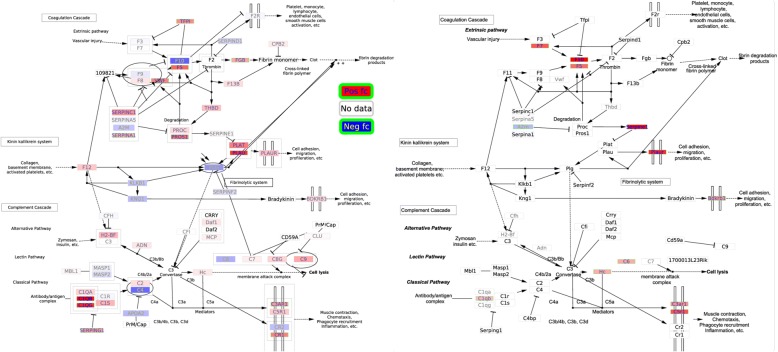
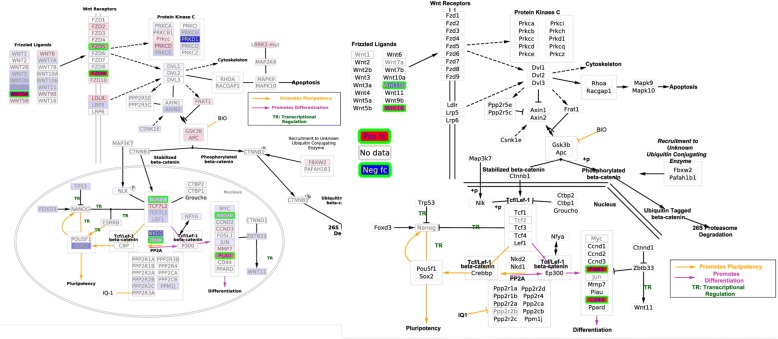
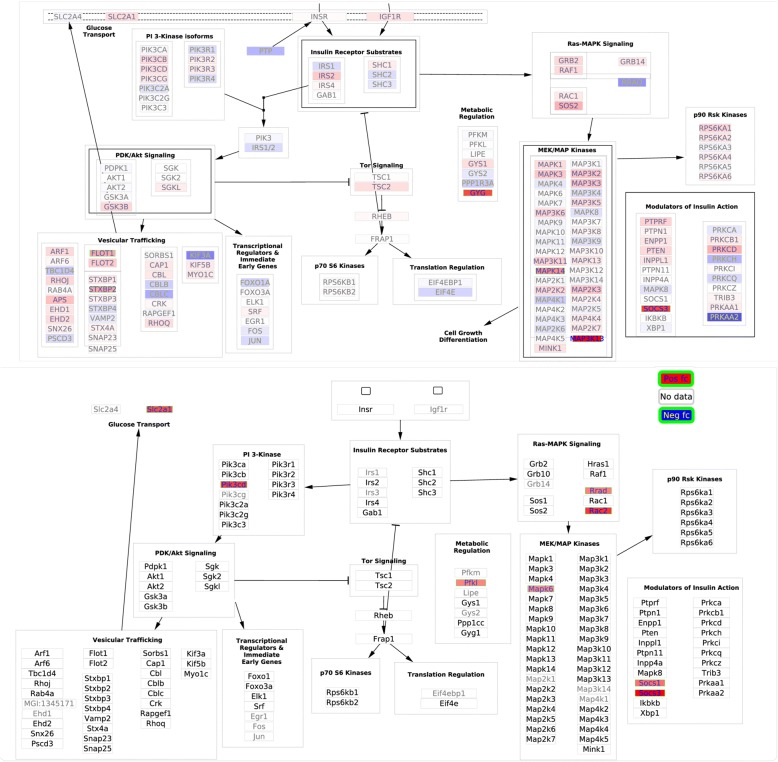
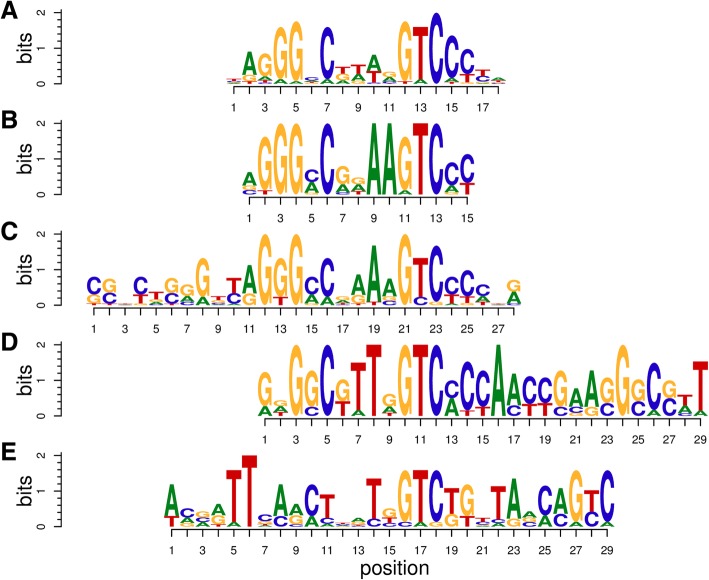
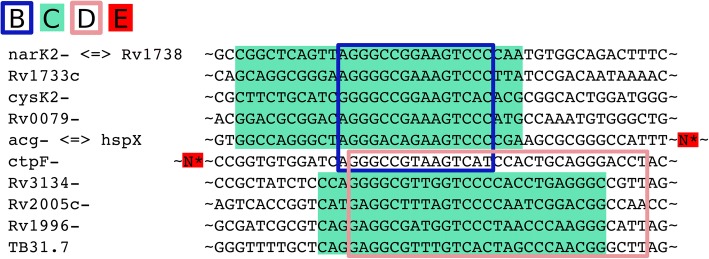
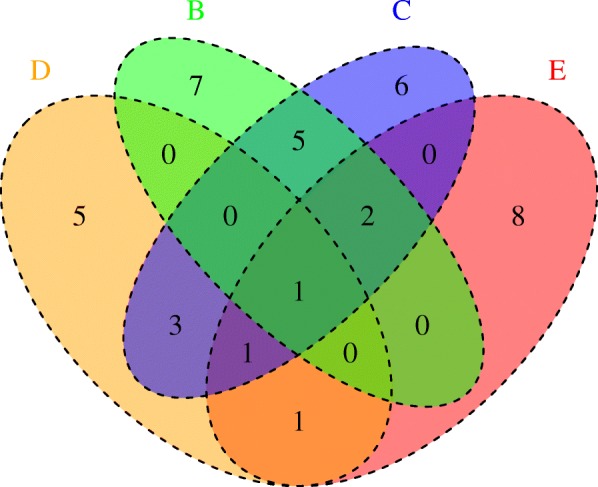
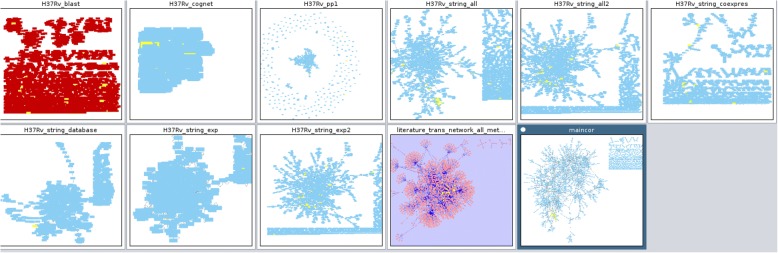
Results: In order to address the aforementioned needs, we have developed a Synchronous Network Data Integration (SyNDI) framework. This framework contains SyncVis, a Cytoscape application for user-friendly synchronous and simultaneous visualization of multiple biological networks, and it is seamlessly integrated with other bioinformatics tools via the Galaxy platform. We demonstrated the functionality and usability of the framework with three biological examples - we analyzed the distinct connectivity of plasma metabolites in networks associated with high or low latent cardiovascular disease risk; deeper insights were obtained from a few similar inflammatory response pathways in Staphylococcus aureus infection common to human and mouse; and regulatory motifs which have not been reported associated with transcriptional adaptations of Mycobacterium tuberculosis were identified.

Conclusions: Our SyNDI framework couples synchronous network visualization seamlessly with additional bioinformatics tools. The user can easily tailor the framework for his/her needs by adding new tools and datasets to the Galaxy platform.

Keywords: Cytoscape; Galaxy; Mycobacterium tuberculosis; Network biology; Staphylococcus aureus; Synchronous network visualization; Systems biology; Workflow.


Conflict of interest statement

Ethics approval and consent to participate

Not applicable

Consent for publication

Not applicable

Competing interests

The authors declare that they have no competing interests.

Publisher’s Note

Springer Nature remains neutral with regard to jurisdictional claims in published maps and institutional affiliations.

Figures

Fig. 1
Fig. 1
Technical architecture of a workflow system. It comprises of layers for network visualization and analysis; synchronous network visualization on a SyncVis Cytoscape app and network analysis on Galaxy or another external tool. The user can transfer node attributes from SyncVis to a network analysis to automatically or non-automatically
Fig. 2
Fig. 2
Content of an XML file that defines a Galaxy tool. This file contains a brief description of the tool, a command for running the tool, and the input and output parameters of the tool
Fig. 3
Fig. 3
Association networks of blood metabolites. Nodes represent metabolites. Node size is proportional to node degree and node color is linked to clustering coefficient. a and c: Associations found exclusively in subjects with high latent CVD risk (red edges). b and d: Associations found exclusively in subjects with low latent CVD risk (blue edges). Networks in A and B have the same node location. Networks C and D have been obtained using force directed layout in each of them
Fig. 4
Fig. 4
DE genes on “Complement and Coagulation Cascades” pathway upon S. aureus infection, human pathway on the left part and mouse on the right. Node color has been mapped to log2 fold change; red/blue denoting positive and negative values respectively (see legend). White color is used for nodes (genes or metabolites) for which either no data was available or changes were not deemed significant. The human pathway contains 169 nodes and 100 edges and the mouse pathway 148 nodes and 86 edges. Additional_file_7.zip contains a Complement_and_Coagulation_Cascades_human_mouse.cys file which can be opened on Cytoscape to view these pathways with better resolution
Fig. 5
Fig. 5
DE genes on “Wnt Signaling Pathway and Pluripotency” pathway upon S. aureus infection, human pathway on the left part and mouse on the right. See legend in Fig. 4 for additional information on coloring scheme. The human pathway contains 174 nodes and 55 edges and the mouse pathway 175 nodes and 54 edges. Additional_file_7.zip contains a Wnt_Signaling_Pathway_and_Pluripotency_human_mouse.cys file which can be opened on Cytoscape to view these pathways with better resolution
Fig. 6
Fig. 6
DE genes on “Insulin Signaling” pathway upon S. aureus infection, human pathway on the top part and mouse on the bottom. See legend in Fig. 4 for additional information on coloring scheme. The human pathway contains 226 nodes and 25 edges and the mouse pathway 195 nodes and 15 edges. Additional_file_7.zip contains an Insulin_Signaling_human_mouse.cys file which can be opened on Cytoscape to view these pathways with better resolution
Fig. 7
Fig. 7
Comparison of DosR and ESX-1 related motifs. a DosR motif as reported in [48] (b) Exploration path 3 motif. c Exploration path 2 motif 2. d Exploration path 1 motif. e Exploration path 2 motif 1
Fig. 8
Fig. 8
Shifted motif alignment. Marked region denotes the region containing the sequence to which the motif matches. The regions marked for the motif D regions are shifted. See Fig. 7 for the legend
Fig. 9
Fig. 9
Shared genes. Presence of binding motifs A, B, C and D in gene upstream regions. See Fig. 7 for Legends A, B, C and D motif description
Fig. 10
Fig. 10
Scalability of network visualization. This figure illustrates a synchronous visualization of 11 big networks. The selected nodes are highlighted by yellow in all networks. The exact sizes of the networks are displayed in Table 2

References

    1. Kitano H. Systems biology: a brief overview. Science. 2002;295:1662–1664. doi: 10.1126/science.1069492. - DOI - PubMed
    1. Ma X, Gao L. Biological network analysis: insights into structure and functions. Brief Funct Genomics. 2012;11:434–442. doi: 10.1093/bfgp/els045. - DOI - PubMed
    1. Meng Q, Mäkinen V-P, Luk H, Yang X. Systems biology approaches and applications in obesity, diabetes, and cardiovascular diseases. Curr Cardiovasc Risk Rep. 2013;7:73–83. doi: 10.1007/s12170-012-0280-y. - DOI - PMC - PubMed
    1. Otero JM, Nielsen J. Industrial systems biology. Biotechnol Bioeng. 2010;105:439–460. doi: 10.1002/bit.22592. - DOI - PubMed
    1. Cho D-Y, Kim Y-A, Przytycka TM. Chapter 5: network biology approach to complex diseases. PLoS Comput Biol. 2012;8:e1002820. doi: 10.1371/journal.pcbi.1002820. - DOI - PMC - PubMed

Grants and funding