MaMADS2 repression in banana fruits modifies hormone synthesis and signalling pathways prior to climacteric stage
- PMID: 30400866
- PMCID: PMC6219179
- DOI: 10.1186/s12870-018-1480-5
MaMADS2 repression in banana fruits modifies hormone synthesis and signalling pathways prior to climacteric stage
Abstract
Background: While the role of ethylene in fruit ripening has been widely studied, the contributions of additional plant hormones are less clear. Here we examined the interactions between the transcription factor MaMADS2-box which plays a major role in banana fruit ripening and hormonal regulation. Specifically, we used MaMADS2 repressed lines in transcriptome and hormonal analyses throughout ripening and assessed hormone and gene expression perturbations as compared to wild-type (WT) control fruit.
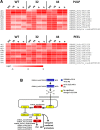
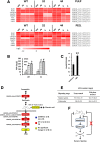
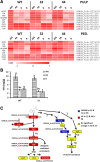
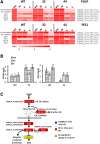
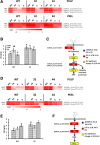
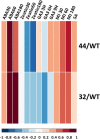
Results: Our analyses revealed major differences in hormones levels and in expression of hormone synthesis and signaling genes mediated by MaMADS2 especially in preclimacteric pulp. Genes encoding ethylene biosynthesis enzymes had lower expression in the pulp of the repressed lines, consistent with reduced ethylene production. Generally, the expression of other hormone (auxin, gibberellins, abscisic acid, jasmonic acid and salicylic acid) response pathway genes were down regulated in the WT pulp prior to ripening, but remained high in MaMADS2 repressed lines. Hormone levels of abscisic acid were also higher, however, active gibberellin levels were lower and auxin levels were similar with MaMADS2 repression as compared to WT. Although abscisic level was higher in MaMADS2 repression, exogenous abscisic acid shortened the time to ethylene production and increased MaMADS2 mRNA accumulation in WT. Exogenous ethylene did not influence abscisic acid level. CRE - a cytokinin receptor, increased its expression during maturation in WT and was lower especially at prebreaker in the repressed line and zeatin level was lower at mature green of the repressed line in comparison to WT.
Conclusions: In addition to previously reported effects of MaMADS2 on ethylene, this transcription factor also influences other plant hormones, particularly at the pre-climacteric stage. The cytokinin pathway may play a previously unanticipated role via MaMADS2 in banana ripening. Finally, abscisic acid enhances MaMADS2 expression to promote ripening, but the transcription factor in turn auto inhibits ABA synthesis and signaling. Together, these results demonstrate a complex interaction of plant hormones and banana fruit ripening mediated by MaMADS2.
Keywords: Abscisic acid; Auxin; Gibberellic acid; Hormones; Jasmonic acid; Salicylic acid.
Conflict of interest statement
Ethics approval
Transgenic plants were cultivated according to Israel Plant Protection and Inspection Services (PPIS) regulations and instructions.
Consent for publication
All participants gave their consent for publication.
Competing interests
The authors declare that they have no competing interests.
Publisher’s Note
Springer Nature remains neutral with regard to jurisdictional claims in published maps and institutional affiliations.
Figures



Similar articles
-
The regulation of MADS-box gene expression during ripening of banana and their regulatory interaction with ethylene.J Exp Bot. 2010 Mar;61(5):1523-35. doi: 10.1093/jxb/erq017. Epub 2010 Mar 3. J Exp Bot. 2010. PMID: 20200120 Free PMC article.
-
Transcriptome and hormone analyses provide insights into hormonal regulation in strawberry ripening.Planta. 2019 Jul;250(1):145-162. doi: 10.1007/s00425-019-03155-w. Epub 2019 Apr 4. Planta. 2019. PMID: 30949762
-
Comparative Transcriptomic Profiling to Understand Pre- and Post-Ripening Hormonal Regulations and Anthocyanin Biosynthesis in Early Ripening Apple Fruit.Molecules. 2018 Jul 31;23(8):1908. doi: 10.3390/molecules23081908. Molecules. 2018. PMID: 30065188 Free PMC article.
-
Different regulatory mechanisms of plant hormones in the ripening of climacteric and non-climacteric fruits: a review.Plant Mol Biol. 2021 Dec;107(6):477-497. doi: 10.1007/s11103-021-01199-9. Epub 2021 Oct 11. Plant Mol Biol. 2021. PMID: 34633626 Review.
-
Phytohormones in fruit development and maturation.Plant J. 2021 Jan;105(2):446-458. doi: 10.1111/tpj.15112. Epub 2021 Jan 12. Plant J. 2021. PMID: 33274492 Review.
Cited by
-
Genomic Approaches for Improvement of Tropical Fruits: Fruit Quality, Shelf Life and Nutrient Content.Genes (Basel). 2021 Nov 25;12(12):1881. doi: 10.3390/genes12121881. Genes (Basel). 2021. PMID: 34946829 Free PMC article. Review.
-
The SnRK2.3-AREB1-TST1/2 cascade activated by cytosolic glucose regulates sugar accumulation across tonoplasts in apple and tomato.Nat Plants. 2023 Jun;9(6):951-964. doi: 10.1038/s41477-023-01443-8. Epub 2023 Jun 8. Nat Plants. 2023. PMID: 37291399
-
The Musa troglodytarum L. genome provides insights into the mechanism of non-climacteric behaviour and enrichment of carotenoids.BMC Biol. 2022 Aug 24;20(1):186. doi: 10.1186/s12915-022-01391-3. BMC Biol. 2022. PMID: 36002843 Free PMC article.
-
The Physiological and Molecular Mechanism of Abscisic Acid in Regulation of Fleshy Fruit Ripening.Front Plant Sci. 2021 Jan 11;11:619953. doi: 10.3389/fpls.2020.619953. eCollection 2020. Front Plant Sci. 2021. PMID: 33505417 Free PMC article. Review.
References
-
- Elitzur T, Yakir E, Quansah L, Zhangjun F, Vrebalov J, Khayat E, Giovannoni JJ, Friedman H. Banana MaMADS transcription factors are necessary for fruit ripening and molecular tools to promote shelf-life and food security. Plant Physiol. 2016;171:380–391. doi: 10.1104/pp.15.01866. - DOI - PMC - PubMed

