. 2018 Nov 1;72(3):444-456.e7.
doi: 10.1016/j.molcel.2018.09.022. Epub 2018 Oct 25.

UV-Protection Timer Controls Linkage between Stress and Pigmentation Skin Protection Systems

Affiliations

UV-Protection Timer Controls Linkage between Stress and Pigmentation Skin Protection Systems

Hagar Malcov-Brog et al. Mol Cell. .

Abstract

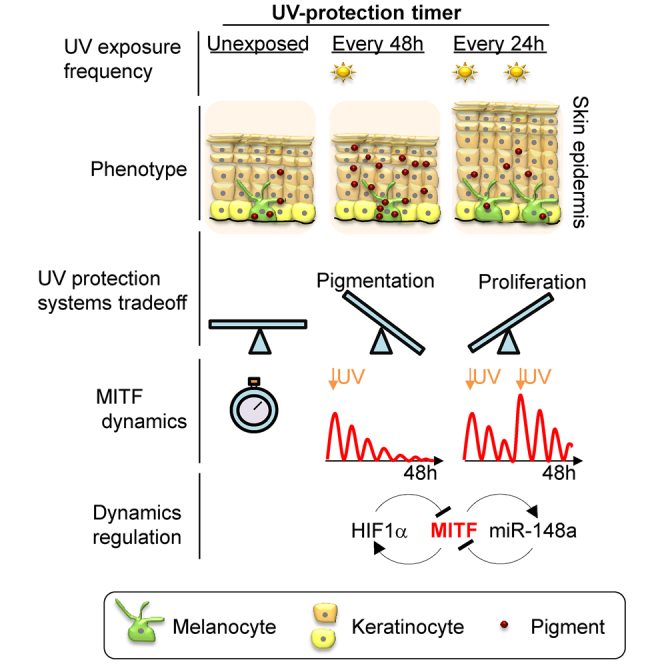
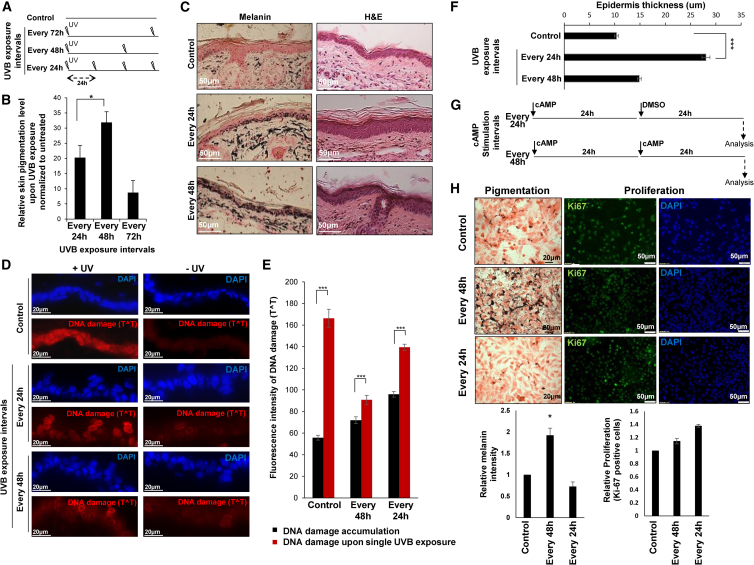
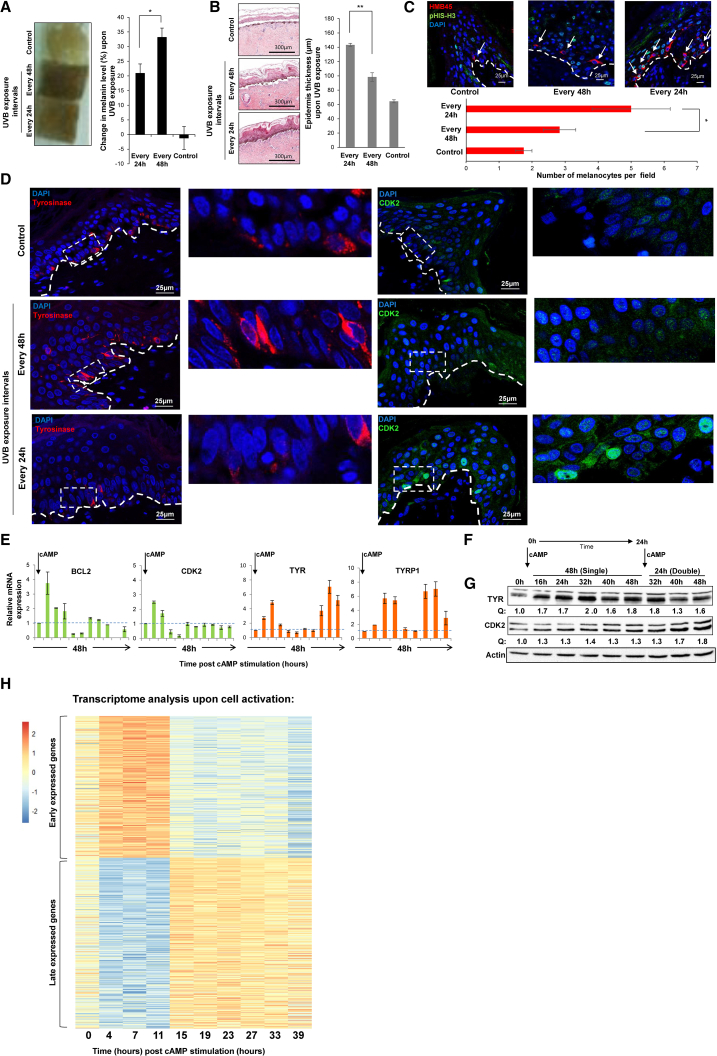
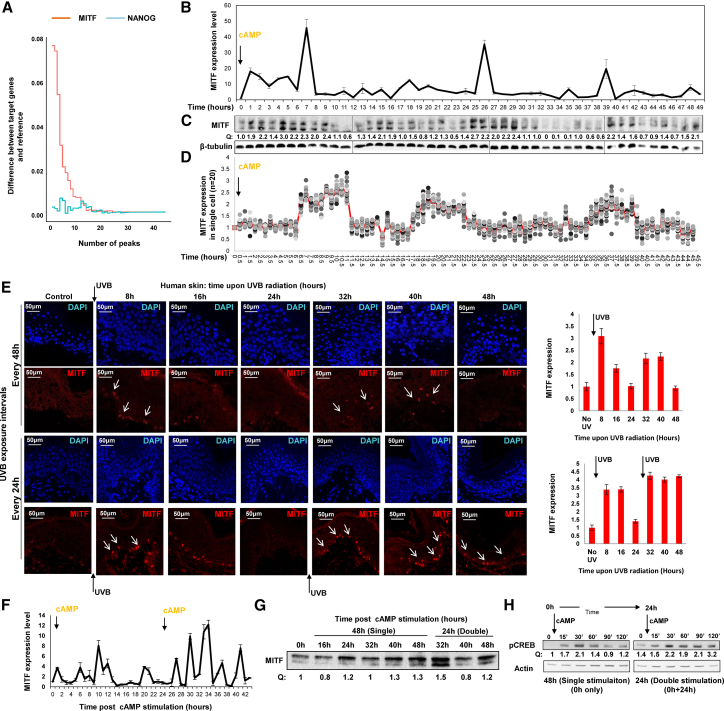
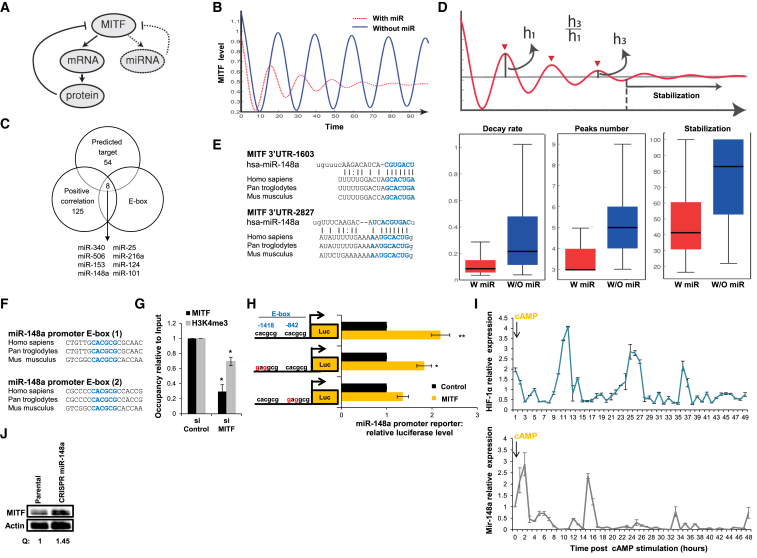
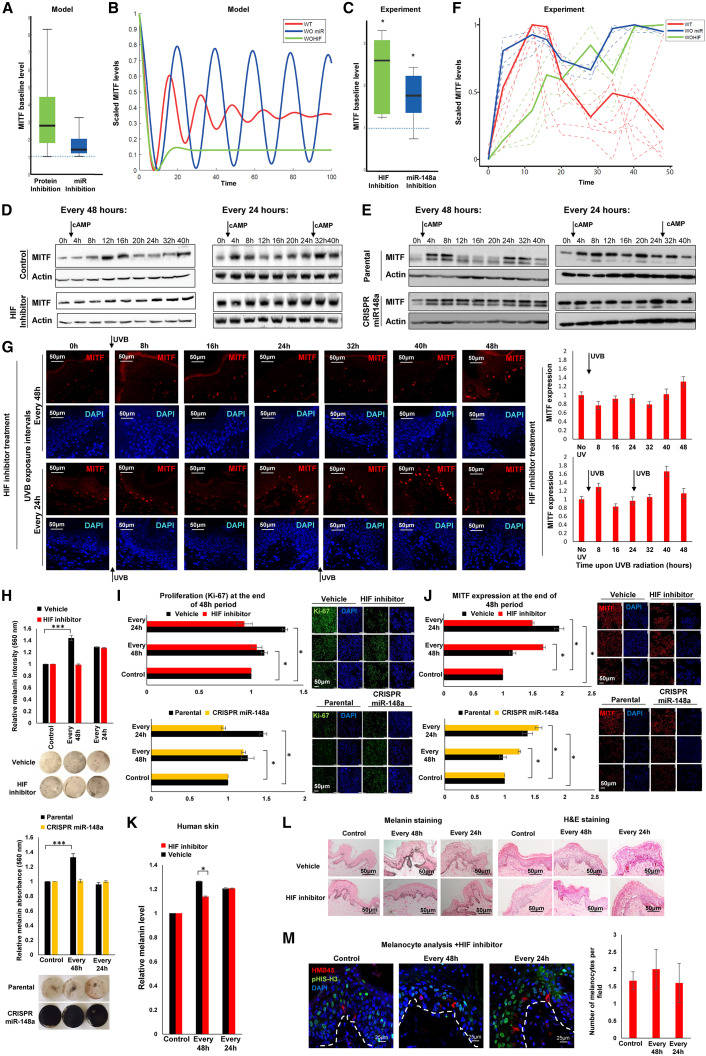
Skin sun exposure induces two protection programs: stress responses and pigmentation, the former within minutes and the latter only hours afterward. Although serving the same physiological purpose, it is not known whether and how these programs are coordinated. Here, we report that UVB exposure every other day induces significantly more skin pigmentation than the higher frequency of daily exposure, without an associated increase in stress responses. Using mathematical modeling and empirical studies, we show that the melanocyte master regulator, MITF, serves to synchronize stress responses and pigmentation and, furthermore, functions as a UV-protection timer via damped oscillatory dynamics, thereby conferring a trade-off between the two programs. MITF oscillations are controlled by multiple negative regulatory loops, one at the transcriptional level involving HIF1α and another post-transcriptional loop involving microRNA-148a. These findings support trait linkage between the two skin protection programs, which, we speculate, arose during furless skin evolution to minimize skin damage.

Keywords: MITF dynamics; UVB radiation; skin pigmentation; skin proliferation; trait linkage.


Figures

None
Graphical abstract
Figure 1
Figure 1
The Frequency of UVB Exposure Dictates a Trade-off between Skin Protection Programs (A) Schematic presentation of the experimental procedure. Mouse skin was UVB irradiated every 24, 48, or 72 hr or untreated (Control). (B) Melanin level of C57BL/6 mice skin upon 60 days of UVB radiation (50 mJ/cm2) at indicated periodicity normalized to untreated controls; Error bars indicate SEM. p < 0.05 (n = 4). (C) Fontana-Masson (melanin) and H&E staining of ear sections from the representative mice after 60 days of treatment. Scale bars, 50 μm. (D) DNA damage analysis (see STAR Methods) by Thymine dimer (TˆT) staining (red) of ear sections. DAPI staining (cell nuclei) appears in blue. Left: DNA-damage level immediately upon a single UVB dose (50 mJ/cm2) (+UV). Right: the accumulated DNA damage of ears that did not received the final UV dose (−UV). Scale bars, 20 μm. (E) DNA damage (TˆT) quantification. Error bars indicate SEM. ∗∗∗p < 0.001 (n = 4 mice; n = 10 images from each section). (F) Epidermal thickness quantification of the mice skin treated as in (A). Error bars represent SEM. ∗∗∗p < 0.001 (n = 6). (G) Schematic of the 24-hr- or 48-hr-interval cAMP treatments in cell culture. (H) Fontana-Masson, Ki67, and DAPI (cell nuclei) staining (n = 6) of melanoma cells upon single or double cAMP stimulation. Vehicle-treated cells were used as a control. Error bars represent SEM. p < 0.05. Scale bars, 20 μm for pigmentation and 50 μm for proliferation. See also Figure S1.
Figure 2
Figure 2
Skin Protection Programs Have a Sequential Dynamic of Expression For a Figure360 author presentation of Figure 2, see https://doi.org/10.1016/j.molcel.2018.09.022. (A) Bright image of human skin after 10 days of exposure to UVB (250 mJ/cm2) at indicated intervals. Graph represents quantification of the changes in melanin levels normalized to day 0. Error bars represent SEM. p < 0.05 (n = 5 donors). (B) H&E staining of human skin as described in (A). Graph represents the epidermal thickness quantification. Error bars represent SEM. ∗∗p < 0.01 (n = 1 representative donor per 55 segments). (C) Immunofluorescence staining of melanocytes (HMB45) and proliferation marker (Phospho Histone H3) following UVB (250 mJ/cm2) exposure of human skin at the indicated intervals. Graph represents melanocyte number per field quantification. Untreated skin was used as a control. Error bars represent SEM. p < 0.05. Scale bars, 25 μm. (D) Immunofluorescence analysis of TYR (red) and CDK2 (green) upon single or double UVB exposure (200 mJ/cm2) of human skin. Control samples were not irradiated. Samples were irradiated once at time 0 or once at time 0 and again at 24 hr. Analysis was performed at 32 hr after the first dose. Scale bars, 25 μm. (E) Proliferation (BCL2 and CDK2) and pigmentation (TYR and TYRP1) gene expression level upon single cAMP stimulation of MNT-1 cells, approximately every 5 hr. Data were normalized to actin. Error bars represent SEM of the technical replicates (n = 3). (F) Experimental design: MNT-1 cells were treated with cAMP at time 0 (single) or treated twice at time 0 and 24 hr after first stimulation (double). (G) Protein levels of TYR and CDK2 were determined at indicated times. Quantification of protein amount normalized to actin (Q) is indicated. (H) Scaled expression (Z scores) of the early-induced (top) and late-induced (bottom) genes in melanocytes at baseline and at the indicated time points post-cAMP stimulation. See also Figure S2 and Tables S1 and S2.
Figure 3
Figure 3
UVB Exposure Periodicity Directly Affects MITF Dynamics Behavior (A) The difference in the number of MITF (pink) and Nanog (blue) peaks detected in the promoters of early and late genes relative to all genes. (B and C) MNT-1 cells were treated with a single dose of cAMP, and MITF mRNA (B) and protein (C) were quantified hourly for 48 hr. mRNA was normalized to actin, and β-tubulin was used as a loading control. Error bars represent SEM of the technical replicates (n = 3). (D) MNT-1 cells were treated as in (C), and samples were fixed every 30 min for 48 hr (images are shown in Figure S3B). Graph represents quantification of MITF fluorescence intensity in single cells (n = 20). (E) Immunofluorescence analysis of MITF expression (arrows) in human skin at the indicated time points after UVB treatment (250 mJ/cm2) at the 24-hr or 48-hr intervals. DAPI-stained nuclei appear in blue. Error bars represent SEM. p < 0.05 (n = 8 cells in each time point). Scale bars, 50 μm. (F) MITF mRNA expression in MNT-1 cells upon every 24-hr cAMP stimulation normalized to GAPDH. Error bars represent SEM of the technical replicates (n = 2). (G) MITF protein levels at the indicated time points in cells treated as in (F). Actin was used as a loading control, as in Figure 2G. Quantification of protein amount normalized to actin (Q) is indicated. (H) Cells were treated with cAMP at 24-hr or 48-hr intervals. Phospho-CREB protein levels were measured at the indicated times post-cAMP treatment. Quantification of protein amount normalized to actin (Q) is indicated. See also Figure S3 and Table S3.
Figure 4
Figure 4
Two Layers of Negative Regulatory Loops Determine MITF Damped Oscillatory Behavior (A) Mathematical model depicting MITF negative regulation by PDE4D and HIF1α (bold, solid lines indicate that transcription and translation are required) and miRNAs (dashed lines indicate that only transcription is required). (B) A simulation of MITF expression dynamics as derived from the mathematical model under negative regulation of protein only (blue) or a combination of protein and miRNA (red). (C) Overlap between 62 miRNAs predicted to target MITF (http://www.targetscan.org), 133 miRNAs in positive correlation with MITF (Bell et al., 2014), and miRNAs that include E-box in their promoter. (D) Upper panel: an illustration depicting the dynamical features used for comparison between the reference (protein-derived regulation) and the reference under an additional miRNA regulation. Lower panels indicate oscillation features: decay rate (corresponding to the ratio between the third and first peaks, left panel), number of peaks (middle panel), and time to reach stabilization (right panel) under negative regulation of either protein (blue) or a combination of protein and miRNA (red). (E) Predicted binding site for miR-148a in the MITF 3′UTR sequence. (F) Two conserved MITF DNA binding sites (E-boxes) in miR-148a promoter sequence. (G) ChIP was performed on extracts from WM3682 cells transfected with siMITF or siControl. Protein:chromatin-crosslinked complexes were precipitated with the indicated antibodies. PCR primers spanning the region encoding the miR-148a promoter were used. The data show promoter occupancy relative to input. Error bars represent SEM. p < 0.05 (n = 3). (H) Expression of miR-148a promoter reporter with WT or mutated E-box regions upon MITF cDNA (MITF) or empty vector (control) expression in HEK293T cells. Firefly luciferase activity was normalized to Renilla luciferase activity. Fold changes relative to control are indicated. Error bars represent SEM. p < 0.05; ∗∗p < 0.01 (n = 3). (I) HIF1α and miR-148a levels were quantified in MNT-1 samples collected hourly for 48 hr upon cAMP stimulation. Levels were normalized to actin and U6, respectively. Error bars represent SEM of technical replicates (n = 3). (J) MITF protein levels in parental WT MNT-1 cells (control) and the miR-148a-deleted MNT1 cell line. Actin was used as a loading control. Quantification of protein amount normalized to actin (Q) is indicated. See also Figure S4 and Table S4.
Figure 5
Figure 5
Regulation of Skin Protection Systems by External Disruption of MITF Dynamics (A) Fold change of MITF baseline under inhibition of either protein (green) or miRNA (blue) relative to the baseline value without any inhibition, as predicted by the mathematical model. (B) A representative simulation of MITF dynamics under normal conditions (red) or under either HIF (green) or miRNA (blue) inhibitions. WO, without. (C) Fold change of MITF baseline under inhibition of either HIF1α (green) or miR-148a (blue) relative to the baseline value without any inhibition, as observed experimentally. p = 0.05 and p = 0.03 for HIF1α and miR-148a inhibition, respectively; paired t test. (D) MITF protein levels in WM3682 cells treated with vehicle or HIF1α inhibitor FM19G11 at the indicated times following 24-hr- or 48-hr-interval cAMP stimulation. Actin was used as a loading control. (E) MITF protein levels in parental WT MNT-1 cells or the CRISPR-miR-148a MNT-1 cells at the indicated times following 24-hr- or 48-hr-interval cAMP stimulation. Actin was used as a loading control. (F) Scaled MITF protein expression level dynamics under normal conditions (red) or under either HIF (green) or miRNA (blue) inhibitions. Dashed lines correspond to individual experiments, whereas bold lines correspond to the 75% quantile of MITF levels across all experiments. (G) Human skin was treated with vehicle (control) or with FM19G11 (HIF1α inhibitor) and was exposed to UVB at 24-hr or 48-hr intervals. MITF immunofluorescence was analyzed (red) every 8 hr and quantified in the graphs on the right. DAPI-stained nuclei appear in blue. Error bars represent SEM (n = 8 cells in each time point). Scale bars, 50 μm. (H–J) WM3682 cells were treated with vehicle or HIF1α inhibitor FM19G11 and parental WT MNT-1, or the CRISPR-miR-148a MNT-1 cells were stimulated with cAMP every 24 hr or 48 hr, fixed, and analyzed for (H) melanin levels (upper and lower panels; Fontana-Masson staining), (I) proliferation (Ki67), and (J) MITF levels. Graphs represent quantifications of the three experiments. Error bars represent SEM. ∗∗∗p < 0.001, p < 0.05 (n = 3). Scale bars, 50 μm. (K) Human skin was treated with vehicle or HIF1α inhibitor FM19G11 (30 mM) and subjected to no UV or to 24-hr or 48-hr UVB intervals (50 and 250 mJ/cm2, respectively). Graph represents quantification of skin pigmentation. Error bars represent SEM. p < 0.05 (n = 2). (L) Fontana-Masson (melanin) and H&E staining of the human skin, treated as in (K). (M) Immunofluorescence staining of melanocytes (HMB45) and a proliferation marker (Phospho Histone H3) following UVB (250 mJ/cm2) exposure of human skin at the indicated intervals. Graph represents melanocyte number per field quantification. An untreated skin sample was used as a control. Error bars represent SEM. Scale bars, 25 μm. See also Figure S5.

Similar articles

Cited by

References

    1. Anders S., Pyl P.T., Huber W. HTSeq--a Python framework to work with high-throughput sequencing data. Bioinformatics. 2015;31:166–169. - PMC - PubMed
    1. Bayerl C., Taake S., Moll I., Jung E.G. Characterization of sunburn cells after exposure to ultraviolet light. Photodermatol. Photoimmunol. Photomed. 1995;11:149–154. - PubMed
    1. Bell R.E., Levy C. The three M’s: melanoma, microphthalmia-associated transcription factor and microRNA. Pigment Cell Melanoma Res. 2011;24:1088–1106. - PubMed
    1. Bell R.E., Khaled M., Netanely D., Schubert S., Golan T., Buxbaum A., Janas M.M., Postolsky B., Goldberg M.S., Shamir R. Transcription factor/microRNA axis blocks melanoma invasion program by miR-211 targeting NUAK1. J. Invest. Dermatol. 2014;134:441–451. - PubMed
    1. Busca R., Berra E., Gaggioli C., Khaled M., Bille K., Marchetti B., Thyss R., Fitsialos G., Larribere L., Bertolotto C. Hypoxia-inducible factor 1α is a new target of microphthalmia-associated transcription factor (MITF) in melanoma cells. J. Cell. Biol. 2005;170:49–59. - PMC - PubMed

Publication types

Substances