. 2019 Jan 31;133(5):446-456.
doi: 10.1182/blood-2018-04-845420. Epub 2018 Nov 6.

Acute myeloid leukemia induces protumoral p16INK4a-driven senescence in the bone marrow microenvironment

Affiliations

Acute myeloid leukemia induces protumoral p16INK4a-driven senescence in the bone marrow microenvironment

Amina M Abdul-Aziz et al. Blood. .

Abstract

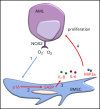
Acute myeloid leukemia (AML) is an age-related disease that is highly dependent on the bone marrow (BM) microenvironment. With increasing age, tissues accumulate senescent cells, characterized by an irreversible arrest of cell proliferation and the secretion of a set of proinflammatory cytokines, chemokines, and growth factors, collectively known as the senescence-associated secretory phenotype (SASP). Here, we report that AML blasts induce a senescent phenotype in the stromal cells within the BM microenvironment and that the BM stromal cell senescence is driven by p16INK4a expression. The p16INK4a-expressing senescent stromal cells then feed back to promote AML blast survival and proliferation via the SASP. Importantly, selective elimination of p16INK4a+ senescent BM stromal cells in vivo improved the survival of mice with leukemia. Next, we find that the leukemia-driven senescent tumor microenvironment is caused by AML-induced NOX2-derived superoxide. Finally, using the p16-3MR mouse model, we show that by targeting NOX2 we reduced BM stromal cell senescence and consequently reduced AML proliferation. Together, these data identify leukemia-generated NOX2-derived superoxide as a driver of protumoral p16INK4a-dependent senescence in BM stromal cells. Our findings reveal the importance of a senescent microenvironment for the pathophysiology of leukemia. These data now open the door to investigate drugs that specifically target the "benign" senescent cells that surround and support AML.


Conflict of interest statement

Conflict-of-interest disclosure: The authors declare no competing financial interests.

Figures
None
Graphical abstract
Figure 1.
Figure 1.
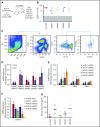
Primary human AML induces a p16-driven SASP in vivo. (A) Schematic of in vivo experiment in which 2 × 10⁶ primary AML cells (4 individual patient AML cells and 5 CD34 HPC) were injected into NSG mice. (B) Engraftment was measured by detecting human CD45 by flow cytometry. In the dot plot, each AML engraftment into NSG mice is shown for BM. (C) Representative gating strategy for BMSC cell (hCD45, mCD45, mCD31, mTer119, mCD105+, and mCD140a+) population that was sorted. (D) RNA analysis for p16 and p21 in the sorted BMSC (hCD45, mCD45, mCD31, mTer119, mCD105+, and mCD140a+) isolated from NSG mice engrafted with primary human AML or cord blood CD34+ HPC. (E) RNA analysis for SASP in the sorted BMSC. (F) RNA analysis for lamin B in the sorted BMSC. (G) Terminal peripheral blood samples were taken and plasma isolated from all NSG mice engrafted with primary human AML or cord blood CD34+ HPC and mouse IL-6 was measured by enzyme-linked immunosorbent assay. The Mann-Whitney U test was used to compare between treatment groups (*P < .05). FSC, forward scatter; SSC, side scatter.
Figure 2.
Figure 2.
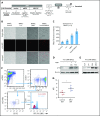
AML-induced senescence in BMSC. (A) BMSC were cultured alone or with primary AML (0.25 × 10⁶; n = 12) or with CD34+ HPC (0.25 × 10⁶; n = 7) for 6 days. Nonadherent cells were removed and BMSC were analyzed for SA-βgal. (B) Bar graph representation of SA-βgal+ cells from panel A. (C) BMSC were cultured alone or with primary AML (0.25 × 10⁶; n = 10) or with CD34+ HPC (0.25 × 10⁶; n = 5) for 6 days. Nonadherent cells were removed and RNA was extracted from the BMSC. RNA was analyzed for IL-6 and IL-8 expression using quantitative reverse transcription PCR. (D) As for panel C, but analyzed for p16 and p21. (E) BMSC were infected with p16 targeted shRNA or control shRNA lentivirus and cultured for 5 days. AML blasts (0.25 × 10⁶; n = 10) or CD34+ HPC (0.25 × 10⁶; n = 5) were cocultured with BMSC with control shRNA or on BMSC with p16 shRNA. AML blast number was assessed using a trypan blue exclusion hemocytometer-based count and CD33/CD45+ staining using flow cytometry. (F) To confirm the senescent profile of BMSC from (E) nonadherent, cells were removed and BMSC were analyzed for senescence associated SA-βgal (n = 5). The Mann-Whitney U test was used to compare between treatment groups (*P < .05). Each dot on the dot plots represents a different AML or CD34 HPC sample. ns, not significant.
Figure 3.
Figure 3.
MN1 engraftment drives p16-3MR. (A) Schematic of p16-3MR model. (B) Fluorescent images of p16-3MR–isolated BMSC that have been cultured alone or with lin, MN1, or HoxA9/Meis1 cells for 6 days (n = 3). (C) Flow cytometry analysis of p16-3MR BMSC that have been cultured alone or with lin, MN1, or HoxA9/Meis1 cells for 6 days (n = 3). (D) Western blot analysis of p16-3MR BMSC cultured alone or with MN1 for 6 days. Blots were reprobed with B-actin to confirm sample loading (shown are representative images of 3 blots). (E) Western blot analysis of p16-3MR BMSC cultured alone or with lin, CM from MN1 cells, or MN1 cells. Blots were reprobed with B-actin to confirm sample loading (shown are representative images of 3 blots). (F) 1 × 10⁵ MN1 cells were injected into the tail vein of p16-3MR mice. BM was isolated and analyzed for mouse BMSC (mCD45, mCD31, mTer119, mCD105+, and mCD140a+) expressing RFP using flow cytometry (n = 5). (G) Flow cytometry analysis of p16-3MR BMSC measuring RFP (F). The Mann-Whitney U test was used to compare between treatment groups (*P < .05). CM, conditioned media; DC, direct contact; HSV-TK, herpes simplex virus-1 thymidine kinase; TW, transwell.
Figure 4.
Figure 4.
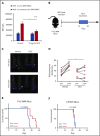
Deleting senescent cells reduces AML tumor volume. (A) MN1 were grown on p16-3MR nonsenescent or senescent BMSC for 2 days with and without treatment with GCV (10 µg/mL) (n = 3). (B) GCV experiment in vivo. (C-D) 1 × 10⁵ MN1-luc cells were injected into p16-3MR mice (n = 8 for each treatment group). Mice were imaged at 14 days postengraftment. At day 15, GCV (25 mg/kg) or PBS treatment was started for 5 days. Mice were then imaged again 1 day after GCV treatment had finished. (C) Pre and post images show the same mice in the same order. (D) Densitometry of the bioluminescent images was performed to determine differences between vehicle and GCV treated animals. (E-F) Kaplan-Meier survival curves for p16-3MR (n = 8) and C57BL/6 (n = 7) mice injected with MN1 and then treated with vehicle or GCV as shown in panel B.
Figure 5.
Figure 5.
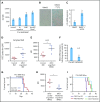
AML-induced NOX2-derived superoxide drives BM senescence. (A) BMSC from p16-3MR were isolated and then cultured alone or with lin, MN1, or HoxA9/Meis1 cells for 3 days. DCF fluorescence was assessed in BMSC by flow cytometry (n = 4). (B) Human BMSC were treated with 10 μM H2O2 for 6 days and then analyzed for senescence associated SA-βgal, and (C) p16 mRNA expression (n = 4). (D) C57BL/6 mice injected with MN1. At 21 days postengraftment, mice were euthanized and whole BM was isolated and analyzed for H2O2 production using the Amplex red assay (n = 5). (E) C57BL/6 mice were injected with MN1 cells. At 21 days postengraftment, mice were euthanized and BMSC were analyzed by flow cytometry for DCF fluorescence (n = 5). (F) Real-time PCR assay was used to analyze the NOX2 mRNA expression level in NOX2-KD MN1 cells compared with control-KD cells (n = 4). (G) Kaplan-Meier survival curves for p16-3MR mice injected with MN1 NOX2-KD cells or MN1 control-KD cells (n = 7 in each group). (H) At the end point of the experiment, BM was isolated and flow cytometry was performed to detect BMSC-derived RFP (n = 5). (I) Kaplan-Meier survival curves for p16-3MR mice injected with MN1 NOX2-KD cells or MN1 control-KD cells and then injected IP with PBS or GCV at day 15, GCV (25 mg/kg) for 5 days (n = 4).

References

    1. Shafat MS, Oellerich T, Mohr S, et al. . Leukemic blasts program bone marrow adipocytes to generate a protumoral microenvironment. Blood. 2017;129(10):1320-1332. - PubMed
    1. Miraki-Moud F, Anjos-Afonso F, Hodby KA, et al. . Acute myeloid leukemia does not deplete normal hematopoietic stem cells but induces cytopenias by impeding their differentiation. Proc Natl Acad Sci USA. 2013;110(33):13576-13581. - PMC - PubMed
    1. Pezeshkian B, Donnelly C, Tamburo K, Geddes T, Madlambayan GJ. Leukemia mediated endothelial cell activation modulates leukemia cell susceptibility to chemotherapy through a positive feedback loop mechanism. PLoS One. 2013;8(4):e60823. - PMC - PubMed
    1. Abdul-Aziz AM, Shafat MS, Mehta TK, et al. . MIF-induced stromal PKCβ/IL8 is essential in human acute myeloid leukemia. Cancer Res. 2017;77(2):303-311. - PubMed
    1. Ryningen A, Wergeland L, Glenjen N, Gjertsen BT, Bruserud O. In vitro crosstalk between fibroblasts and native human acute myelogenous leukemia (AML) blasts via local cytokine networks results in increased proliferation and decreased apoptosis of AML cells as well as increased levels of proangiogenic Interleukin 8. Leuk Res. 2005;29(2):185-196. - PubMed

Publication types