

Detection of cell-free DNA fragmentation and copy number alterations in cerebrospinal fluid from glioma patients
- PMID: 30401727
- PMCID: PMC6284385
- DOI: 10.15252/emmm.201809323
Detection of cell-free DNA fragmentation and copy number alterations in cerebrospinal fluid from glioma patients
Abstract
Glioma is difficult to detect or characterize using current liquid biopsy approaches. Detection of cell-free tumor DNA (cftDNA) in cerebrospinal fluid (CSF) has been proposed as an alternative to detection in plasma. We used shallow whole-genome sequencing (sWGS, at a coverage of < 0.4×) of cell-free DNA from the CSF of 13 patients with primary glioma to determine somatic copy number alterations and DNA fragmentation patterns. This allowed us to determine the presence of cftDNA in CSF without any prior knowledge of point mutations present in the tumor. We also showed that the fragmentation pattern of cell-free DNA in CSF is different from that in plasma. This low-cost screening method provides information on the tumor genome and can be used to target those patients with high levels of cftDNA for further larger-scale sequencing, such as by whole-exome and whole-genome sequencing.
Keywords: cell‐free DNA; cerebrospinal fluid; fragmentation; glioma; shallow WGS.
© 2018 The Authors. Published under the terms of the CC BY 4.0 license.
Figures
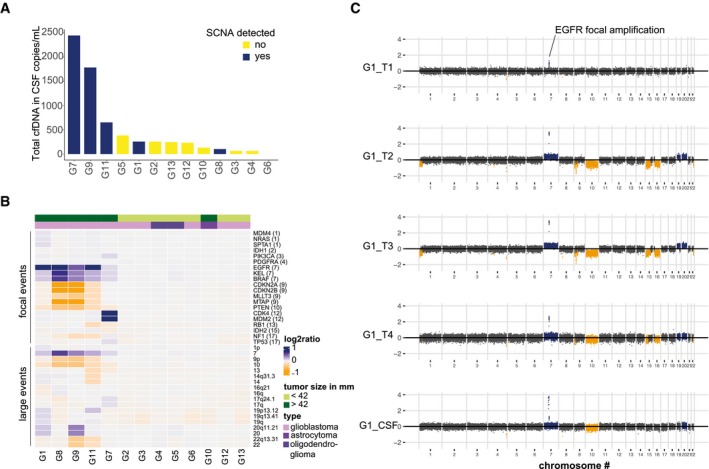
- A
Concentration of total cell‐free DNA (cfDNA) in 13 CSF samples. Samples in which SCNAs were detected are shown in dark blue and tended to have higher levels of total cfDNA.
- B
Relative copy number estimation in 20 genes of interest, and 18 large genomic regions, determined by sWGS of CSF from 13 glioma patients. Genes are ordered by genomic position, and their chromosomal locations are indicated in parentheses. Amplifications are shown in dark blue, deletions are in orange, and copy number neutral regions are in gray. The top green bar indicates the tumor largest length dimension (< 42 mm vs. > 42 mm), and the top violet bar indicates the glioma subtype. SCNAs were more frequently detected in CSF from patients with large glioblastoma tumors.
- C
SCNAs determined by sWGS in four tumor subparts (T1 − T4) and the CSF sample, collected from patient G1. Amplifications are shown in dark blue, deletions are in orange, and copy number neutral regions are in dark gray. sWGS from plasma and urine samples collected at the same time as the CSF sample showed no SCNAs.
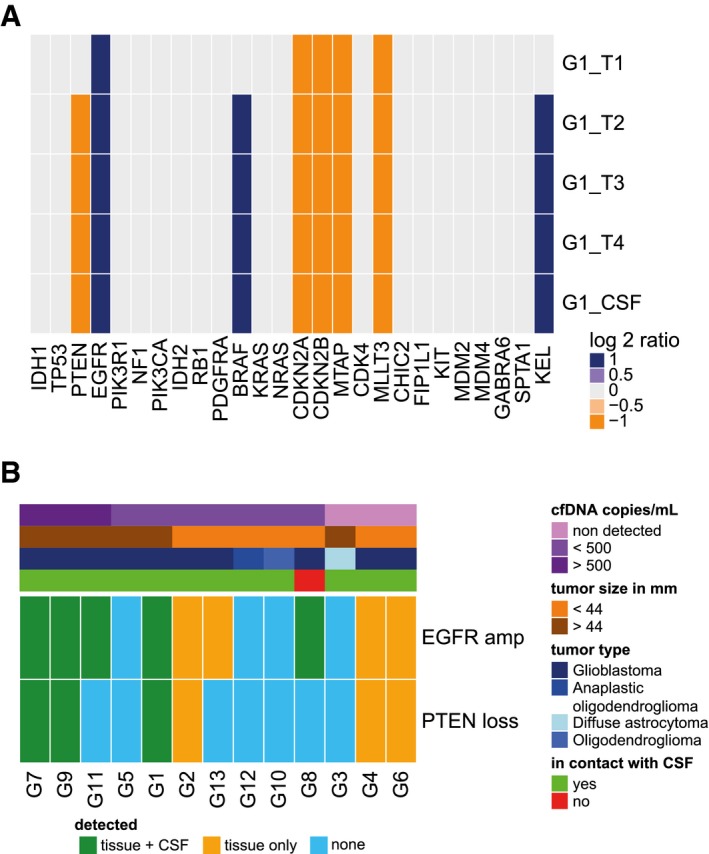
- A
Heat map summarizing the SCNAs detected by sWGS of 28 genes of interest in tumor biopsies and CSF from patient G1 (four tumor subparts and one CSF sample). Amplifications are shown in dark blue, deletions are in orange, and copy number neutral regions are in light gray.
- B
Heat map summarizing detection of EGFR and PTEN alterations in tumor tissue and in CSF samples. Shared detection in tissue and CSF is indicated in green, detection of the alteration only in tissue in orange, and non‐detection in blue. The top bars indicate the cfDNA concentration (copies/ml; in a range of purples), the size of the tumors (in a range of browns), the type of glioma (in a range of blues), and whether the tumor was in direct contact with the CSF or not (based on MRI, green or red, respectively). Samples are ranked from the left to right by decreasing concentration of cfDNA (copies/ml).
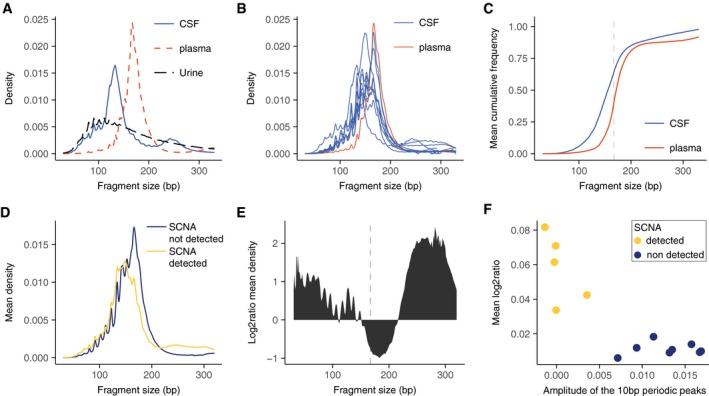
- A
Fragment size distribution, determined by sWGS, in CSF (blue line), plasma (red dashed line), and urine (black dashed line) from patient G1. The three samples were collected simultaneously before initiation of treatment.
- B
Fragment size distribution of cfDNA, determined by sWGS, in CSF from 13 glioma patients. The samples contained a high fraction of reads from DNA fragments with lengths corresponding to ˜145 bp and ˜167 bp. The fragment size profile of cfDNA from the plasma sample from patient G1 is shown in red. All samples were collected simultaneously before initiation of treatment.
- C
Cumulative frequency analysis of the average density of fragment size in CSF (blue) and plasma (red). The vertical dashed line represents 167 bp.
- D
Mean fragment size density in patients with detected SCNAs in the CSF (yellow), and those with no detected SCNAs (dark blue).
- E
Log2 ratio of the difference in cfDNA fragment sizes between CSF samples with detected SCNAs and those samples in which no SCNAs were detected.
- F
The amplitude of the 10 bp periodic peaks in fragment size is a signature for non‐tumor DNA in the CSF. The amplitude of the 10 bp periodic peaks in fragment length distribution (in the range between 75 and 150 bp, see Materials and Methods) when compared to the mean copy number alteration calculated from sWGS revealed a significant negative correlation (Pearson −0.85; P = 0.0002).
Comment in
-
Biopsy-free screening for glioma.EMBO Mol Med. 2018 Dec;10(12):e9484. doi: 10.15252/emmm.201809484. EMBO Mol Med. 2018. PMID: 30401728 Free PMC article.
References
Publication types
MeSH terms
Substances
Grants and funding
LinkOut - more resources
Full Text Sources
Other Literature Sources
