. 2018 Nov 13;2(21):2947-2958.
doi: 10.1182/bloodadvances.2018019158.

SNARE-dependent membrane fusion initiates α-granule matrix decondensation in mouse platelets

Affiliations

SNARE-dependent membrane fusion initiates α-granule matrix decondensation in mouse platelets

Irina D Pokrovskaya et al. Blood Adv. .

Abstract

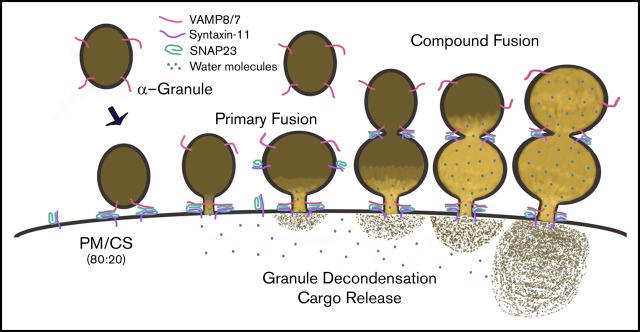
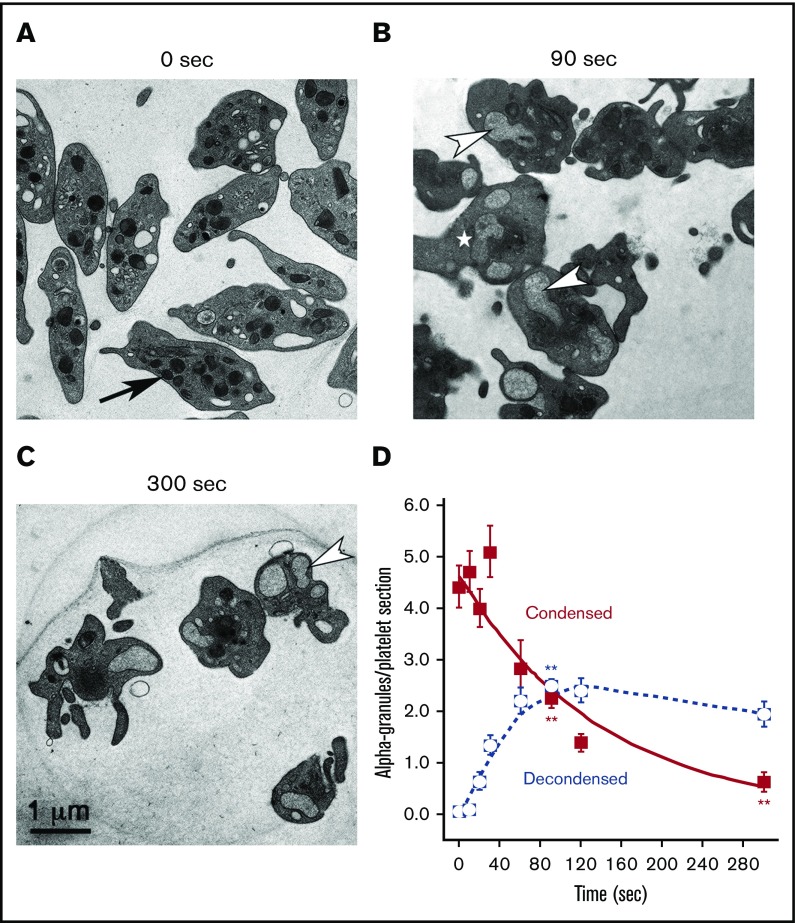
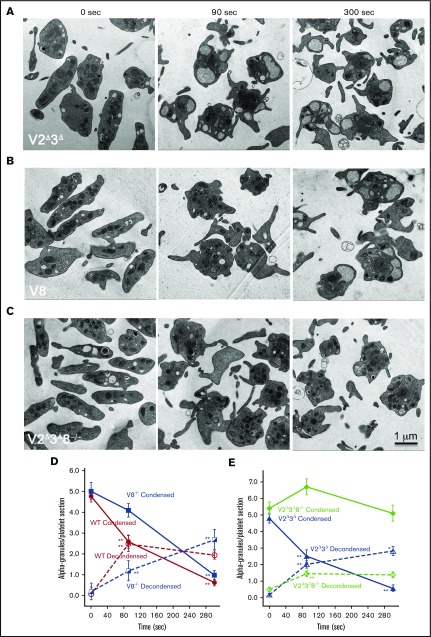
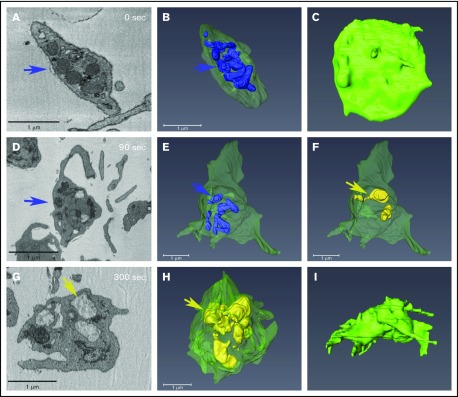
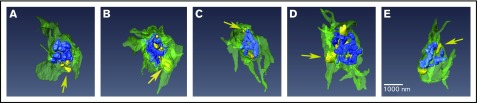
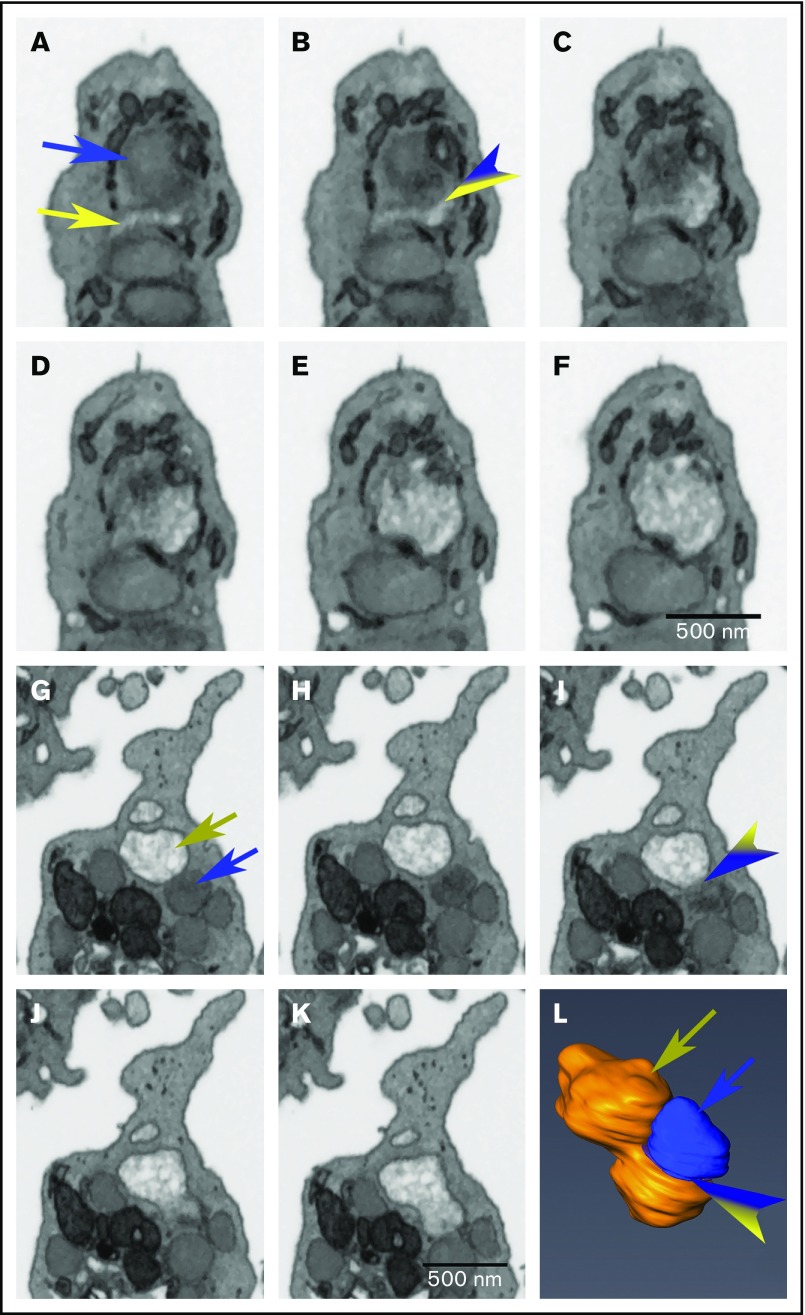
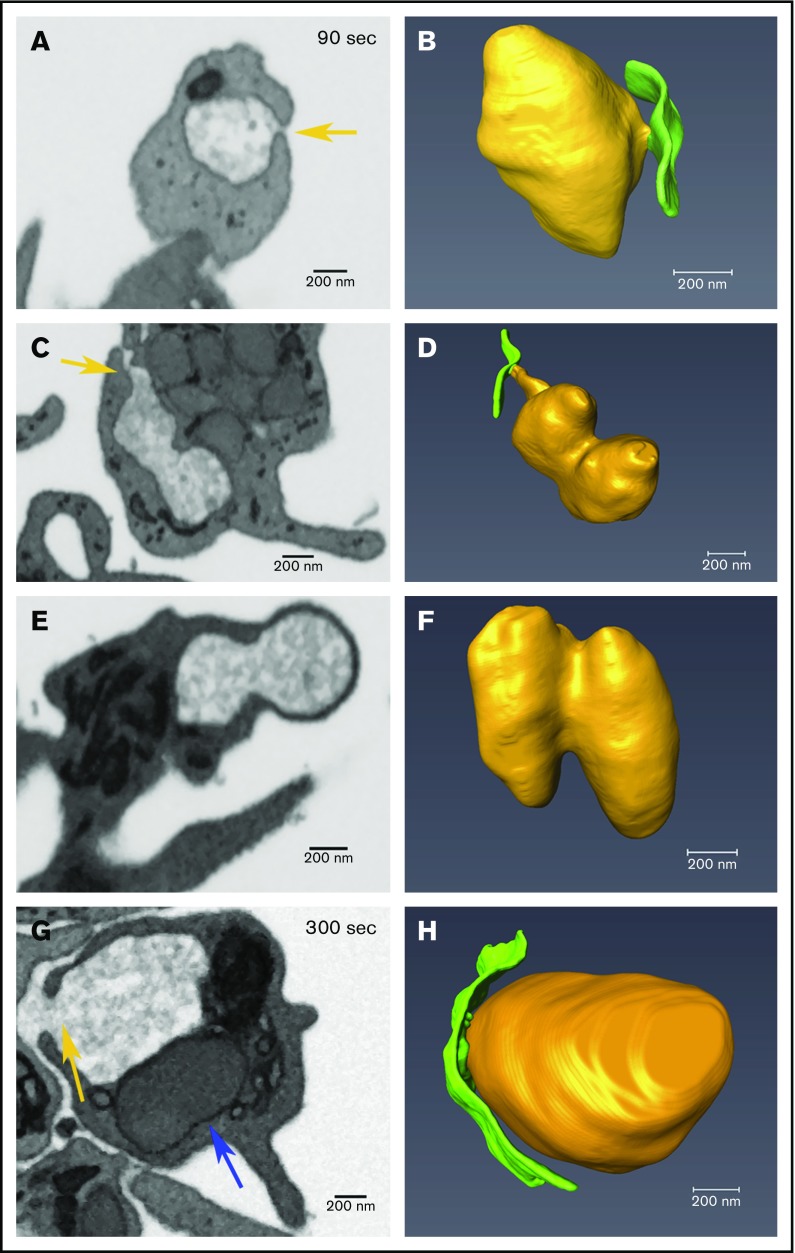
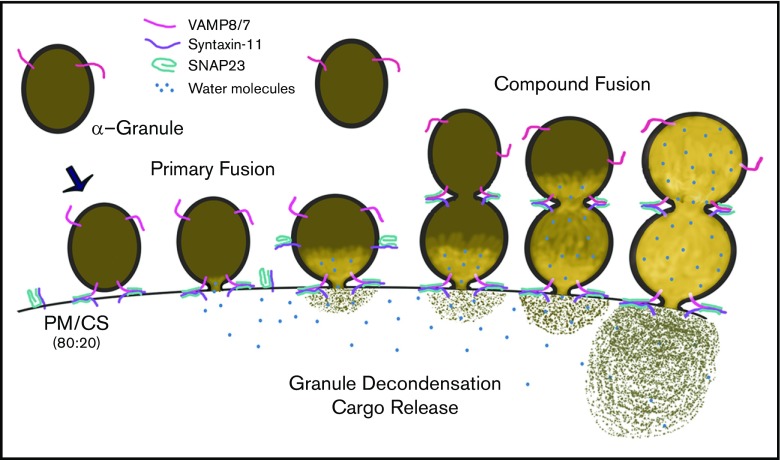
Platelet α-granule cargo release is fundamental to both hemostasis and thrombosis. Granule matrix hydration is a key regulated step in this process, yet its mechanism is poorly understood. In endothelial cells, there is evidence for 2 modes of cargo release: a jack-in-the-box mechanism of hydration-dependent protein phase transitions and an actin-driven granule constriction/extrusion mechanism. The third alternative considered is a prefusion, channel-mediated granule swelling, analogous to the membrane "ballooning" seen in procoagulant platelets. Using thrombin-stimulated platelets from a set of secretion-deficient, soluble N-ethylmaleimide factor attachment protein receptor (SNARE) mutant mice and various ultrastructural approaches, we tested predictions of these mechanisms to distinguish which best explains the α-granule release process. We found that the granule decondensation/hydration required for cargo expulsion was (1) blocked in fusion-protein-deficient platelets; (2) characterized by a fusion-dependent transition in granule size in contrast to a preswollen intermediate; (3) determined spatially with α-granules located close to the plasma membrane (PM) decondensing more readily; (4) propagated from the site of granule fusion; and (5) traced, in 3-dimensional space, to individual granule fusion events at the PM or less commonly at the canalicular system. In sum, the properties of α-granule decondensation/matrix hydration strongly indicate that α-granule cargo expulsion is likely by a jack-in-the-box mechanism rather than by gradual channel-regulated water influx or by a granule-constriction mechanism. These experiments, in providing a structural and mechanistic basis for cargo expulsion, should be informative in understanding the α-granule release reaction in the context of hemostasis and thrombosis.


Conflict of interest statement

Conflict-of-interest disclosure: The authors declare no competing financial interests.

Figures

None
Graphical abstract
Figure 1.
Figure 1.
α-Granule decondensation is a kinetic precursor of granule exocytosis. Mouse platelets were stimulated, or not, with thrombin for the indicated times, and reactions were stopped by the addition of glutaraldehyde/paraformaldehyde fixative. Aldehyde fixation can stop secretion in <1 second (cultured hippocampal neurons). (A) In electron micrographs of thin sections from unstimulated mouse platelets (0 seconds), α-granules appeared as round to ovoid structures marked by an electron-dense matrix. Upon thrombin stimulation (B-C; 0.1 U/mL), there was distinct accumulation of expanded (ie, decondensed) α-granules marked by residual loose fibrous matrix components. The arrow in panel A points to a condensed α-granule. The arrowheads in panels B-C point to examples of compound-fused, decondensed α-granules. The white star in panel B marks a decondensed α-granule showing variations in apparent matrix density. (D) Quantification of condensed and decondensed granules in platelets stimulated for increasing times. Numbers of platelet profiles scored: 0 seconds/0 time, n = 50; 10 seconds, n = 50; 20 seconds, n = 47; 30 seconds, n = 45; 60 seconds, n = 19; 90 seconds, n = 145; 120 seconds, n = 45; 300 seconds, n = 41. Means and standard errors of the mean are presented, and the graphs are color coded: condensed (red) and decondensed (blue). P values relative to 0 seconds were determined at 90 and 300 seconds. Values for both condensed and decondensed granules were statistically significant for both sets of comparisons. Asterisks indicating statistical significance, as determined with Student t test are as follows: **P ≤ .01.
Figure 2.
Figure 2.
Deletion of VAMP8 partially affected α-granule decondensation whereas deletion of VAMP8 in a V2Δ3Δbackground largely blocked α-granule decondensation. Thin section electron microscopy of V2Δ3Δ (A), V8−/− (B), and V2Δ3Δ8−/− (C). Platelets stimulated with thrombin for 0, 90, and 300 seconds are shown. (D) Number of platelet profiles scored: WT: (0 seconds/0 time, n = 200), (90 seconds, n = 145), (300 seconds, n = 41); V8−/−: (0 seconds, n = 50), (90 seconds, n = 50), (300 seconds, n = 50). (E) Number of platelet profiles scored: V2Δ3Δ: (0 seconds, n = 100), (90 seconds, n = 50), (300 seconds, n = 50); V2Δ3Δ8−/−: (0 seconds, n = 100), (90 seconds, n = 50), (300 seconds, n = 38). Means and standard errors of the mean are presented, and graphs are color coded as indicated. P values were calculated, using Student t test, and asterisks indicating statistical significance are as follows: *P = .01 to .05; **P ≤ .01. Note: The electron density of the α-granule matrix at 0 seconds appeared similar for platelets from WT and all 3 SNARE variants.
Figure 3.
Figure 3.
Condensed and decondensed α-granules distribution remains predominantly central during shape change in stimulated platelets. Each row shows various views of the same platelet. (A,D,G) Individual slices from SBF-SEM image stacks showing changes in platelets at various times of stimulation. Blue arrows indicate condensed granules; tan/yellow arrows indicate decondensed granules. (B,E,H) Condensed granules are rendered in blue, and decondensed granules in tan/yellow. (C,F,I) PM is rendered in green. A decondensed granule appeared to be connected to the PM via a long pipe as shown in panel F. Supplemental Figure 3 Movie shows the 90 seconds rendered example rotated in 3-dimensional space. α-Granule surface area and sizes were quantified from similar renderings for multiple randomly chosen platelets (see Figure 4 for additional examples), and the quantitation of their characteristics is reported in Tables 1 and 2.
Figure 4.
Figure 4.
Peripheral α-granules appear to decondense first upon stimulation. Renderings from SBF-SEM of 5 different platelets, stimulated for 90 seconds (A-E) are shown. Condensed granules are rendered in blue, decondensed granules are rendered in tan/yellow, and PM is rendered in green. Arrows point to examples of peripherally located, decondensed granules. Quantification of granule sizes is tabulated in Table 1. Bar represents 1 μm.
Figure 5.
Figure 5.
α-Granule matrix decondensation propagates from open canalicular system–granule fusion or decondensed-condensed granule fusion sites. Images are individual slices from FIB-SEM image stacks, and the frames shown are spaced 15 nm apart. (A-F) The blue arrow indicates a condensed α-granule, and the yellow indicates open canalicular system–elements (A). The variegated blue/yellow arrowhead indicates a CS-granule fusion zone (B). The dark tubular structures adhering to the decondensing α-granule are elements of dense tubular network. (G-L) The tan arrow indicates a decondensed α-granule (G), and the blue arrow indicates a condensed α-granule (G). The variegated tan/blue arrowhead indicates the decondensed-condensed granule fusion zone in the FIB-SEM slice (I) and similarly marks the fusion zone in a rendering (L) that is slightly tilted from the perpendicular relative to the FIB-SEM image planes. Bars represent 0.5 μm.
Figure 6.
Figure 6.
Decondensed α-granule membrane fusion in thrombin-stimulated platelets. Platelets were imaged by FIB-SEM at a nominal resolution of 5 nm in XYZ. Tan arrows point to examples of membrane fusion; 90 seconds stimulation (A-F) and 300 seconds stimulation (G-H). The left column shows single-slice images of platelets, and the right shows rendered images of decondensed granules (tan) and the PM (green). Two image sets show granules that track to the PM at 90 seconds stimulation, in one (A-B), the granule is linked to the PM fusion pore via a short neck, while in the other case the linkage to the fusion pore is by a longer pipe (C-D). (E-F) Two granules fused laterally (compound fusion), and these fail to track to either a PM or CS fusion pore complex. (G-H) A PM-granule fusion at 300 seconds with a larger neck/pipe. The blue arrow in panel G points to a rare condensed α-granule seen in a 300 seconds stimulated platelet. The incidence of α-granule fusion with PM and CS at various time points is quantified in Table 3. Bars represent 0.2 μm.
Figure 7.
Figure 7.
Graphic summary of the role of α-granule decondensation in granule cargo release. In this illustration, we represent the observed steps that occur during decondensation and release of α-granule contents. The v- and t-SNAREs (ie, VAMP8/7 and syntaxin-11/SNAP23) are indicated. SNARE-mediated fusion, water influx (blue circles), and granule/matrix decondensation are depicted as a sequence of events. Both primary and compound granule-granule fusion are shown.

References

    1. King SM, Reed GL. Development of platelet secretory granules. Semin Cell Dev Biol. 2002;13(4):293-302. - PubMed
    1. Heijnen H, van der Sluijs P. Platelet secretory behaviour: as diverse as the granules … or not? J Thromb Haemost. 2015;13(12):2141-2151. - PubMed
    1. Yadav S, Storrie B. The cellular basis of platelet secretion: emerging structure/function relationships. Platelets. 2017;28(2):108-118. - PMC - PubMed
    1. Meng R, Wu J, Harper DC, et al. . Defective release of α granule and lysosome contents from platelets in mouse Hermansky-Pudlak syndrome models. Blood. 2015;125(10):1623-1632. - PMC - PubMed
    1. Sharda A, Kim SH, Jasuja R, et al. . Defective PDI release from platelets and endothelial cells impairs thrombus formation in Hermansky-Pudlak syndrome. Blood. 2015;125(10):1633-1642. - PMC - PubMed

Publication types